AUDNZD Continues Downward to Test the .382 RetracementOn the Ausisie Kiwi we have a nice opportunity to sell the market targeting the .382 fib retracement of the recent bullish leg. This .382 fibonacci level displays significant confluence with the market structure looking left.
Price reversed off of the .5 fib retracement of the larger leg (zoom out), and with clear bearish RSI divergence, the market has begun a deeper correction to fresh lows.
Kiwi

NZDCAD LONGThis pair has entered a buy zone which it previously bounced off for 50 pips.
I have entered a long position again and look to take profit at a previous high.
Trade safe and good luck!

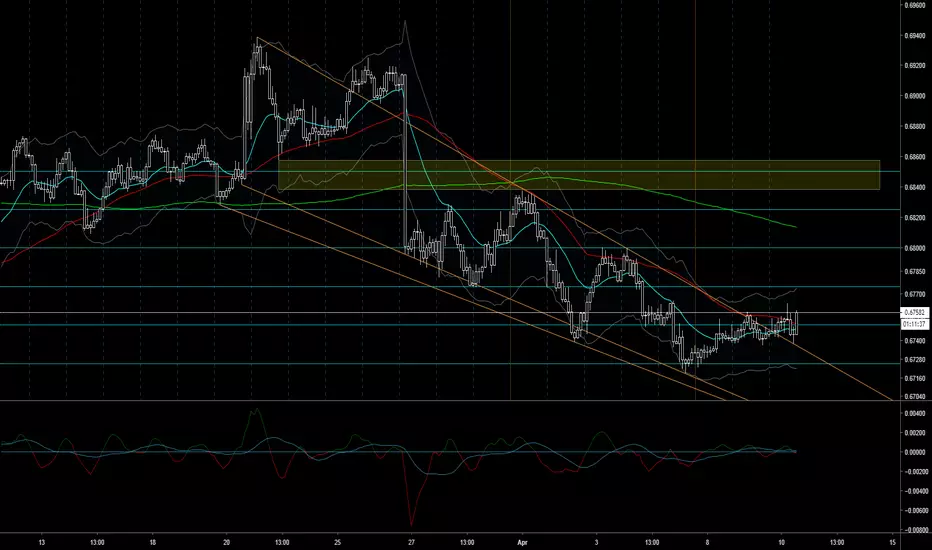
NZD: Waiting for a directional sign?By Andria Pichidi - April 18, 2019
The risk-on vibe in global stock markets was boosted by a strong set of data out of China this week and strong Labor data out of Australia overnight, which gave buoyancy to the Australian and Canadian Dollars. However, as Aussie outperforms, the sub-forecast CPI data out of New Zealand yesterday have underpinned the New Zealand Dollar, and sent NZDUSD to a 3-month low at 0.6665.
Since November, the 0.6700 has been a key Support level for the asset. Even though yesterday Kiwi’s bulls managed to lift it back above the 0.6700 hurdle, this sharp decline, along with the continuous drop of the pair for a 4th week in a row (outside of a descending triangle), strengthens negative bias.
The pair holds for a second consecutive day below 200-DSMA, while it’s been below 10-, 20- and 50-day SMA since March 27. This, along with the Moving averages pointing to the downside and momentum indicators being negatively configured, suggest more possible losses in the near and medium term picture.
The RSI indicator is looking south, while MACD keeps extending in the negative area, implying a negative momentum rising.
Hence, a confirmed close below 0.6700, could propose the end of the sideways movement as the bears have taken the control of the market. Therefore the doors towards January’s low at 0.6580 level will open.
On the flip-side, a rebound could face an immediate Resistance at 20-day SMA and week’s peak, at 0.6770-0.6780 area.
Disclaimer: This material is provided as a general marketing communication for information purposes only and does not constitute an independent investment research. Nothing in this communication contains, or should be considered as containing, an investment advice or an investment recommendation or a solicitation for the purpose of buying or selling of any financial instrument. All information provided is gathered from reputable sources and any information containing an indication of past performance is not a guarantee or reliable indicator of future performance. Users acknowledge that any investment in FX and CFDs products is characterized by a certain degree of uncertainty and that any investment of this nature involves a high level of risk for which the users are solely responsible and liable. We assume no liability for any loss arising from any investment made based on the information provided in this communication. This communication must not be reproduced or further distributed without our prior written permission.

AUDNZD - long till 61.8This is not an easy setup despite a clear picture. Post breakout pullbacks are S/L triggers, so I will wait to see a further break up, and then a pullback. Here I will try a second option long entry.
Risk event
- NZD inflation figures (Wed)

VIDEO ANALYSIS: NZDUSD SWING TRADE UPDATEIn this video update, we take a look at the swing trading opportunity we identified in yesterdays youtube video.
We are expecting the price to continue to move higher after finding support. As it is a Friday you can look
to manage the trade in accordance with your own trading plan.

NZDUSD Ready for a ride to 0.6900Swing trading! Here i am showing you a behind my technical analysis, you can see better why i entered in one of the better setup i had in the year. doji formations and a beautiful head&shoulder pattern

NZDUSD SHORTI had this trend line drawn up since March and it has now been broken.
A retest of this line and rejection can be seen,with a bearish pattern forming on the lower TF's.
Trade safe and good luck!

NZDUSD Clean and simple (NOT EASY)Ok, for all the people asking me why i have clean all my charts... i have a lot going on in my charts, but im not gonna share all of my effort for free, im giving you the call. For me that is enough. If you want to learn how i do my analysis and how you can improve your trading: DM me in this platform for mor info. Enjoy the profits my friend

Kiwi Quarter ... 1st traded quarter of the weekLooking for a 75 tap from 6750 for a completed quarter.
Will only be 37 pip range on the day giving Kiwi more room in its 55 - 75 ADR
Continuation targets marked as green dots
Failure at 75 could lend itself to full retracement and then some
DXY looking vulnerable to solid losing of 97 level

Kiwi looking Long towards NTZ 6850Continuation of the wedge breakout could see Kiwi target No Trade Zone from 3/26/19 RBNZ release highlighted in shaded box.
Looking for 6850
EURNZD Short Opportunity to 1.62250EURNZD has been showing a slow momentum to the upside and has been grabbing liquidity from both sellers and buyers while struggling to break higher.
If the liquidity holds with dominance of the sellers . and breaks the Black Critical Level then we will see a meltdown to our first target of 1.62250.
1 / 11 Risk Reward ratio.
This is an average trade for AR Financials and students.
We target between 1/5-1/30 Risk Reward ratio.

NZDUSD Ready to Drop on Strong USD DataAfter last week's decisive break through support we tested the second level of support (based on previous lows in the trend) and bounced off with a brief recovery the following day. However, the pair was unable to confirm a reversal back to the upside when it failed to close the day above support level one indicating that we may indeed have begun trending downward. Tomorrow brings with it several heavy hitting data releases and that could be all that is needed to trigger this move.
On the larger scale W1 chart we can see that the pair has been consolidating for the last several months and the pair does seem due to continue the downtrend which began around the start of 2018.

Kiwi still a short .. Ive fine tuned this system i'll call Kiwi Quarters.
Theres quite a bit I watch but the premise is simply Kiwi price action tends to move to the quarters 00 25 50 75
Average daily range is <50 or 2 quarter zones and weekly offering up typically 250 to 400 pips
Ill post my results from this weeks efforts

Kiwi index approaching Support, Prepare For A further riseKiwi index is approaching its support at 6.9441 (61.8% Fibonacci extension , horizontal swing low support, 61.8% Fibonacci retracement ) where it could potentially bounce to its resistance at 7.0079 (38.2% Fibonacci retracement , horizontal swing high resistance).
Stochastic (89, 5, 3) is approaching its support at 4% where a corresponding bounce could occur.
Trading CFDs on margin carries high risk.
Losses can exceed the initial investment so please ensure you fully understand the risks

NZDUSD weekly outlookLowest weekly close this year, has the range (between $0.674 - $0.69) been broken or a reversal on the cards next week?
First support to downside is the 50% retrace & july low/september highs. Ultimate low in this triangle formation coincides with the 61.8% retrace @$0.663
4hr:
Break below trend line(pink) & median line, gives a bearish outlook for start of week

VIDEO ANALYSIS: NZDUSD FINISHES WEAKERNZDUSD remains weak across the board as we outlined in our market outlook this week. We expect this
to continue against the stronger currencies however we may see some buyers step back into the
market at the key demand zone here. This will be likely ad the DXY sits at the key resistance, any USD weakness
will help the NZDUSD price push higher.

SHORT Kiwi Index Approaching Resistance, Prepare For A Reversal
Kiwi index is approaching its resistance at 7.050(100% Fibonacci extension , 50% Fibonacci retracement , horizontal swing high resistance) where it could potentially drop to its support at 6.990 (61.8% Fibonacci extension ,50% Fibonacci retracement , horizontal swing low support).
Stochastic (89, 5, 3) is approaching its resistance at 91% where a corresponding bounce could occur.
Trading CFDs on margin carries high risk.
Losses can exceed the initial investment so please ensure you fully understand the risks.

Kiwi Index Approaching Resistance, Prepare For A Reversal
Kiwi index is approaching its resistance at 7.050(100% Fibonacci extension, 50% Fibonacci retracement, horizontal swing high resistance) where it could potentially drop to its support at 6.990 (61.8% Fibonacci extension,50% Fibonacci retracement, horizontal swing low support).
Stochastic (89, 5, 3) is approaching its resistance at 91% where a corresponding bounce could occur.
Trading CFDs on margin carries high risk.
Losses can exceed the initial investment so please ensure you fully understand the risks.

NZDUSD Possible Bearish Breakout!We have a confirmed break below the lower bound of the D1 trend with yesterday's candle closing a solid 30 pips below my trend line. However, the pair appears to have found support at the previous low of the trend and may be in the very early stages of forming a double bottom. With the Asian session warming up over the next few hours, I will wait for confirming price action in one direction or the other before taking a position on this. Looking at the weekly chart, this appears to possibly be a break out of 4+ months of consolidation continuing the previous long term downward movement.

NZDCAD (4H) - a wild one but with potentialNZDCAD is a very wild bucking bronco. Recent price action in a ranging market holds some potential for long or short positions. But at this time it's a waiting game. Avoid FOMO.

NZDUSD POPTENTIAL SHORT OPPORTUNITY (1D CHART) NZDUSD POTENTIAL SHORT
IF YOU TAKE A LOOK AT THIS CHART YOU CAN SEE ON THE DAILY TIMEFRAME THAT THE KIWI HAD A VERY STRONG REJECTION OF STRUCTURE SHOWING STRONG SELLER MOMENTUM AND INTEREST. I ALWAYS LET THE MARKET SHOW ME CLEAR SIGNS OF WHAT IT WANTS TO DO. THIS CHART IS DISPLAYING THAT THERE IS A DECENT PROBABILITY OF GOING TO THE DOWN SIDE. NOW THERE IS AN ASCENDING TREND LINE AND IF WERE LOOKING TO EXTRACT PROFITS FROM A POTENTIAL SHORT SETUP THAN WE MUST WAIT FOR THE MARKET TO BREAK THAT TREND-LINE, JUST TO FULLY CONFIRM THE SELLER IS IN CONTROL. LETS TAKE A LOOK AT THIS SETUP
1D CHART:
*ON THIS TIMEFRAME WE CAN SEE THAT THERE WAS A REJECTION OF RECENT SIGNIFICANT STRUCTURE AT THE .6900 PRICE HANDLE
*SINCE THE SELLERS HAVE BEEN HOLDING PRICE BENEATH THIS POINT FOR SOME TIME ON SUCH A HIGH DATA TIMEFRAME IT SHOWS ME A HIGHER LIKELY CHANCE IT WILL MAKE A MOVE TO THE DOWNSIDE
*WAIT FOR A BREAK AND HOLD BENEATH THE ASCENDING TREND-LINE ON DAILY TIMEFRAME
4H CHART:
* THIS CHART CAN BE USED TO SPECIFY THE ACCURACY OF THE PRICE ACTION AND HELP GET A BETTER PICTURE OF WHAT IS OCCURRING ON THE TIMEFRAME BENEATH THE DAILY AS WELL
*ONCE THE 1H AND UP ALIGNS WITH THE DAILY SELLER POWER THAT WILL LEAD TO A STRONG CORRELATED MOVE
REMEMBER TO ALWAYS USE PROPER RISK MANAGEMENT. NONE OF THE SETUPS I POST GUARANTEE PROFIT TRADE AT YOUR OWN RISK.
PLEASE LIKE AND FOLLOW MY PAGE FOR MORE PROFITABLE SETUPS! CHEERS!

NZDUSD demand failTook a long on this pair. didnt react as I expect of a demand level. Close it before hitting the SL for -20 pip loss.

SHORT Kiwi index Approaching Resistance, Prepare For A ReversalKiwi index is approaching its support at 6.8787(61.8% Fibonacci extension , 50% Fibonacci retracement , horizontal swing low support) where it could potentially bounce to its resistance at 6.9528 (50% Fibonacci retracement , 61.8% Fibonacci extension , horizontal swing high resistance).
Stochastic (55, 5, 3) is approaching its support at 3% where a corresponding bounce could occur.
Trading CFDs on margin carries high risk.
Losses can exceed the initial investment so please ensure you fully understand the risks.
