KMDBTC
$KMD Bouncing from ATL BTC support at 9K sats..$KMD UCTS Buy signal on the 6h following the bounce from the ATL BTC support at ~9k sats...
If it manages to keeps pushing up, next target should be at 13k sats for a 18% movement from current level...
RSI started to rise from oversold levels and MACD bullcrossed.
#KMD


$KMD Long. Weekly OBV & RSI bullish divergence. $KMD Long. Weekly OBV & RSI bullish divergence. Forming new ALT.

KMD continues to hold LT supportWith most alts making new lows and showing weakness with this BTC move, KMD continues to show strength despite dropping back down near lows
If we hold its Nov lows, we could be set to return to local highs as this remains a very strong project
Thanks!

Altcoin TOP 54 - KMD/BTC Altcoin TOP 54, capitalization $ 166 million
The indicators (RSI, AO) are a good bullish diver.
"ACUPULATION zone" on the chart is a favorable price range for recruiting positions.
For the next 3-4 weeks there are interesting events on a coin (in particular, the launch of the Antara framework on July 15).
FCAS rating in the region of 600 is a live project.
Immediate goals indicated on the chart. 0.0001400-1500 - good support.
Looks promising in the middle. You can consider buying at a small% of the deposit.

$KMD Sitting over support at ~17k sats with a double test $KMD Sitting over support at ~17k sats with a double test
Volume looks exhausted on the selling side
I'm waiting for some more confirmation (volume, start to break to the upside) to confirm a potential entry.
Taking a position with a tight SL is also valid.
#KMD


Binance, KMDBTC, Shall we hit 2455 ?Buy Zone: 2037-2091, 1983-2037,
Take Profit:
1 >> 2167-2213,
2 >> 2265-2295,
3 >> 2390-2455,
4 >> Above 2547

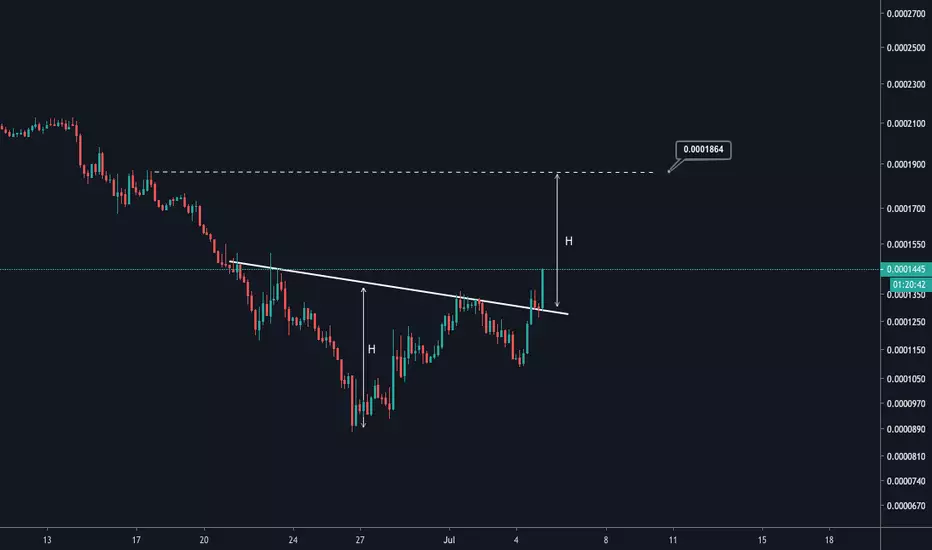
KMDBTCKMDBTC
Exchange: Binance
Coin: #KMD
Entry: 1500 ₿
TP1: 1820
TP2: 1980
SL: 1350
Risk/Reward: 2.36

KMD GodLikeKMD weekly play
361.8% is the fibo to reach all day long, just like the previous move and set another higher high. For this we need to find support above 61.8% fibo.

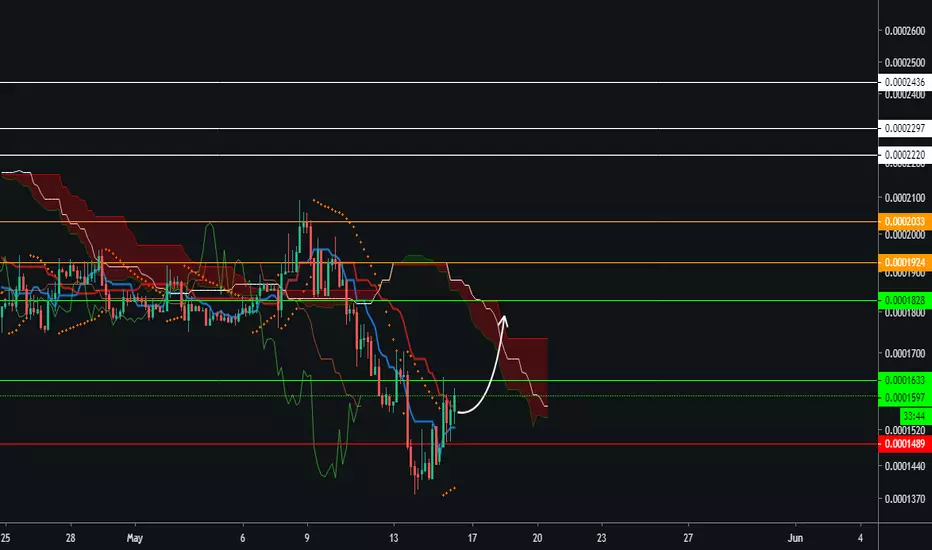
$KMD Looks ready to make some movements... $KMD Looks ready to make some movements...
UCTS Buy signal on the daily chart since yesterday
Volume rising (remember volume preceeds price)
MACD Bullcross and RSI rising (divergences also visible)
Breaking from descending channel...
#KMD

Komodo Looking for a Breakout? ($KMD/$BTC)Looking at it from different perspectives here... From ATH and playing a downward trendline here with recent activity, shows a breakout north. Consequently, it has reached earlier support (now resistance) 12/2017. Whereas also other trendline from candle closes in 12/2017 would place us near the 99 EMA for resistance and better confirmation for me to know if this is heading north around 2100-2200 SAT level.


KMD seems to have BOTTOMED! If KMD could get above this resistance level we could see a very quick move up back to the POC
MFI is trending higher as well, which bodes well for a potential move up in the coming days/weeks


Komodo Hits Demand Zone: Double Bottom + Bullish DivergenceKomodo (KMDBTC) Chart Analysis
KMDBTC Long term chart:
Here we are looking at a double bottom on the long term weekly chart for Komodo (KMDBTC).
After this demand/support zone was hit last time, back in November 2018, KMDBTC went on a bullish wave that generated 190% profits. We believe that the next wave can be even bigger, we are looking at around 250% profits from the current price to resistance. Up to 720% in profits to ATH.
Bullish divergence on the MACD.
Increasing trading volume.
Let's take a closer look to see the different signals in the making (main chart above):
The bullish divergence on the above chart is marked with a purple arrow and is showing up on both the MACD and RSI.
Now trading above EMA10 (needs a close above it on the daily time frame for signal confirmation).
Komodo (KMDBTC) hit strong support (demand zone) and is very likely to produce a bullish wave within the next 1-3 weeks.
All details are shared on the chart.
Feel free to hit like to show your support.
This is not financial advice.
Namaste.


kmdbtc still in this sideways channel, gives us some nice swingsKMD is in a nice sideways channel. Buy area 1390. sell 1560-1630.

KMD bounce off ATL (long)OBV looking extremely bullish. MACD bull cross in next few days. At strong support. Tons of FA related news coming this summer.

KomodoWe've seen KMD is a giant coin so far. After a massive move in its last bull run, correction started and finally 1430 stopped it. I believe it's a huge potential trade setup. Targets are lined in the chart . Hope you enjoy it.