PSX 100 index zones 16/5/2025PSX 100 index zones for 16/6/2025
Bullish 122523
Bearish 121764
It is expected in bullish zone. Note: This is not a buy/sell trade call. It is an analysis.
Kse100

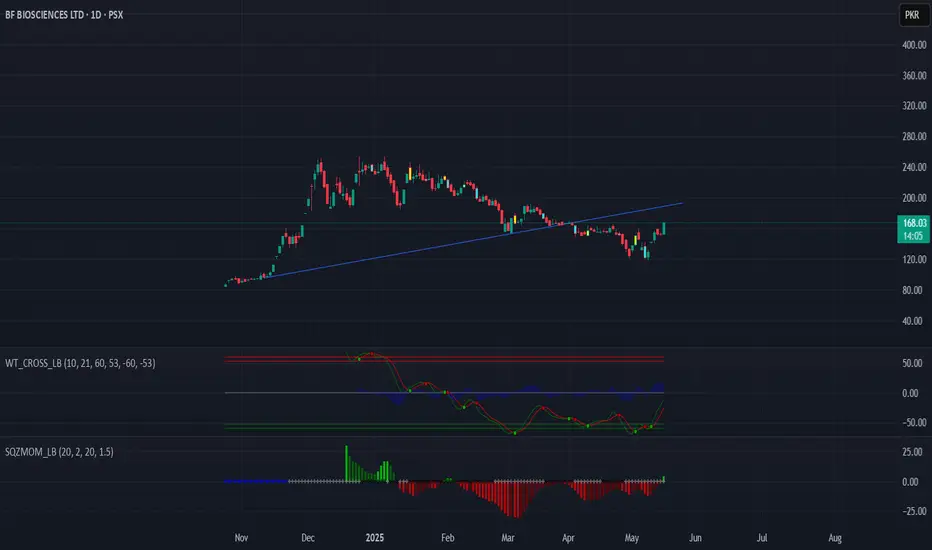
BF BIOSCIENCE BullishBUY SIGNAL...!!!!
Recent Price Movement: As of May 16, 2025, BFBIO's stock price closed at PKR 168.03, marking a 10% increase for the day. Over the past week, the stock has risen by 11.86%, although it has experienced a 3.45% decline over the past month.
TradingView
Technical Analysis: The stock is currently in a bullish zone, with analysts suggesting potential movement towards the PKR 200–250range in the near future. WT Cross indicators shows a great breakout from -55 zone which shows a strong trend reversal where as squeeze momentum breakout green histogram
Moving Averages: The 5-day and 50-day moving averages are at PKR 153.76 and PKR 143.35 respectively, both indicating a bullish trend.
Investing.com
Relative Strength Index (RSI): The 14-day RSI stands at 62.67, suggesting that the stock is approaching overbought territory, which often precedes continued upward momentum
KSE 100 index strong resistance levelsKSE 100 index strong resistance levels
119664, 122571, 132431, 140142, 145325, 157838 and 177941

Play on LevelsImmediate Resistance is around 360 - 361
Weekly Closing above this level would be
a +ve sign & may move the price towards 385 - 387

Played exactly the same as predicted last week. KSE100 Closed at 114113.94 (02-05-2025)
Played exactly the same as predicted last week.
Now seems like Hidden Bullish Divergence is appearing.
Important Supports :
S1 around 113100 - 113400
S2 around 110500 - 110800
Important Resistances :
R1 around 114630 - 115120
R2 around 117000 - 117500

PAEL SETUP ONCE AGAINPAEL is currently at its orderblock zone where the liquidity is resting if volumes come in at this level then we can expect a bounce again if the orderblock fails and there is no liquidity in OB then wait for downside levels and if the weekly ema 21 is broken then i see 30 level coming but still we will look into some more levels for now just focus on this orderblock
the previous supply is completed here

KSE 100 index (PSX 100 Index) could drop to 110,580This is day time frame chart of KSE 100 index. These are fabionacci levels.
120,898, 110576, 104191, 99030, 93870.

Seems like Bearish Divergence is somewhat Sync now.
Closed just above Weekly Trendline Support
(i.e. above 115000)
as mentioned during last week.
However, the Daily Candle Closed below the
Trendline Support; that means 116000 is the
Immediate Resistance that needs to Cross &
Sustain.
In case of Selling, we may witness 112800 - 112900
as Important Support.

Interloop - ILP: Potential Bullish The chart for Interloop Limited (ILP) shows the stock currently trading within a downward-sloping channel, with clear support at 59.14 (marked by the yellow line) and resistance at 61.42. The price has been consistently testing the lower boundary of this channel, and the support level at 59.14 has held in the past, indicating it could offer a potential bounce. If the stock manages to hold above this support, it could initiate an upward move.
A breakout above 61.42 would be a strong bullish signal, suggesting the stock could continue to rise towards the next resistance levels around 64.00 or higher. However, if the price fails to maintain support at 59.14, it could slide further down to 52.86, marking the next significant support level.
Overall, the stock is in a downtrend, but the current setup provides an opportunity for a potential reversal if it successfully breaks the resistance and holds above support.

KSE 100 BULLISH OR BEARISH?KSE 100 is also bleeding as the global markets sell off. But the key indicator right now is to look at EMA 21 at weekly time frame on all big stocks and index. if we see a good bounce from ema 21 we might see volumes coming in big stocks. enjoy the show being played globally!

MLCF AS PLANNEDMLCF respected all the level and did exactly as marked. I was just going through my previous analysis and just looked at this amazing chart. thought to share with you! look at the patterns and the perfect breakout retest strategy I mostly play with.

FFL THE PERFECT SETUP REVIEW AS DEFINED FFL tested the same key levels which I find through secret price action and institutional order flows. I don't want to repeat you can just look at the chart and its beauty.

PAEL - THE BEST SETUPPAEL has always been my favorite stock as it plays very well on price action and technical.
Right now the trending accumulation has ended and its time for a move.
if we take the simple and basic previous demand copy. It gives the target of 60 which everyone is expecting. but there might be some trick played to take out the retails. so be careful around 55 and 59 level you might see the trend slowdown in short term due to divergence on RSI.
right now if you want to accumulate more wait for the intraday retest levels around 46 to 44.
I HAVE ALREADY ENTERED THIS SETUP AROUND 43.
THE TAKE PROFIT IS 55 AND THEN 58 TO 59 ACCORDINGLY.

Still Bullish on Bigger Time Frames.Still Bullish on Bigger Time Frames.
Hidden Bullish Divergence has appeared.
Immediate Resistance lies around 186 - 189
Crossing this Level with Good volumes may
expose 197 - 200
Fresh Entry should be Triggered if 205 is Crossed
& Sustained; only then it may resume its Uptrend.

Double BottomDouble bottom with Bullish Divergence
Immediate Targets around 43 - 45
Support is around 39 - 39.50
Should not Break 37.50

Recently made LL on Shorter TF, but..Recently made LL on Shorter TF,
but also it is a Support level with Double Bottom.
Hidden Bullish Divergence on Daily TF.
Immediate Support lies around 86 - 89
& Immediate Resistance is around 91 - 92.
Sustaining 91 - 92 on Weekly TF, would
lead it towards 98 - 99.
Ultimate Target (if 109-110) is Sustained,
is around 128 - 130.
Should not break 81 now.

Hidden Bullish Divergence on Shorter Time Frame.Check out the levels for HCAR of all time frames from Monthly, Weekly to Daily.
Hidden Bullish Divergence on Shorter Time Frame.

Bullish Divergence on Monthly TF.Bullish Divergence on Monthly TF.
However, a Very Strong Resistance is around
44 - 45.
39.50 - 40 may act as a Daily Support Level but
it resisted twice from 42.
34.50 - 36.50 seems to be a Strong Support which
is also a Confluence area of 2 Important Tools.

Monthly + Weekly View
If Monthly Candle closes above 95, it would
confirm a Morning Star Formation which is a
Positive Sign.

Important Support level159 - 163 would be a Very Good Support Level
as this Support is of Monthly TF. So Patient Traders /
Investors may wait for this level; which seems bit
difficult (as of now) due to Bullish Divergence on
Shorter TF.
180 - 185 is an Important Resistance.

HL Confirmed on Weekly.HL Confirmed on Weekly TF around 92.
Bullish Divergence on Daily TF.
Crossing 107 with Good Volumes
may lead it towards 112 & then 120+

Good Financial Results.169 - 175 can be a Good Support Area.
Better Financial Results.
Should not Break 162 even in Worst Cases.
Crossing 180 may lead it towards 190 - 193.

Breakout ExpectedSymmetrical Triangle Formation.
Breakout Expected around 116000;
Targeting 126000 if 118700 - 119000 is sustained.
Important Support Levels:
S1 around 111500
S2 around 108500 - 110200
Immediate Important Resistance is around 119000
