KSM Kusama -Let's go to 500 🗾🗻Our updated chart on KUSAMA KSM. Price is nicely over support, that is a beautiful cushion for a nice risk/reward trade we are taking today.
Target is 500..or higher.
Let's hope Bitcoin helps (at least to go sideways if no rise) and KUSAMA can fly again
the FXPROFESSOR
KSM

Kusama ($KSM) channel breakout?$KSM was on fire after the announcement that parachain auctions were starting. A natural correction of the overhype has been in play for the last 12 hours, also dragged down by $BTC pulling back to 36k. $BTC is on the rise again but $KSM has broken out of its downward channel, coming back to test the top of it and not potentially breaking out to the upside. On the 15 minute chart there could be a good scalping opportunity here given $BTC has continued in the upward direction while $KSM came back to test the top of the channel.

KSM Long Trade 20210610Signals: Blue -> Green
KSM, KSMUSD,KSMUSDT,KSMUSDTP, CRYPTO,CRYPTOCURRENCY
DISCLAIMER
This is only a personal opinion and does NOT serve as investing NOR trading advice.
Please make your own decisions and be responsible for your own investing and trading Activities.

Let the Canary Fly! Bullish on KSM.I've never been more bullish on Kusama (KSM). For those of you not familiar with the Polkadot ecosystem, Kusama is Polkadot's wild cousin or its canary network. Basically, Kusama has nearly the same codebase as Polkadot, but the main purpose of KSM is to be the proving ground for projects before they can deploy on Polkadot, kind of like a test network. For full comparison, you can check out this article: polkadot.network
Why I trade/invest in Kusama? (doesn't necessarily mean you should too, none of this is financial advice)
Fundamental Analysis:
-Parachain Auctions are coming. This will cause an increased demand once the auction starts and also a supply shock since the projects are required to lock those KSM up. (This is too long to fully explain so DYOR on this. There are videos on Youtube that provide simple explanations about parachain auctions.)
-If you're bullish on Polkadot, you have to be bullish on KSM too. A robust DeFi ecosystem, that could be up to par with Ethereum's, has already started building on both.
-Had higher ROI so far compared to it's cousin Polkadot. My guess is some people have only started to realize just how important KSM really is to the DOT ecosystem, rather than just a simple test network.
-Has a lower circulating supply and inflation rate. KSM has 8,980,098 circulating tokens compared to DOT's 996,120,387; and has an annual inflation rate of ~10% compared to DOT's ~12%. Some sites like Coingecko say it has a max supply of 10M, but I couldn't find an official source for that though.
Technical Analysis:
By looking at this log chart, we can see that KSM has respected this ascending channel ever since. The upper trendline has acted as strong resistance and we've only seen a fakeout once before its recent all-time high, while the lower trendline has been acting as strong support and just recently got tested again as support during this correction. I expect for KSM to have another go at the upper trendline within the next couple of weeks.
Additional bullish indicators:
-We could clearly see a hidden bullish divergence which is a bullish continuation indicator. (green lines)
-21W SMMA acted as support and we are currently trading above the 21W EMA. A close above 21W EMA this week will make it even more bullish.
That's all I have for now, and as Kusama's taglines go: "No promises. Expect Chaos."
Good luck on your trades!

$KSM Moon soonOnly a matter of time before $KSM moons. The parachain news will heat it up like the sun

KSMUSDTHello to you all. Mars Signals team wishes you high profits at all times.
We are in a time frame of 4 hours. The price became a good pump as we expected and we put the signal in the channel. And it touched the targets. The price can re-enter the bullish channel after a pullback to the level of the dashed line, and in case of losing the price, we have specified the support for you.
Warning: This is just a suggestion to you and we do not guarantee profits.
Wish you luck!

Going long with Kusama KSMThe title of the article said "Kusama Parachain Auctions", and that was enough for me to jump onboard. I hereby quote from the article:
"The first real-world functional parachain Statemine, began processing permissionless transactions after an on-chain upgrade last week. After some smooth running over the weekend, the time is coming to move to the next stage: slot auctions."
polkadot.network
Technically we have a cup and a handle, and a chance to go parabolically towards new ATH that I have set using FIB R with 50% gains.
Blue line is my entry, green line is my target.

KSM Inverted H&SPotentially reaching ~$760 if this inverted H&S plays out, however overall market conditions (i.e. what bitcoin will do) will ultimately dictate if this plays out or gets invalidated.

KSM - Long ? $KSM
The market of #KSM holds pretty strong considering others.
If we consider $BTC market as being in a small correction phase (low TF) we can think that $KSM might respect the bull flag pattern & head to $493.
2nd T - $617.
Increasing volume.

KUSAMA- Also an Option for attempting a reboundUpdate KUSAMA chart. On support.
again, please be careful, the markets are volatile and nasty. Attempt to buy with care (stop loss under support, just in case) and with a reasonable Take Profit Level.
the FXPROFESSOR

$KSM, Retesting crossed level at ~.011 sats$KSM
Retesting crossed level at ~.011 sats
If manages to bounce/ gain traction from here, it will probably go for the ATH (~20%)
UCTS indicator bullish across the board
#KSM

Long - KSMLong
Reasoning
Holding above old resistance confluent emas 34/72 and breakout trendline,
Stoch RSI indicates more move up,
Long in a retest. Details in the chart.

💡Don't miss the great buy opportunity in KSMUSD @kusamanetwork
Trading suggestion:
". There is a possibility of temporary retracement to the suggested support line (380.00).
. if so, traders can set orders based on Price Action and expect to reach short-term targets."
Technical analysis:
. KSMUSDT is in a range bound, and the beginning of an uptrend is expected.
. The price is above the 21-Day WEMA, which acts as a dynamic support.
. The RSI is at 50
Take Profits:
TP1= @ 452.78
TP2= @ 487.25
TP3= @ 553.50
TP4= @ 624.76
TP5= @ 660.56
SL= Break below S2
❤️ If you find this helpful and want more FREE forecasts in TradingView
. . . . . Please show your support back,
. . . . . . . . Hit the 👍 LIKE button,
. . . . . . . . . . Drop some feedback below in the comment!
❤️ Your Support is very much 🙏 appreciated!❤️
💎 Want us to help you become a better Forex / Crypto trader?
Now, It's your turn!
Be sure to leave a comment; let us know how you see this opportunity and forecast.
Trade well, ❤️
ForecastCity English Support Team ❤️

Kusama looks extremely bullish, if only BTC does not dumpWe have a W pattern (blue lines) that can also be viewed as a cup and handle (yellow lines)
If BTC don't dump and KSM breaks out of the yellow triangle the price target is at the ATH !
Fundamentally this coin deserves much bigger market cap, i am sure it will be more profitable than ADA and DOT, long term easy x10
If unfortunately BTC dumps a good price to buy KSM is at around the 200 D EMA level @ $267 that acted as a support.
Wish you the best, take care.

💡Don't miss the great buy opportunity in KSMUSDT @kusamanetwork
Trading suggestion:
". There is a possibility of temporary retracement to the suggested support line (380.00).
. if so, traders can set orders based on Price Action and expect to reach short-term targets."
Technical analysis:
. KSMUSDT is in a range bound, and the beginning of an uptrend is expected.
. The price is above the 21-Day WEMA, which acts as a dynamic support.
. The RSI is at 50
Take Profits:
TP1= @ 452.78
TP2= @ 487.25
TP3= @ 553.50
TP4= @ 624.76
TP5= @ 660.56
SL= Break below S2
❤️ If you find this helpful and want more FREE forecasts in TradingView
. . . . . Please show your support back,
. . . . . . . . Hit the 👍 LIKE button,
. . . . . . . . . . Drop some feedback below in the comment!
❤️ Your Support is very much 🙏 appreciated! ❤️
💎 Want us to help you become a better Forex / Crypto trader ?
Now, It's your turn !
Be sure to leave a comment; let us know how you see this opportunity and forecast.
Trade well, ❤️
ForecastCity English Support Team ❤️

KSM dropI am expecting KSM to drop due the descending triangle pattern that has been formed during the last days.
Make sure to put a stop lose and see what is going to happen in the next days.

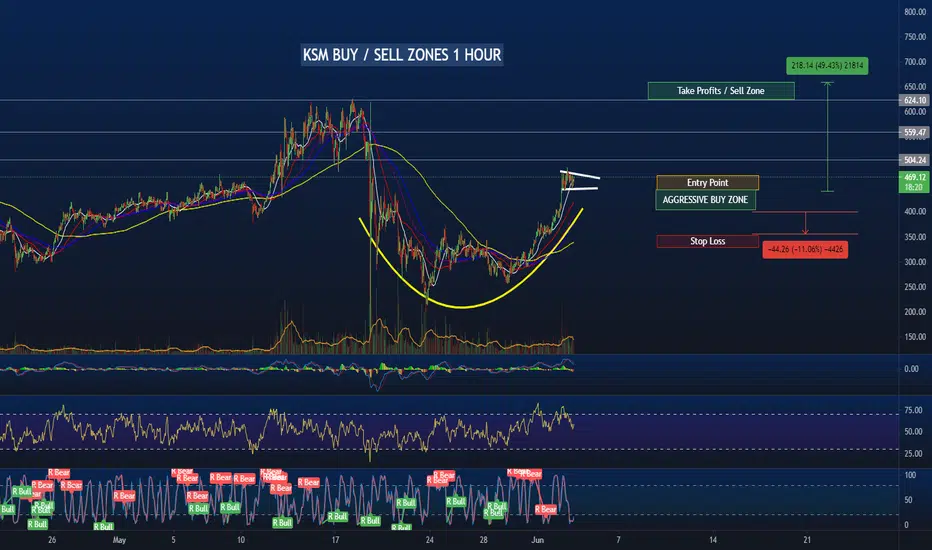
KSM BUY / SELL ZONES 1 HOURKSM BUY / SELL ZONES 1 HOUR check the end of the post for more calls etc.
$DOT in DIPGavin wood: Pump it
Hey there, hows your $Kyber?
sounds we are in DIP and its DOT time
targets 27.5 - 29 - 30 - 35 - 40
plus make sure you put a good stop loss

KSM shortKsm if facing overhead resistance at 618 Fibonacci level, a confirmed breakdown could lead us to approx $338

KSM longKsm is facing overhead resistance at 618 fibonacci level, a confimed breakout above 404.5 could lead us to $500.

KSM dropHello guys, I hope you are all right.
I am expecting a drop for KSM in the next few days that will pull it back to 360 or even 340 if the sellers are going crazy.
I would suggest you to do not buy any Altcoins right now due the small adjustment that is going to happen in the next few days.

KSM- Kusama TargetsI have never invested in Polkadot directly but Kusama has worked perfectly well for me twice before.
Time for number 3?
The fundamentals look GREAT and the chart agrees.
Kusama calls itself the canary network of Polkadot. So, what is a canary? It is a type of bird that coal miners used to check if it was safe to enter the coal mines. Kusama works quite similarly for Polkadot. As we know that Polkadot is becoming quite popular among blockchain developers, so Kusama is a perfect option for them to test their applications before launching them on Polkadot.

🆓Kusama (KSM) May-27 #KSM $KSMKSM has conquered the 320$ zone and is heading to 400$, 480$, and 560$ zone. But if it loses this 320$ zone again, it will have a big decline to 240$ or even 120$ zone in June
📈BUY
-Buy: 310-330$. SL if B
-Buy: 390-410$ if A. SL if B
📉SELL
-Sell: 390-410$. SL if A
-Sell: 470-490$. SL if A
-Sell: 550-570$. SL if A
♻️BACK-UP
-Sell: 310-330$ if B. SL if A
-Buy: 230-250$ if A. SL if B
-Sell: 230-250$ if B. SL if A
-Buy: 115-125$. SL if B
❓Details
🕯Timeframe : 1 Day
📈Red Arrow : Main Direction as BUY and SELL section
📉Blue Arrow : Back-Up Direction as BACK-UP section
🟩Green zone : Support zone as BUY section
🟥Red zone : Resistance zone as SELL section
🅰️A : The Close price of candlestick is Above the zone
🅱️B : The Close price of candlestick is Below the zone
