KSM


Which one outperforms? AVAX KSM SOL ATOMInteresting to see how similar these charts all are.. taking bets.. which will outperform in the short term? My bet is on SOL, just based off a hierarchy of the risk-curve, and it being a higher cap project, thus more visible, and considered a lower risk trade than the others.

KSM/USDT: Direct recovery expected---- Mid-term Analysis for the next coming 4 weeks to 3 months - Daily on Daily Chart (LOG)-------
KSM/USDT: Direct recovery expected
Context
- The Global Crypto market leads by BTC and ETH is still evolving within a bearish market configuration. Like the others digital assets KSM suffered about negative global market situation
- KSM is expected to bounce from the current bottom area and triggered the bullish divergence on RSI
Market configuration
- Graphical Elements :
Graphical Resistance = 171 & 420
Graphical Support = 36,5
- Mathematical Indicators:
EMA ( Exp Moving averages) are still capping the market = Bearish
RSI indicator (below) is on going divergence but still below 50% = Neutre
- Elliot & Harmonic Wave (Fibonacci):
Fibonacci Target V (C) B is set at = 36,5
Fibonacci resistance of the wave in progress = 171
Fibonacci Bullish Target = 281
Conclusion
Preferred case => Regarding the mid-term element, KSM is expecting to do a bullish reversal from the area we are now. We are bullish above 36,5 towards 281 with an intermediate level at 171. Maximum upside potential at 420

KSM - some possible paths it'll takeNot wanting for it to look messy but thinking about all the different paths KSM could take.
1. test of the lower support and up and breakout.
2. breakdown of lower support and then back inside the wedge for a nice bullish deviation.
3. a simple break out to the downside, retest and continuation down.
Watch this space.
Lower support could be good for a long, with tight stop loss.

KSM Beatiful trendline breakout + Bounce from supportReasons to take short
⭐️ Buyer on BTC
⭐️ We came to liquidity zone
⭐️ Volume increased
⭐️ Price is squeezing to the trendline
⭐️ 3rd touch of support
⭐️ 130 ATR
Will enter when price squeezes to the trendline on 5m timeframe, the base will form and the tape will get faster.
If you don't understand the previous sentence, just use swing stop-loss 3-5%
Fix profit by parts:
1% - 1/3
2% - 1/3, stoploss to breakeven
What's left, hold to the maximum
What do you think of this idea? What is your opinion? Share it in the comments📄🖌
If you like the idea, please give it a like. This is the best "Thank you!" for the author 😊
P.S. Always do your own analysis before a trade. Put a stop loss. Fix profit in parts. Withdraw profits in fiat and reward yourself and your loved ones

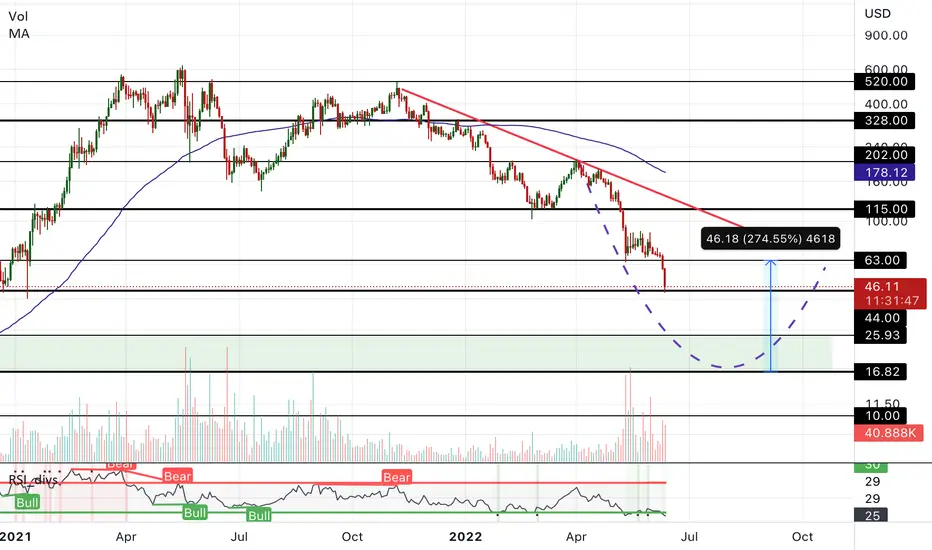
KSM/USDT - Potential Short ScenarioHello Traders!
KSM continues its downward movement. Currently, the price is testing the support level of $44.00.
Closing under $44.00 will trigger a further continuation of the downfall. The result of such movement will be the price exit to $16.82
Medium-term purchases can be considered at $16.82 - $25.93.
The targets for such purchases will be the price levels of $44.00 and $63.00
Good luck and watch out for the market
P.S. This is an educational analysis that shall not be considered financial advice
KSM Long HOLD - HopiumI bull case for Long term KSM.
Good support between $100-$120. Good area to accumulate and hodl.
If it breaks down, next best buy zone is $50-$70.
Bearish on short term.
Bullish on long term.


Kusama (KSM) formed bullish Gartley for upto 2157% massive rallyHi dear friends, hope you are well and welcome to the new trade seutp of Kusama ( KSM ) coin.
On a monthly time frame chart, KSM has formed a huge bullish Gartley pattern.
Note: Above idea is for educational purpose only. It is advised to diversify and strictly follow the stop loss, and don't get stuck with trade

#KSM/USDT 4HOUR UPDATE !Hello dear traders, we are new here so we ask you to support your ideas with your LIKE and COMMENT, feel free to ask any questions in the comments, and we will try to answer for all, thanks, Friends.
I have tried my best to get the best possible results in this chart.
Hello, dear traders welcome to this KSM/USDT 4Hour chart analysis.
KSM/USDT LONG TRADE SETUP
ENTRY:-$65,$67.5
TARGET:-40%
STOPLOSS:-$62.4
LEVERAGE:-10X TO. 20X
Remember:-This is not a piece of financial advice. All investment made by me is at my own risk and I am held responsible for my own profit and losses. So, do your own research before investing in this trade.
Happy trading.
Sorry for my English it is not my native language.
Do hit the like button if you like it and share your charts in the comments section.
Thank you.

KUSAMA 🎎🗾 - Our Next Hedge (short)KUSAMA chart further to your request and a chart we prefer to go short on at the moment.
Kusama has previously offered us great moments, first on the rise and later on the way down.
given that we are Long on BTC , Solana and others we do need a 'weak link' to short and this will now be Kusama.
40$ would be a level we could be tempted to Buy again.
After all, we got in at 11$, got out at 480$.. even went short at 209$ :
One Love,
the FXPROFESSOR

KSM LONGksm is suitable for long-distance prices at 84.80 and 82.40 and gives a profit of almost 60% in a short time. Those who intend to buy this currency can set their loss limit at 79.86
TP1: 124
TP2: 135
TP3: 152

KSM LONG SIGNALNice to meet you, everyone
I'm an alt trader
I am a South Korean soldier
I'm analyzing and recommending things that are similar to my personality among many alt coins

KSM / USDT I Technical AnalysisKusama has established a strong support zone. It looks like it's about to take off.
Entry point: 150
Take profit area 1: 186
Take profit area 2: 200
Stop loss: 140
NB: NOT A FINANCIAL ADVICE

$KSM/USDT 4h (#BinanceFutures) Falling broadening wedge breakoutKusama Network is pulling back towards 100EMA support where we expect it to bounce and resume bullish.
Current Price= 181.23
Buy Entry= 176.54 - 170.74
Take Profit= 187.49 | 199.64 | 215.28
Stop Loss= 162.06
Risk/Reward= 1:1.2 | 1:2.25 | 1:6.43
Expected Profit= +15.96% | +29.94% | +47.96%
Possible Loss= -13.34%
Fib. Retracement= 0.702 | 0.883 | 1.117
Margin Leverage= 2x
Estimated Gain-time= 2-3 weeks
Tags: #KSM #KSMUSDT #Kusama #Statemine #Substrate #Parachain #DotEco #Polkadot
Website: kusama.network
Contract:
#Mainnet

KSM/USDT Bullish ViewHello Traders
KSM/USDT is performing well in daily TF.
Price has jumped off of Support zone and trying to reach the next resistance zone forming an Inverse H&S pattern.
IF price breaks Resistance Zone(AKA neck line), this rally could lead price to 300$ zone.
Note: Bullish view got invalidate if price breaks below support zone(150 $).
Like, Follow, Share & Comment.
Thanks For Reading.
-RC

#KSM Inverse HSH#Kusama ready to make another +100%
In daily timeframe we seen a massive Inverse Head and Shoulder
Wait for confirmation price to close above the neckline
Send it to $410

KSMBUSDKSMBUSD
Is in accumulation
Buy from current prices and 179-137 zone
Target-price 1 - 213
Target-price 2 - 234
Target-price 3 - 259
Target-price 4 - 304
Stoploss - <115

KSMUSDT-1HTargets are on the chart, watch BTC and USDT.D closely, strictly obey the stop-loss point.

KSM resistance and trendline breakoutKusama broke the resistance trendline and retested it, and is now approaching the 4h resistance zone
If it closes the 1D candle above the 180 level, we can consider a nice LONG order with 200 as the target
my stop loss will be around 167 if this scenario is confirmed
let me know what you think about this ↓

KSM/USDTKSM is in good shape. If Bitcoin stays in this range and does not fall, this currency can probably experience good growth.

KSM very nice R:R hereI like this setup because PA looks strong and we could see a break up of the white MA on 12h tf which can be very explosive move to the other side of the cloud and even higher...
NOT FINANCIAL ADVICE
POSTING THIS ONLY FOR EDUCATIONAL PURPOSE
