KSMUSDT D – Start of Wave 3? After a clear 5-wave impulsive move up, KSMUSDT seems to have completed a deep ABC correction, potentially marking the end of Wave 2.
📉 Wave 1: We had a clean five-wave move from the bottom, which fits classic Elliott Wave structure.
📉 Wave 2: The correction that followed was much deeper than the ideal Fibonacci retracement zone. However, crucially, it never violated the low of Wave 1, which means it still holds valid under Elliott Wave rules. The correction unfolded as a textbook ABC pattern, with Wave C digging deep into the previous structure — showing panic selloff and possibly a final capitulation.
🔄 Key Development Now:
The resistance trendline of the correction has just been broken, suggesting potential momentum shift. This could mark the beginning of Wave 3, which is typically the strongest and most impulsive wave in Elliott Wave theory.
📈 Potential Target for Wave 3: Around the 39.5.80–42.00 area based on Fibonacci projections, but this is an early assumption and requires confirmation by price action and volume.
⚠️ Important Risk Note:
Despite this bullish technical setup, the current market remains risky. The bounce is fresh, and confirmation is still lacking. There's still the possibility of a deeper retest or invalidation of this count if price closes below the base of Wave 1.
🧠 Trade Plan:
- Wait for follow-through confirmation.
- Manage risk carefully — this is an early entry scenario.
- A stop below the recent low (~11.30) would be logical for this wave count.
📊 What do you think? Is this the beginning of a powerful Wave 3, or just another fakeout?
💬 Drop your thoughts or alternate wave counts in the comments!
KSMUSDT

KSMUSDT 1W AnalysisKSM ~ 1W Analysis
#KSM Buy back gradually from here if you still have confidence in this coin with a short term target of 20%+ from here.
KSM Scalp BUY PositionBeen on the Desk Today for Long.
Longing this here under 17.150 for a scalp toward 17.600 and 17.800.
stop loss 17.020.
Note: Not a Financial Advise.

KSMUSDT 1WKSM ~ 1W Analysis
#KSM Buy gradually from here with a short -term target of at least 20%+. This is the lowest support for now.

Univers Of Signals | KSM : Accumulation or Breakdown Ahead?In this analysis, I want to review KSM for you. This project is one of the platforms within the Polkadot ecosystem and currently ranks 157th on CoinMarketCap with a market cap of $289 million.
📅 Weekly Timeframe
On the weekly timeframe, we observe a consolidation zone ranging from $15.36 to $55.85. The price has been fluctuating within this range for over two years. By comparing the weekly chart with Bitcoin’s chart, we can see that the KSM/BTC pair is in a downtrend, making it currently not a good buy against Bitcoin.
🔍 However, if we analyze this chart independently, if the price bounces off the $15.36 support and starts moving upward, we can consider buying if it breaks out of the upper box limit. In that case, we can confirm that this two-year range was an accumulation zone, leading to a long-term bullish trend.
📊 The buying volume within this range has been higher than selling volume, which can be a positive sign for buyers and increases the chances of an upward breakout. However, the bullish legs have been relatively short-lived, while the bearish legs have followed more technical and structured movements.
🚀 If the price breaks out of the range to the upside, the technical targets would be $177.68 and $530.43. This means a significant amount of capital would need to enter this coin, which seems unlikely at the moment.
❌ On the other hand, if the price breaks below the range, there will be no significant support left, and we will need to see where the new historical bottom forms.
📅 Daily Timeframe
On the daily timeframe, as you can see, the price failed to reach the upper boundary of the range at $60.88 during its last bullish leg and got rejected at $51.21, initiating its downtrend. The price has since moved within a descending channel, approaching the bottom of the range.
✅ Yesterday's candle was heavily rejected from the mid-line of the channel, engulfing all recent candles from the past few days. This indicates strong selling pressure, which could initiate a much deeper downtrend.
📉 If the price breaks below the channel, the downtrend momentum will intensify, potentially leading to a parabolic bearish move for KSM. The key trigger level for confirming a parabolic downtrend is $16.08, and if this level is breached, we can expect a new bearish phase.
🧩 However, if the price breaks above the channel, the current breakout trigger is $22.37. A break above this level could be a buy signal for a long position.
📝 Final Thoughts
This analysis reflects our opinions and is not financial advice.
Share your thoughts in the comments, and don’t forget to share this analysis with your friends! ❤️

TradeCityPro | KSM: Accumulation or Breakdown Ahead?👋 Welcome to TradeCity Pro!
In this analysis, I want to review KSM for you. This project is one of the platforms within the Polkadot ecosystem and currently ranks 157th on CoinMarketCap with a market cap of $289 million.
📅 Weekly Timeframe
On the weekly timeframe, we observe a consolidation zone ranging from $15.36 to $55.85. The price has been fluctuating within this range for over two years. By comparing the weekly chart with Bitcoin’s chart, we can see that the KSM/BTC pair is in a downtrend, making it currently not a good buy against Bitcoin.
🔍 However, if we analyze this chart independently, if the price bounces off the $15.36 support and starts moving upward, we can consider buying if it breaks out of the upper box limit. In that case, we can confirm that this two-year range was an accumulation zone, leading to a long-term bullish trend.
📊 The buying volume within this range has been higher than selling volume, which can be a positive sign for buyers and increases the chances of an upward breakout. However, the bullish legs have been relatively short-lived, while the bearish legs have followed more technical and structured movements.
🚀 If the price breaks out of the range to the upside, the technical targets would be $177.68 and $530.43. This means a significant amount of capital would need to enter this coin, which seems unlikely at the moment.
❌ On the other hand, if the price breaks below the range, there will be no significant support left, and we will need to see where the new historical bottom forms.
📅 Daily Timeframe
On the daily timeframe, as you can see, the price failed to reach the upper boundary of the range at $60.88 during its last bullish leg and got rejected at $51.21, initiating its downtrend. The price has since moved within a descending channel, approaching the bottom of the range.
✅ Yesterday's candle was heavily rejected from the mid-line of the channel, engulfing all recent candles from the past few days. This indicates strong selling pressure, which could initiate a much deeper downtrend.
📉 If the price breaks below the channel, the downtrend momentum will intensify, potentially leading to a parabolic bearish move for KSM. The key trigger level for confirming a parabolic downtrend is $16.08, and if this level is breached, we can expect a new bearish phase.
🧩 However, if the price breaks above the channel, the current breakout trigger is $22.37. A break above this level could be a buy signal for a long position.
📝 Final Thoughts
This analysis reflects our opinions and is not financial advice.
Share your thoughts in the comments, and don’t forget to share this analysis with your friends! ❤️

KSMUSDT Setup: Will Bulls Step In, or Are We Heading Lower?Yello, Paradisers! Are you keeping an eye on KSM? This setup is shaping up for either a strong bullish recovery or a critical breakdown—and it all hinges on one key support zone. Let's break it down! 👇
💎KSMUSDT is currently showing a proper retracement within a descending channel, which typically signals a high probability of a bullish move ahead. But here’s the catch: the bulls need to reclaim momentum from a critical support zone before we see a confirmed reversal.
💎If KSMUSDT grabs liquidity below and forms a bullish I-CHoCH (Internal Change of Character) on the lower timeframes, it will greatly increase the likelihood of a strong bullish move.
💎However, if we see panic selling or a deeper retracement, we can expect a bounce from the stronger support zone below. At that point, look for bullish patterns like a W formation or an inverse head and shoulders on lower timeframes to confirm the move.
💎If KSMUSDT breaks down and closes a candle below the strong support zone, this will invalidate our bullish idea entirely. In that scenario, it’s best to stay patient and wait for a more favorable price action setup.
Stay disciplined, Paradisers! Remember, it’s all about waiting for the highest probability moves. Jumping in too early can cost you—so keep a close eye on how the price reacts around these key zones.
MyCryptoParadise
iFeel the success🌴

#KSM/USDT#KSM
The price is moving in a descending channel on the 1-hour frame and is adhering to it well and is heading to break it strongly upwards and retest it
We have a rebound from the lower limit of the descending channel, this support is at a price of 19.70
We have a downtrend on the RSI indicator that is about to break and retest, which supports the rise
We have a trend to stabilize above the moving average 100
Entry price 20.00
First target 20.58
Second target 20.95
Third target 21.50

#KSM/USDT#KSM
The price is moving in a descending channel on the 1-hour frame and is adhering to it well and is heading to break it strongly upwards and retest it
We have a bounce from the lower limit of the descending channel, this support is at a price of 18.00
We have a downtrend on the RSI indicator that is about to break and retest, which supports the rise
We have a trend to stabilize above the moving average 100
Entry price 19.59
First target 20.49
Second target 21.65
Third target 23.10

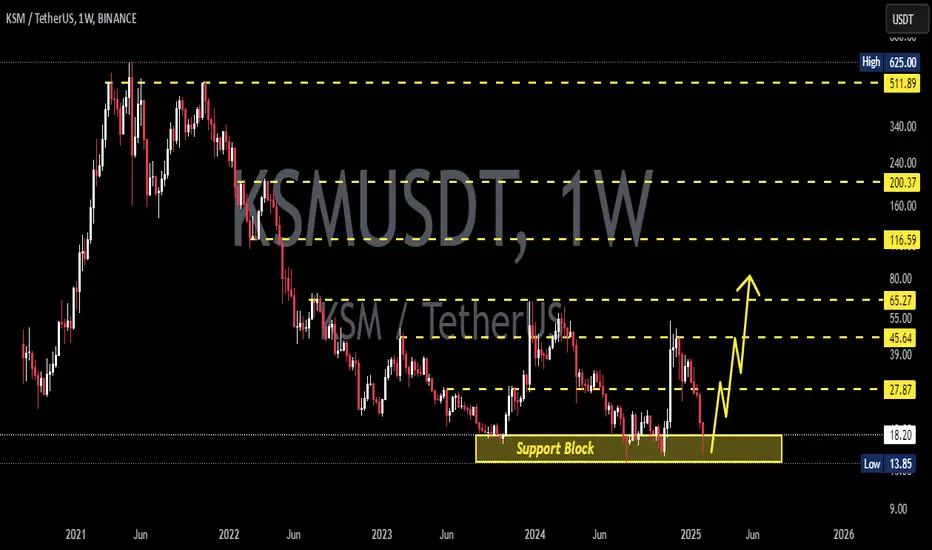
KSMUSDT 1WKSM ~ 1W Analysis
#KSM If you still have a Conviction on this coin,. This is the lowest support for now. Buy from here with a minimum target of 20%+
KSMUSDT 5DKSM ~ 5D Analysis
#KSM If you still have Conviction on this coin. This support isn't too bad to start buying back with a target of at least 20%+

KSM Buy/Long setup (8H)From the point where we placed the red arrow on the chart, it seems that KSM is forming an expanding triangle or a diametric pattern. Waves A through D have completed, and we are currently in wave E. Wave E is a bearish wave.
We have identified two entries for buy positions.
If the price reaches our entry levels, we will enter buy positions.
The targets are marked on the chart.
A daily candle closing below the invalidation level will invalidate this analysis.
For risk management, please don't forget stop loss and capital management
Comment if you have any questions
Thank You

Trading opportunity for KSMUSDTBased on technical factors there is a Sell position in :
📊 KSMUSDT
🔴 Sell Now
🪫Stop loss 37.61
🔋Target 31.90
📏 R/R 2,2
💸RISK : 1%
We hope it is profitable for you ❤️
Please support our activity with your likes👍 and comments📝

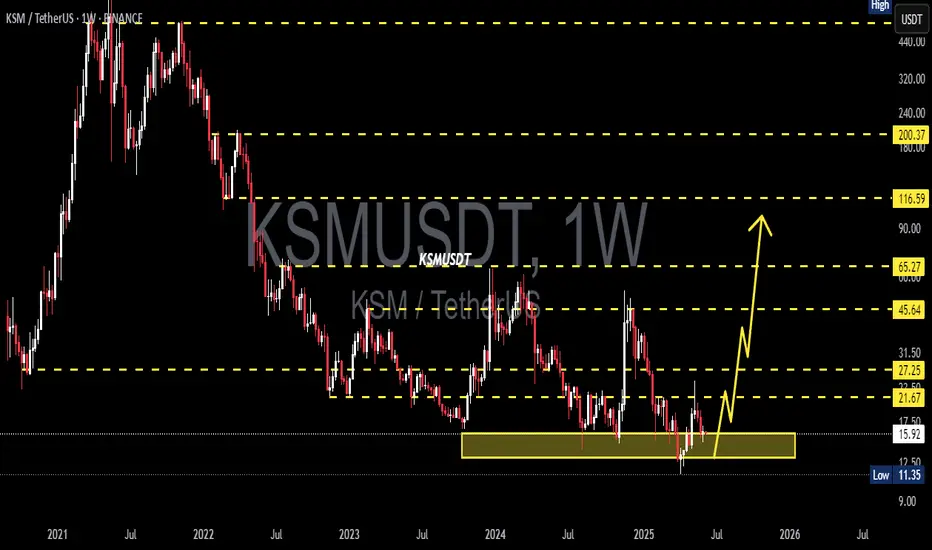
KSMUSDT 1WKSM Update ~ 1W
#KSM So far it continues to maintain its bullish structure. This is a very good support block for the next bull run. heading towards the wave 3. Buy in stages here with a minimum target of 20%++
TradeCityPro | KSM: Ascending with Key Breakouts👋Welcome to TradeCityPro!
In this analysis, I will review the KSM coin. This project is part of the Polkadot ecosystem and the analysis is conducted on a 4-hour timeframe.
⏳ 4-Hour Timeframe: Price Correction After Reaching Significant Resistance
In the 4-hour timeframe, after breaking the $22.17 level, the price executed a sharp and substantial uptrend, even managing to breach the resistance at $29.16 and reaching up to the $47.82 area.
🔍 After testing this area twice, the price entered a correction phase and dropped in two legs, first to $33.33 and then to $29.16. With a fake break of the $29.16 support, the bearish momentum in the market decreased, and currently, the price is forming a new structure.
📊 A very important note for the bullish trend is that during the entire correction phase, the volume of candles has been gradually decreasing, and it has now reached its lowest state. The approaching Christmas holidays have also undoubtedly influenced the decrease in volume, and the price may continue to range within this area until the end of the holidays.
🔽 If a third bearish leg occurs, the first trigger is $33.33, which we should wait to see how the price reacts to this area to define it more precisely and become a more reliable trigger. The next trigger is $29.16, which is a significant support. If the price stabilizes below this area, the next support will be at $22.17.
✨ A break below 40.20 in the RSI will aid the entry of bearish momentum, increasing the likelihood of breaking future supports.
📈 Conversely, given the reduced market volume, the bullish momentum in the market remains active. If the trend continues, breaking above 40.58 will be the first trigger. Entering a position upon this trigger helps ensure peace of mind in case of breaking the $47.82 resistance or failing to do so, as the risk of opening the position is accepted beforehand.
✅ The bullish target upon breaking $47.82 is the $59.68 resistance, which will be the initial target of the movement. If this target is reached, I will update the analysis and specify new targets for you.
📝 Final Thoughts
This analysis reflects our opinions and is not financial advice.
Share your thoughts in the comments, and don’t forget to share this analysis with your friends! ❤️

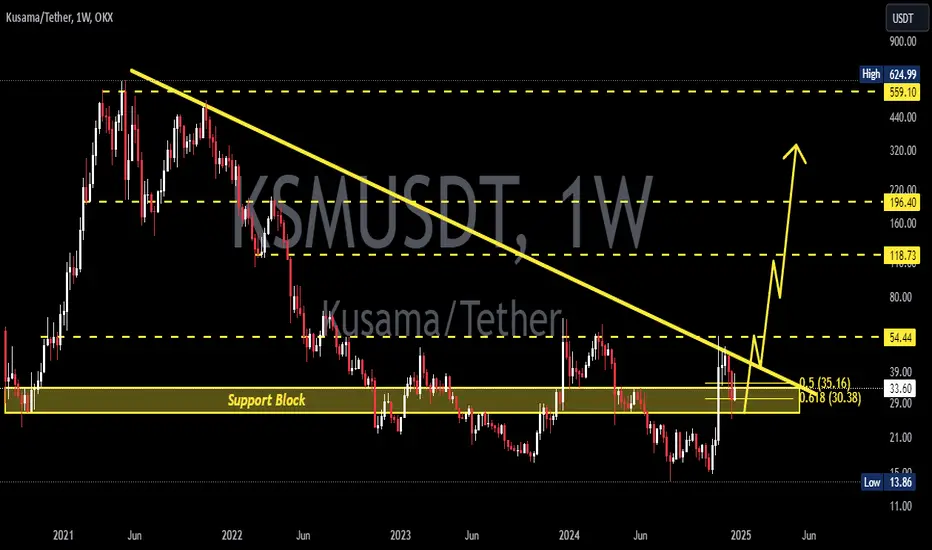
KSM/USD KSM/USDTThe idea was made a long time ago, and I forgot to post it, but we can see how it's being realized in the medium term

#KSM/USDT Ready to go higher#KSM
The price is moving in a descending channel on the 1-hour frame and sticking to it well
We have a bounce from the lower limit of the descending channel, this support is at 29.50
We have a downtrend on the RSI indicator that is about to be broken, which supports the rise
We have a trend to stabilize above the 100 moving average
Entry price 30.47
First target 31.76
Second target 34.00
Third target 36.26


Long trade idea for KSMUSDTLong trade idea for KSMUSDT
Falling Wedge measured from DEC 2023
Potentially min 912% profit from current date. Target $513
Do note potential pullback according to purple line.
Note that there are Bearish Order Blocks as shown.
Do exercise due diligence and that all trades comes with risks


Kusama will be something- Remember i am not an influencer but a trader.
- DYOR before.
- invest only what you can lose.
Happy Tr4Ding !

KSMUSDT (Kusama) Updated till 23-11-24KSMUSDT (Kusama) Daily timeframe range. bagged myself easy profits from breakout at 22.86. it would be nice to have a valid close over 46.75. volume is there if it stays we can see further push from here. if not 33.54 is next support to watch.

KSMUSDT: Broadening Wedge FormationKSMUSDT Technical analysis update
KSM price is forming a broadening wedge pattern on the weekly chart and has now price touched the broadening wedge support level. We can expect a bounce from the this level.
Target: 200%-400%
Stop Loss:$13.00
Regards
Hexa
