KSMUSDT 1W AnalysisKSM ~ 1W Analysis
#KSM Buy back gradually from here if you still have confidence in this coin with a short term target of 20%+ from here.
KSMUSDTPERP
KSM Scalp BUY PositionBeen on the Desk Today for Long.
Longing this here under 17.150 for a scalp toward 17.600 and 17.800.
stop loss 17.020.
Note: Not a Financial Advise.

KSMUSDT 1WKSM ~ 1W Analysis
#KSM Buy gradually from here with a short -term target of at least 20%+. This is the lowest support for now.

#KSM/USDT#KSM
The price is moving in a descending channel on the 1-hour frame and is adhering to it well and is heading to break it strongly upwards and retest it
We have a rebound from the lower limit of the descending channel, this support is at a price of 19.70
We have a downtrend on the RSI indicator that is about to break and retest, which supports the rise
We have a trend to stabilize above the moving average 100
Entry price 20.00
First target 20.58
Second target 20.95
Third target 21.50

#KSM/USDT#KSM
The price is moving in a descending channel on the 1-hour frame and is adhering to it well and is heading to break it strongly upwards and retest it
We have a bounce from the lower limit of the descending channel, this support is at a price of 18.00
We have a downtrend on the RSI indicator that is about to break and retest, which supports the rise
We have a trend to stabilize above the moving average 100
Entry price 19.59
First target 20.49
Second target 21.65
Third target 23.10

KSMUSDT 1WKSM ~ 1W Analysis
#KSM If you still have a Conviction on this coin,. This is the lowest support for now. Buy from here with a minimum target of 20%+
KSMUSDT 5DKSM ~ 5D Analysis
#KSM If you still have Conviction on this coin. This support isn't too bad to start buying back with a target of at least 20%+

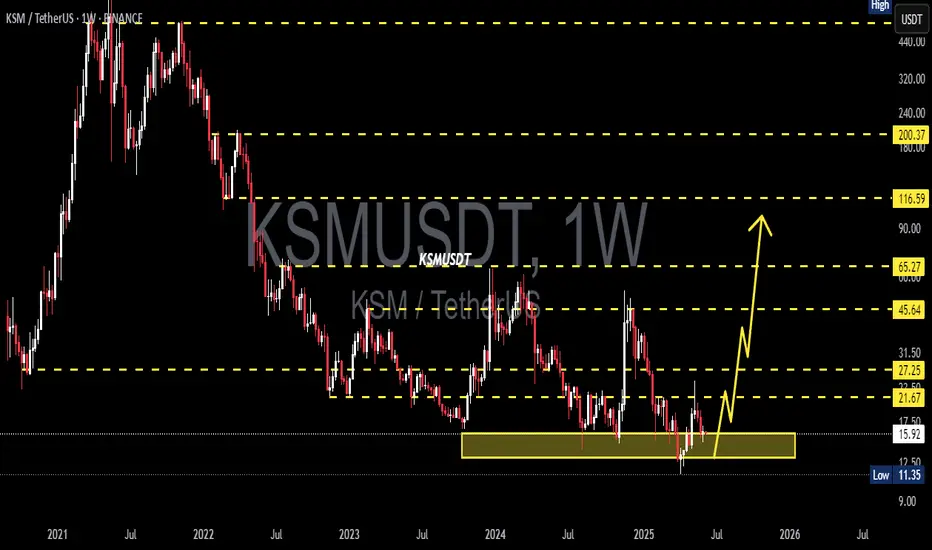
KSMUSDT 1WKSM Update ~ 1W
#KSM So far it continues to maintain its bullish structure. This is a very good support block for the next bull run. heading towards the wave 3. Buy in stages here with a minimum target of 20%++
#KSM/USDT Ready to go higher#KSM
The price is moving in a descending channel on the 1-hour frame and sticking to it well
We have a bounce from the lower limit of the descending channel, this support is at 29.50
We have a downtrend on the RSI indicator that is about to be broken, which supports the rise
We have a trend to stabilize above the 100 moving average
Entry price 30.47
First target 31.76
Second target 34.00
Third target 36.26


KSMUSDT: Broadening Wedge FormationKSMUSDT Technical analysis update
KSM price is forming a broadening wedge pattern on the weekly chart and has now price touched the broadening wedge support level. We can expect a bounce from the this level.
Target: 200%-400%
Stop Loss:$13.00
Regards
Hexa

KSMUSDTKSM ~ 1W
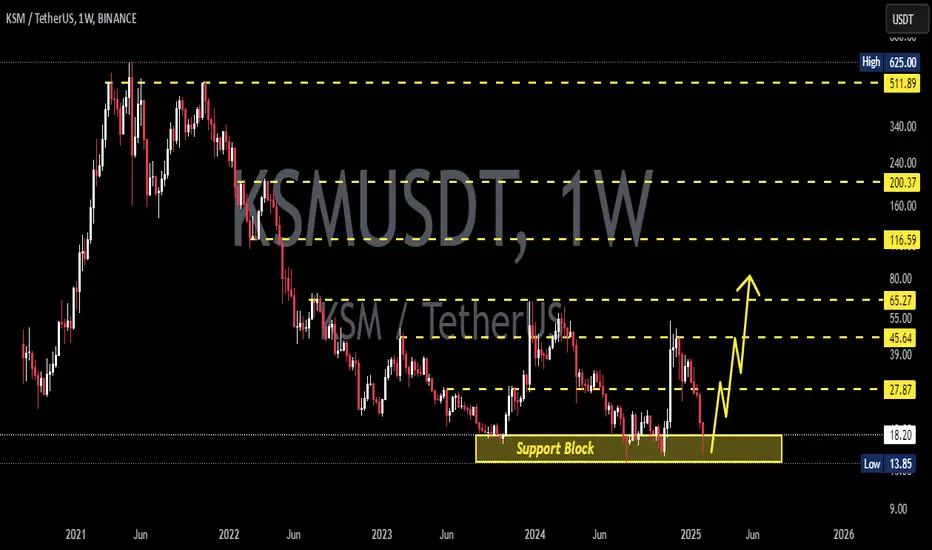
#KSM This is the lowest support Block on the 1W Time Frame.
If you still have Conviction on this coin,. You can make purchases from here. at least for a profit of at least 20%++
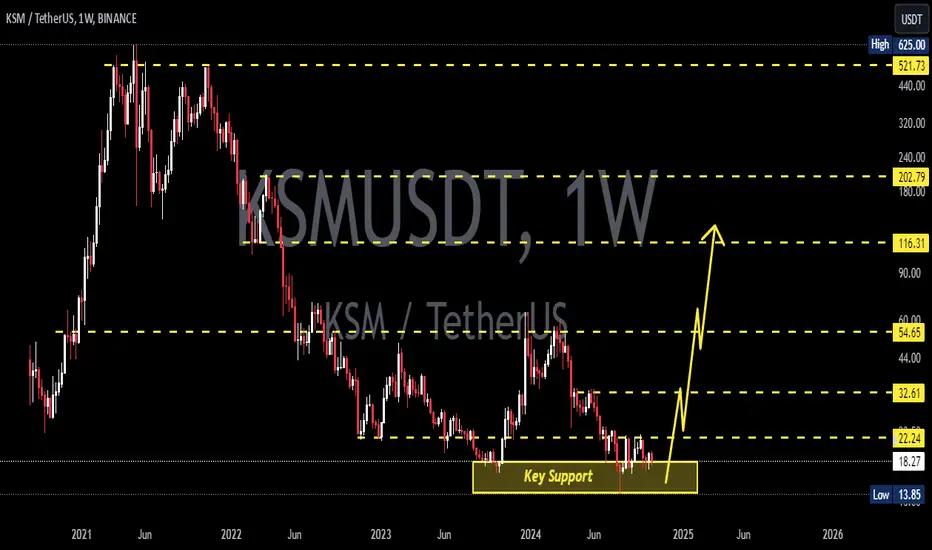
KSMUSDTKSM ~ 1W
#KSM This is the lowest support Block on the 1W Time Frame.
If you still have Conviction on this coin,. You can make purchases from here. at least for a profit of at least 20%++

KSMUSDT Reversing from the BottomKSMUSDT technical analysis update
KSM's price has broken the resistance line and formed a bullish head and shoulders pattern. It is now breaking the neckline resistance and has crossed above the 100 EMA on the daily chart. We can expect a strong bullish move in the coming days.
Regards
Hexa

#KSM/USDT#KSM
The price is moving in a descending channel on the 12-hour frame and is sticking to it very well and is expected to break it upwards
We have a bounce from a major support area in green at 16.00
We have a downtrend on the RSI indicator that was broken upwards which supports the rise
We have a trend to stabilize above the 100 moving average which supports the rise
Entry price 18.00
First target 20.88
Second target 22.72
Third target 24.83

KSMUSDT Bouncing from Major SupportKSMUSDT Technical analysis update
KSM price has been ranging for the last 600 days, repeatedly touching and bouncing off its major support zone. Recently, the price has touched the support zone again and is now slowly bouncing from it. We can expect a bullish move from the current level.
Stop Loss : $18.00
Target: 100%-200%

#KSM/USDT#KSM
The price is moving within a descending channel pattern on the 4-hour frame, which is a retracement pattern
We have a bounce from a major support area in the color EUR at 23.00
We have a tendency to stabilize above the Moving Average 100
We have a downtrend on the RSI indicator that supports the rise and gives greater momentum and the price is based on it
Entry price is 22.00
First target 26.30
The second goal is 30.00
The third goal is 33.70

#KSM/USDT#KSM
We have a bearish channel pattern on a 4-hour frame, the price moves within it, adheres to its limits well, and is expected to break it upwards in a strong manner.
We have a green support area at 26.00
We have a tendency to stabilize above moving average 100
We have a downtrend on the RSI indicator that supports the price higher
Entry price is 28.30
The first goal is 30.31
The second goal is 33.14
the third goal is 36.00

Kusama (KSM) completed a setup for the next pumpHi dear friends, hope you are well and welcome to the new trade setup of Kusama (KSM) coin with US Dollar pair.
Our last successful trade of KSM was the below one and it was almost 20% pump:
Now on 2-hr time frame, KSM has formed a bullish Gartley move for the next price reversal.
Note: Above idea is for educational purpose only. It is advised to diversify and strictly follow the stop loss, and don't get stuck with trade.

#KSM/USDT#KSM
The price is moving in a bearish channel on a 4-hour frame.
The price is moving within it and adhering to it to a large extent. We have a support area in green, from which it rebounded at the $40 level.
We have a higher stability moving average of 100
We have a downtrend on the RSI indicator that supports the rise and is about to break higher
Entry price is 47.38
The first goal is 47.00
The second goal is 52.00.
The third goal is 58.00

KSM Waiting the buy zoneKusama is in a strong bear trend, and it's breaking support over support. I identified a strong accumulation zone on higher timeframe at 29-32 USD. I expect the price to slowly come there, and after some accumulation it should bounce. I'll wait the price there before open any trades

KSMUSDT Resistance Zone Breakout!KSMUSDT Technical analysis update
Buy zone : Below $19.90
Stop loss : $19.30
Take Profit 1 : $20.50
Take Profit 2 : $21.70
Take Profit 3 : $23.70
Take Profit 4 : $26.00
Always Keep Stop loss
Thanks
Hexa
