MATIC3S - possible bounce from supportMATIC 3 X SHORT on Kucoin
Now trying to bounce from long-term support, this zone was holding like a rock the last few times. SRSI is oversold and looks like heading up.I would prefer RSI at the 40ish level, but we can do it like this. That 50 level for RSI could be resistance, so be careful around that level.
There is a possible 25 to 30% move in this one, even if just bounces down from the yellow resistance zone...
Use Stop Loss, be responsible...
Good luck traders
Kucoin

OSC issues sanctions against Bybit and KuCoinCanadian regulatory body, Ontario Securities Commission (OSC), has announced financial sanctions against two crypto exchanges. According to the details of the statement, the regulator leveled these sanctions against Bybit and KuCoin. In its statement, the regulatory body mentioned that both entities were guilty of running an unregistered crypto entity while providing services to residents of the country and violating some of the securities laws.
The exchanges were slammed with financial charges
In the announcement made available some hours ago, OSC mentioned that it had explicitly prayed a court to grant an order to remove KuCoin from the capital market. In addition to that sanction, the regulator also said it had fined the crypto exchange over $1.5 million for misdeeds. In the same vein, the regulator also mentioned that it was able to come to a gentleman’s agreement with Bybit, but the exchange also released more than $2 million in disgorgement.
In addition, the exchange was also levied with a payment of more than $7000 for all the efforts and financial resources that OSC used during the investigations. Although both firms were said to have gone against the rule of the securities commission, the body mentioned that Bybit was the only one out of the two that wanted to correct its error. During the investigation, it opened a direct line to talk to the body and discussed how it could go about the registration process.

AUDIO 90% Target MappedWe have a full bearish wave that is now being followed by a bullish one.
AUDIOBTC is forming kind of a like a cup pattern as we showed on TOMOBTC.
We use the indicators and signals to support our bias but the market moves in waves...
After a wave down a wave up follows...
The cycle repeats, it is very easy...
We just have to watch and wait.
Once we see charts like the one I am sharing above...
We buy and we wait.
Namaste.

BTC's Redemption and Accumulation PointOn the Daily Time Frame, We see a Lollipop Bullish Engulfing candle occur on the 18th and 19th of June on the 17k-19k support region and Also we see the just concluded daily candle ending up as a Doji.
My MACD oscillator line is currently crossed above my Signal EMA on the Market Strength Indicator. With this current inflow of strength to BTC, we will likely see BTC rise up to the 22k-23k region and after that, we've got another Higher-low Coming which would likely push BTC below the 17k region and if that happens, we've got our next critical support between the 12k-14k region.
The Best thing to do at this Point is to Engage DCA. Time in the market at this point is safer and more profitable to timing the Market.

KCSUSDT Establishing a SupportThe KuCoin token (KCSUSDT) reached on Saturday the Support formed from the previous Low on May 12. That Low kickstarted a huge +90% rally that broke above the 1D MA50 (blue trend-line) and almost reached the 1D MA100 (green trend-line). The 1D RSI is on Higher Lows and last time we had the same set of technical parameters was on June 22 2021, exactly 1 year ago.
It is fair to say that the price didn't hit the Support back then, but came very close to. Still, that initiated a strong rally towards almost the previous High. Right now we have an Internal Lower Highs trend-line to consider, as well as the 1D MA50 as a short-term Resistance. So as long as the Support closes candles above it, target the 1D MA50. If it breaks, we should see a test of the 1W MA200 (red trend-line).
--------------------------------------------------------------------------------------------------------
Please like, subscribe and share your ideas and charts with the community!
--------------------------------------------------------------------------------------------------------

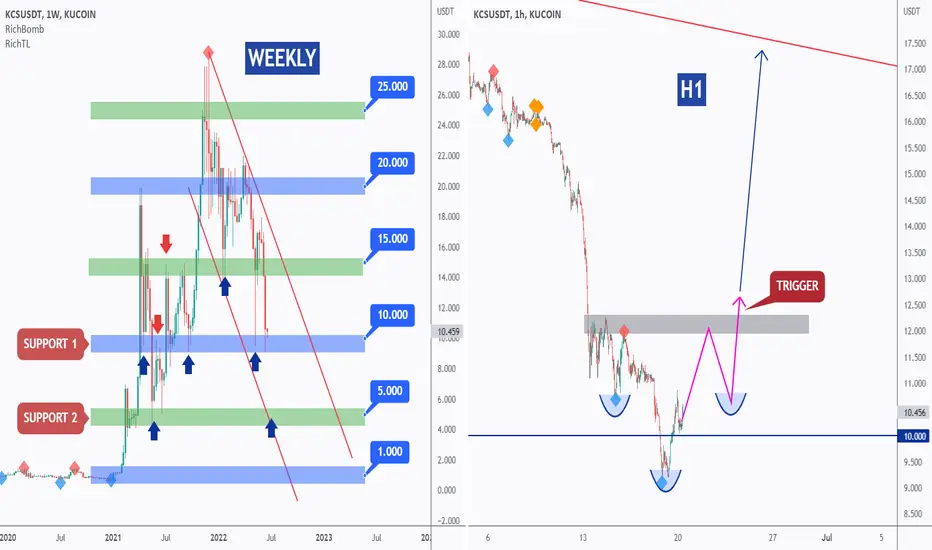
KCS - Potential Bullish Reversal!Hello TradingView Family / Fellow Traders. This is Richard, as known as theSignalyst.
WEEKLY: Left Chart
KCS is approaching a strong support zone and round number 10.0 so we will be looking for buy setups on lower timeframes.
H1: Right Chart
KCS is forming an inverse head and shoulders pattern, but it is still an idea.
Trigger => Waiting for the right shoulder to form then buy after a momentum candle close above the gray neckline.
Meanwhile, until the buy is activated, KCS can still trade lower and break the 10.0 support. In this case a movement till the 5.0 support would be expected.
Always follow your trading plan regarding entry, risk management, and trade management.
Good luck!
All Strategies Are Good; If Managed Properly!
~Rich

KCS/BTC - Surprisingly, KuCoin is flat vs BTC! 💪KuCoin's price has been surprisingly flat versus Bitcoin during this massive crash. More so, overall it outperformed Bitcoin during the bear market, this is quite surprising and a sign of strength.
Right now, the price is found in a flat trend vs Bitcoin without any significant change.
Price is stuck between the 5k satoshi support and 5.8k resistance.
A break from this range is needed for KCS to pick a direction. But a flat trend in a bear market is more than enough to keep holders satisfied.
The situation vs USD is slightly different, see below.
As such, keep a close eye on KCS's price vs USD. If it falls under $10, things may get spicy.
Bias on this chart is neutral.
Like and follow if you like my idea!

KCS/USD - KuCoin returns to $10. At Critical Support! 😱KCS had a nice rally in late May, but this quickly reversed in June with the price now back on the key support at $10.
The whole market crashed and ETH fell under its old all-time high. If Bitcoin crashes under $20k, then most altcoins will likely make lower lows.
What does this mean for KCS?
Probably a price under $10.
Bulls have to do their best to keep the price above this key level as otherwise the next support is found at $9 which would put KCS into single digits.
The indicators on higher timeframes remain bearish, while the shorter timeframes like 4-hours are bullish. This suggests a short relief will be followed by more pain.
A break below the support at $10 will settle any doubts. Bias is bearish for now.
Like and follow if you like my idea!

KCS - Strong Zones!Hello TradingView Family / Fellow Traders. This is Richard, as known as theSignalyst.
KCS is approaching a a strong support zone and round number 10.0 so we will be looking for buy setups on lower timeframes.
As per my trading style:
As KCS approaches the 10.0 zone, I will be looking for reversal setups (like a double bottom pattern, trendline break, and so on...)
Unless the 10.0 support is broken, then a movement till the 5.0 support where we will be looking for buy setups.
Always follow your trading plan regarding entry, risk management, and trade management.
Good luck!
All Strategies Are Good; If Managed Properly!
~Rich

KCSUSDT near the 2 year Support trend-lineThe KuCoin token (KCSUSDT) has followed the overall crypto market to the downside this past week, with the 1D RSI marginally breaking below the oversold 30.00 level. However, there is no cause for concern that the long-term bullish trend is reversing, as the Higher Lows trend-line that has been supporting the price since the February 28 2021 Low and held on another five Higher Lows, hasn't yet been reached.
In fact, the price, on RSI and candle terms, seems to be following the bottom sequence of May 19 - 2021 - June 22 2021. Technically, the next time the 1D MA50 (blue trend-line) breaks, we should return to the bullish trend within this Fibonacci Channel.
--------------------------------------------------------------------------------------------------------
** Please support this idea with your likes and comments, it is the best way to keep it relevant and support me. **
--------------------------------------------------------------------------------------------------------

KCSUSDT 1D Long-term investment #1At the beginning of the year, we have published a serial of ideas introduced an investment trade into token Kucoin KCS, with a weekly updating of our opinions about the KCSUSDT price movement, and how we manage the position
The result is the break-even stop for +2.5% that we received when the whole cryptomarket began to fall.
More detail what we have chosen this token for medium(long)-term investment and the last update of the idea below:
Further, we only do shot short trades, because the market went into the stage of correctional fall.
And the other day, we have released a global idea on BTCUSDT, which noted that in our opinion, the price is now in a critical zone from where a not bad grew could be organized. More in more detail in the idea below:
Therefore, we will try to restore the investment section in the KCS, and every week we will update the information how we manage the position.
Considering that we expect growth in BTCUSD pair is a big chance that the rest of the cryptocurrencies will be tightened up by the main trade couple.
The price of KCSUSDT has bounced very well after May fall and now, after a weak correction (which may indicate the power of buyers) tries to fix above the mirror level of $15.00
Therefore, given the above facts, we offer the following input data for a long -term position:
Entrance in the range of $15.25-15.75
Stop below $10.99
Take Profit in the area of $41.50
Profit/loss ratio 6/1
We expect that the summer can give a not bad wave of growth, of course, if there are no force Major.
So, if you are interested in this section: Put a like, write a comment and subscribe to us , and we will update the information every week how we manage this position and what we see new ones on the KCSUSDT chart.

BLOKTOPIA will rise short-termpay attention , BLOK will rise short term. I dont believe it will drop any further, but trade at your own risk. NFA

KCS | Bullish wedge patternKCS (KuCoin Token) bullish wedge pattern
We can see from the chart that it's forming an bullish wedge pattern
Buy on breakout
Targets:
18.38
19.88
21.20

KCSUSDT broke below its Channel. Levels to consider.The KuCoin token (KCSUSDT) broke today below the Channel Up pattern it has been trading in since the 2nd half of May. The obvious Support to look for now is the 4H MA200 (orange trend-line), with the next ones (14.930, 14.130 and 13.520), being the Higher Lows during the uptrend after the May 12 low. Every one of those Support levels can provide a rebound, so buying there with the SL just below them, constitutes a sound trade from a Risk/ Reward ratio perspective.
On the other hand a daily closing below 13.520, technically restores the long-term bearish trend. If you are looking for a confirmed buy, perhaps it would be best to wait for the 4H RSI to break above its upper Bollinger.
--------------------------------------------------------------------------------------------------------
** Please support this idea with your likes and comments, it is the best way to keep it relevant and support me. **
--------------------------------------------------------------------------------------------------------

$eRSDL - William's_R_ovrsld_long_1hr - Price seems to have cooled enough from the weekend pump to start adding more. NA markets open for the week in an hour. FA remains strong. William's %R is oversold. Potential bounce here if volume picks up. Set alerts, DCA.
Call/limit order filled: 0.01245
tp_01: 0.01562
tp_02: 0.01870
stop: 0.01091
Never margin trade. Go well
(-(-(-(-_-)-)-)-)

KCS - Video Top-Down Analysis!Hello TradingView Family / Fellow Traders. This is Richard, as known as theSignalyst.
Here is a detailed update top-down analysis for KCS.
Which scenario do you think is more likely to happen? and Why?
Always follow your trading plan regarding entry, risk management, and trade management.
Good Luck!.
All Strategies Are Good; If Managed Properly!
~Rich

KCS/BTC - Resistance hit, time for some cooldown. 🤔KCS on the Bitcoin pair has hit the key resistance at 5.8k satoshi.
Now, the price is reversing and if we are to look at the USD pair (see idea below) it seems the bullish momentum may have to take a pause.
For this reason, a retest of the 5k satoshi support line may be in order before KCS can hope to break the key resistance here.
The indicators on the daily timeframe are also curving back down and may signal a local top.
Bias is short on this price action, best to be on guard here and keep a close eye on the support.
Like and follow if you like my idea!

KCS/USD - Momentum Stalling, Here's the Critical Support 😲 KuCoin token had a good rally, actually, a great one considering other coins barely bounce (hint hint at Bitcoin).
KCS almost doubled in price compared to its local bottom here, so not bad at all.
However, the momentum seems to be shifting against KCS and its price may roll over and fall lower to the key support at $14.
If the selloff will not be too aggressive I can totally see KCS hold well there before attempting to recovery again and rally.
For now, the daily MACD is curving down and may turn bearish, so it will take some time for this to play out. Volume is also terribly low.
Bias is turning bearish on this price action, but wait for Monday to get more confidence in the price action.
Like and follow if you liked this analysis!

KuCoin - CollapseI am hoping this coin can respect this area of daily supply to give a beautiful drop in price to the remaining fair value gap areas.
I will be looking for entry points on the lower time frames.

KuCoin uptrend can be expected to continue.After the break above the trendline, we might be seeing a continuation of the uptrend. Potentially, the price should be aimed at the top of the ascending channel.

KCS - Trend-Following Setup!Hello TradingView Family / Fellow Traders. This is Richard, as known as theSignalyst.
KCS rejected our green support and traded higher, so we are currently trading inside this orange channel.
As per my trading plan, I will be looking for trend-following buy setups on lower timeframes if price retests the lower orange trendline acting as a non-horizontal support.
and we will be expecting the bears to take over for a correction after retesting the upper orange/red trendlines.
Which scenario do you think is more likely to happen? Which floor is more likely to hold?
Always follow your trading plan regarding entry, risk management, and trade management.
Good luck!
All Strategies Are Good; If Managed Properly!
~Rich

KCSUSDT testing the 1D MA100, close to a major break-outThe KuCoin token (KCSUSDT) has broken since our last analysis above the 1D MA50 (blue trend-line) for the first time since April 26 2022. On top of that, the 1W MA50 (red trend-line) is now supporting. At the moment it is going for a re-test of the 1D MA100 (green trend-line) where it failed yesterday.
Perhaps the most important barrier, above which the long-term trend switches back to bullish, is the 1D MA200 (orange trend-line), which right now happens to be exactly on the Lower Highs trend-line that started after the December 01 2021 market Top.
Naturally if we get a weekly candle close above the 1D MA200, we should expect a medium-term rally towards the 28.845 Resistance (Dec 01 2021 High). If not, the Lower Highs can very well reject the price back towards the 14.500 level.
Even though the current Channel Up resembles the one that also tested the 1D MA100 back in early February, this time the price has broken above the critical 0.618 Fibonacci retracement level, making a full gap fill more probable. Also keep an eye on the 1W RSI. If it crosses above its MA (yellow line) then that also favors the bullish case on the long-term.
Overall we believe that KCSUSDT is an excellent investment on the long-term with a 10x profit potential in this Cycle.
--------------------------------------------------------------------------------------------------------
Please like, subscribe and share your ideas and charts with the community!
--------------------------------------------------------------------------------------------------------
