KuCoin Token Analysis (KCS) in Daily Timeframe:Hello friends. According to the chart below, we see that the price is falling strongly after breaking the orange trend line (the lowest line) and pulling it back. The first support of this currency, which is considered very strong support and in a way, the most important support of this currency, is the green range ($15 range) that will most likely reach this area today or tomorrow.
If the selling pressure is high, the next support areas are the white uptrend line and then the lower green line (range $13.5) where the price went down in the previous downtrend and then demanded.
If the price supports the $15 range and moves up, the first resistance is the lower red area ($17.8 range) and then probably the orange trend line (as a pullback) and then the main resistance area which is the same red area is high ($21 range), it can prevent price increases.
(Orange lines are trend lines in the past chart and have been drawn for further training.)
(Important Note: All analyzes are for personal analysis only and are not financial advice at all.)
Be successful and profitable. 🌷
Kucoin

Why 23000 is magnetPrz levels can Pull the price towards itself...
1. Fib 38.2 of a long main wave
2. Two harmonic famous pattern
3.the middle of full body candel
4.Weak monthly level and shrinking bubble
And more reason for it that I can not
Paint all in chart
Careful it's just my opinion and maybe false.
(Monthly chart btc)

APE/USDT 4H very HOT !!APE coin was very hot this month and we are in great rectangle, there is 2 main price.levels and 2 main levels and we have great -RD in our (MACD) histograms, that mean there is more possibility to going down than going up.
take care of your trade

BTC/USDT 4H to lower levelswe lost the main level and we expect lower prices as you in the chart.
what do you think?1

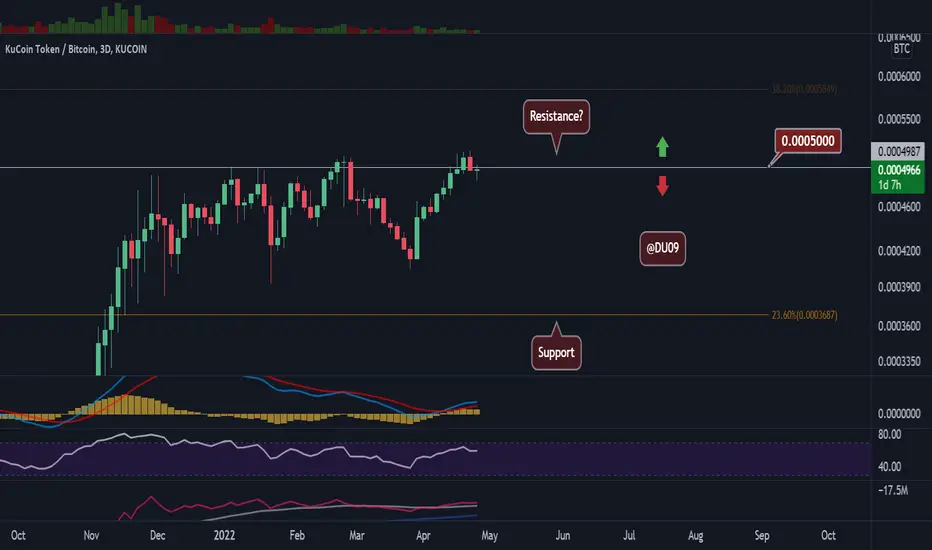
KCS/BTC - KuCoin holding well against Bitcoin!On the KCS/BTC chart, KuCoin is holding pretty well. For the USD pair see below my idea.
This is good since KCS is not underperforming BTC.
This range just under 5k statoshi is looking interesting as price made a higher high.
Can KCS outperform BTC? Unlikely, but not impossible.
The indicators are flat and this consolidation may continue for a while, but I'd not be surprised to see KCS breaking above 5k satoshi soon.
Bias is neutral on this chart.
Like and follow if you liked my idea!

KCS/USD - Price at CRITICAL support! 🚨KCS's price is found right on the $17 support level. If broken, then price will likely quickly take a nosedive.
Volume is low and the indicators are all bearish. If the market sentiment does not change soon (which appears unlikely), then KCS's consolidation between $21 and $17 will end with a breakdown.
The next key level of support is found at $15 should that be the case.
With both the stock market and BTC taking a beating it is very hard to be bullish. Therefore, my bias is bearish at this time and prepare for the worse while hoping for the best.
Ideally KCS will be able to have a nice bounce after reaching $15.
Time will tell. Until then, stay safe!
Like and follow if you liked my idea.

KCS - Video Top-Down Analysis!Hello TradingView Family / Fellow Traders. This is Richard, as known as theSignalyst.
Here is a detailed update top-down analysis for KCS.
Which scenario do you think is more likely to happen? and Why?
Always follow your trading plan regarding entry, risk management, and trade management.
Good Luck!.
All Strategies Are Good; If Managed Properly!
~Rich

HAIL HYDRA -LONGHYDRA looks Boring honestly…but EXTREMELY Lucrative. It should continue some sideways action before starting its next cycle. Would be a dream to see a cup pattern emerge but thats just wishful thinking andhas not been verified “YET”
MACD Is entering limbo and should start its green stage again.
Ichimoku Cloud & SARS point to a directional change.
This is my 2 year forcast. It will be a slow crawl but reinvesting your hydra and locking it up can minimize your risk.
Not financial Advice and I am a new chartaholic.
Good luck All.

KCSUSDT A complete 2 month projectionThe KuCoin token (KCSUSDT) is on a 2 day green candle streak, posting a rebound on the Higher Lows trend-line (bottom) of the Channel Up that started after the February 10 High. There are various patterns involved that can help us make projections up to the next 2 months.
First of all, as long as the Higher Lows trend-line of the Channel Up holds, the price is more likely to rise and meet the first barrier of the internal Lower Highs trend-line (dotted line). A 1D candle closing above, should extend the rally to the 22.000 Resistance.
A break below the Higher Lows trend-line of the Channel Up though, should cause an immediate test of the 16.000 Support, where the critical, long-term Support trend-line of the 1W MA50 (red trend-line) awaits. A 1W (weekly) candle close above the 1W MA50, should technically initiate a rebound, which this time will be limited though to the 1D MA50 (blue trend-line). In that scenario, a 1D candle break above the Lower Highs trend-line, should again cause further rise to the 22.000 Resistance.
A 1W candle close below the 1W MA50 along with a break below the dashed line, will most likely cause a test of the 13.400 Support of the January 22 low, which will be alarming as it may cause a longer-term bear phase of 3-4 months.
We have to point out that so far, the 1D RSI favors the scenario of an immediate bounce, as it is on a Lower Highs pattern which for more than 5 months, has delivered a short-term at least rise.
--------------------------------------------------------------------------------------------------------
** Please support this idea with your likes and comments, it is the best way to keep it relevant and support me. **
--------------------------------------------------------------------------------------------------------


KUCOIN (APE): End Of A Bearish TendencyIt seems that the bearish momentum Apecoin is having is losing its momentum, and at any time will reverse. The falling wedge pattern and the divergence also help determine a tendency reversal. KUCOIN:APEUSDT

APE Restest $22?Yesterday I mentioned that APE will head to the downside from $26 -25 which I am right, mentioned below. Anyone who took the short, congratulations. This morning I was uncertain if it was going to break out of the symmetrical triangle but it did to the downside...woohoo! As you can see on the 1hr timeframe, there is a fair vlue gap at $21-22, my assumption is that it will hit 22 which is my trendline and go back down again since the daily and 4hr time frame trend exhaustion is still pretty high

XTZ | Tezos Clear Bearish TendenciesXTZ has been correcting from its ATH since October 2021. It is like a textbook correction with typical bear market rallies. Tezos is now trading around its main historical support trendline. If XTZ breaks below that, I think we will head towards $2-2.2.
However, given the current level and historical upside impetus from the main support trendline that you can see on the weekly timeframe, another rally is also on the horizon. A break out of the falling wedge would be a first bullish sign. The daily chart would turn bullish once XTZ can again scale above any of the higher dashed white trend lines that acted as resistance in the past.
Considering the volume profile, I tend to lean towards the bearish side on the macro picture.
Let's see how that plays out.
Thank you for your support.

KCS - Are You Ready?Hello TradingView Family / Fellow Traders. This is Richard, as known as theSignalyst.
KCS is overall bullish trading inside our brown trendlines and now approaching the lower bound / trendline.
Moreover, the area in red is a strong support zone.
Before we buy, as usual, we need the bulls to prove to us that they are strong enough to take over.
As per my trading style:
I will be waiting for a third swing high to form around the upper red trendline to consider it valid then buy on its break upward. Then I will be adding more longs after a break above the upper green zone.
Meanwhile, until the buy is activated, KCS can still dive inside the red zone before trading higher.
Always follow your trading plan regarding entry, risk management, and trade management.
Good luck!
All Strategies Are Good; If Managed Properly!
~Rich

#LOOKS/USDT 1HOUR UPDATE BY CRYPTOSANDERS Hello, welcome to this LOOKS /USDT 4hr chart update by CRYPTOSANDERS.
I have tried my best to bring the best possible outcome to this chart.
Show some support do hit the like button, follow and comment in the comment section. this motivates me to bring this kind of chart analysis on regular basis.
CHART ANALYSIS :
#LOOKS/USDT
As we can see in the above-mentioned chart that LOOKS just triangle pattern and currently moving down to retest so at the green zone or the upper trend line we can take a long position for almost 120% in the upcoming days.
Entry:- CMP and $1.39
Traget:- 120%
Stoploss:- $1.30
Remember:-This is not a piece of financial advice. All investment made by me is at my own risk and I am held responsible for my own profit and losses. So, do your own research before investing in this trade.
Happy trading.
Sorry for my English it is not my native language.
Do hit the like button if you like it and share your charts in the comments section.
Thank you...

APE - SHORTThe last candle on the daily chart was impulsive. Based on all my indicators at the bottom, fair value gap, and volume we're heading to the downside. TP @ $15- $11. RSI for daily time frame surpassed 70 and it is overexhausted.

PRE/BTC approaching demand zone Looking to long here as it approaches this demand zone. Mainnet launch less than a month away.

KCSUSDT pricing a bottom. Check those Support & break-out levelsThe KuCoin token (KCSUSDT) has been under pressure since the April 20 High but since yesterday we see the first signs of a potential bottom.
** Technical Analysis **
As this 4H chart shows, the token is trading on Lower Highs since the March 29 High that formed the 22.000 Resistance level. A 4H Death Cross (MA50 (blue trend-line) crossing below the MA200 (orange trend-line)) will be formed today, which is a bearish pattern but the last time we saw this (March 07), it was formed on a bottom. In fact it priced the bottom and the token turned sideways into a High Volatility Zone until the late March break-out to the 22.000 Higher High.
With the 4H RSI also forming a bottom sequence, it is possible to have the same pattern again. Notice also that the Ichimoku Cloud has already turned red, which previously has been a solid sign for a buy.
Our strategy is to buy towards the Lower Highs trend-line and then engage on the longer term only when the 22.000 Resistance breaks.
** Fundamental Analysis **
KuCoin manages to keep the bar high in the fundamentals section and this week the talk of twitter is the Spotlight Trial Fund. I won't be getting into more detail on this one but you can find more information on this big event on their twitter page.
--------------------------------------------------------------------------------------------------------
** Please support this idea with your likes and comments, it is the best way to keep it relevant and support me. **
--------------------------------------------------------------------------------------------------------

KCS/BTC - KuCoin at a CRITICAL level! 😲The key resistance at 5k satoshi seems to hold so far, but KCS could break it again.
Bulls really have to turn this level in support to sustain a possible rally that would outpace and outperform BTC.
For now, the KCS/USD pair (see below) is bearish, but KCS has managed to make a higher high versus Bitcoin not seen since 2018! This is significant.
The MACD is also bullish, but momentum is a bit weak for buyers right now. Best to be patient here and wait for a clear signal.
I am neutral on this price action and we need more time to get a sense of the next direction vs BTC.
Like and follow if you liked my idea!
KCS/USD - Price about to retest the support at $17! 😱Despite a good attempt by KCS to rally and move above the key resistance at $21, the overall market turned bearish. This took KCS into a correction.
Price is not found at $19 but this level is unlikely to provide bulls with a lot of relief. A better support will be found lower at $17 should KCS continue to fall.
MACD is about to turn bearish on the 3-day timeframe, which is not good. A cross to the negative side would be a major bearish signal.
Volume remains rather low so sellers are not yet convinced and bulls could try to defend price from falling lower.
However, if BTC continues to fall, it is unlikely for KCS to hold off this sell pressure.
Bias is bearish on this price action.
Keep a close eye on the key levels and be patient.
Like and follow if you liked this idea!

KILT/USDT 20x Potential and Hope you saved Fund because my updat#KILT/USDT Technical Analysis:-
$KILT currently trading at $1.09
First Hope you saved your hard earned money and I hope not to have bought at that time price was $1.86
Now -44% down from last update so perfect update.
Now…?
As per last Chart this is good Buying zone.
Also forming Cup & Handle in High Time Frame.
Strong support around $1.0-$0.90
Perfect Entry:- $1.0-$0.90
Targets:- $1.86/$2.43/$3.49/$5.35/$10.73/$23.5
Stop Loss:- $0.75
$KILT is good Potential in Long term.
Breakout Point of Cup & Handle = $1.40

ETHUSDTHi
This analysis is a combination of Elliott waves and Elliott and harmonic patterns.
According to this analysis, the atrium is in a corrective phase.
The correction pattern is a large flat that is shown with A,B,C waves.
The C wave consists of 5 Elliot waves, which waves 1, 2, 3 and 4 are formed and it will have the 5th wave.
I guess Wave 5 (of the wave C) will end with the Shark pattern OR hitting the end of the drawn channel.
At the end of the wave C in the areas marked on the chart,flat pattern is completed and we will have a new trend(Uptrend)

KuCoin Token KCS Price Targets and Stop LossKCS/USDT
Entry Range: $19.50 - 21.20
Price Target 1: $22
Price Target 2: $23.65
Price Target 3: $27.50
Stop Loss: $18.50
