LADYS Cup and Handle - New S Coin Classic cup and handle pattern on a new asset (S-Coin) If this breaks it will enter price discovery and could go crazy.
Kucoin

HIBIRD Breakout IdeaI Like to trade Low Capitals in Kucoin, this coins are very volatile and risky, we are going use ONLY 1% of our portfolio and enter if there is a breakout at 0.04256 (Stop Limit Buy). Possible reward between 18-75%, stop lost -33%. If you do not know how to buy breakouts please ask your questions in the comment session.

✴️ ReapChain 750% Potential | The Cryptocurrency ProblemThis is the Cryptocurrency problem; The problem with the Cryptocurrency market.
Here ReapChain produced a hammer in its last weekly session and is being confirmed this week.
After a very strong correction, a massive long-term shakeout, all weak hands removed; a new waves develops equally strong.
This is another opportunity in a sea of countless opportunities...
I've been seeing hundreds of these charts.
Low risk and high potential, too many opportunities for one to look at let alone take.
That's the problem with the Cryptocurrency market, there are endless opportunities and they all tend to pay... If you are patience of course.
Namaste.


KCSUSDT Enormous buy opportunityThe KuCoin Token / KCSUSDT is on an incredibly bullish 1day candle today.
The price is rebounding after the 1day RSI dropped below the insanely oversold limit of 15.00 on Sunday.
The first target of this first bullish wave is the Falling Resistance and Resistance A cluster at 7.500.
After it breaks above the 1day MA100 as well, buy again and target all Resistance levels up to 9.745, which is our long term target.
Follow us, like the idea and leave a comment below!!

STRONG Long IdeaSpotted bullish Bat pattern, that can give you up to 97% in profits, wait for entry at 7$ retest over MA200 (Green Line). Stop lost -7%
This trade is HIGH RISK Use ONLY 1% of your Portfolio.

You sure about that?I was pretty sure on this retrace as we see it hit the target areas like clockwork.
I’m pretty sure the buy is a good entry point with a continue slow and steady increase back to the sell point.
Once we hit $0.53 again we may see one more retrace back to the black support line. Followed by support and an exponential increase in price to $0.58 will have a little resistance but hodl through it for the push past $0.60 all the way to $0.68 and potentially push to $0.76 before some selloffs occur.
Good luck and have fun with it

Storj Showing bullish Signs
Decent Volume Coming In Macd Crossover Confirming Bullish Strength
While Formed Text Book Descending Channel & Building Up For Massive Breakout
Incase Of Breakout Expecting 300 - 320% Bullish Wave In Midterm

BTCUSDT Hello friends, as I said before and the evidence is available, this market needed a lot of rest, and according to the divergent divergences, it should have moved downwards, and this movement can continue from 26200 to 25000. This is all possible and nothing. There is no certainty. Good luck

LONGONE has reached a good area to enter a buying position, to the left of the chart we find an order block, and the downtrend line forms a good support area
Buy point, targets and stop loss also on the chart
Enjoy !

LONGSpot ( Only ) Don't use lev
According to the trend line and MACD .. the price will rise from here
EP1:4.66
EP2:4.46
Targets on the chart
Stop loss Around 10%

LONGLong Term GMT ( Spot )
Do not use leverage
BUY 1: 0.2542
BUY 2: 0.2375
STOP LOSS : 0.2102
Targets :
0.2915
0.3481
0.4129
Enjoy

✴️ Verasity After A 440% Bullish WaveThis is the third one of the "V" Altcoins.
January 2023 produced 440% growth.
A correction follows and ends up in a higher low.
The third wave (Wave 1 January bullish breakout, Wave 2 the correction) is normally the biggest and so we can expect fireworks...
The potential target is mapped on the chart.
Can be less, can be more.
I also mapped for you the invalidation point (support).
Namaste.

LONGEntering now is fine, but it is best to set a limit order between 6655 and 6555.
Overview: After the strong crash of YFI's coin, I think it will pick up from here.
Stop loss does not exceed 2.8%. (at 6457)
Targets are displayed on the chart.

eep an eye on $BTC/USDUpon analyzing the Bitcoin chart within the daily time frame, it becomes evident that the price is currently undergoing a downward trend after breaching the areas of $26,900 and $26,500. Should the price maintain its position below the $26,500 mark, it is highly likely that a significant price decline will occur. In the event of such a decline, the initial target range would encompass $23,900 to $25,200, with a subsequent target of $20,000. The $20,000 level could potentially serve as a zone for a reversal in price direction, known as a Potential Reversal Zone (PRZ). Do you believe there is a possibility that the price will reach $20,000 within the next three weeks?
Please continue to follow my analysis and feel free to pose any inquiries you may have. I am here to assist you.
👤 FarmanBangashh : @FarmanBangashh
📅 20.05.2023
⚠️(DYOR) (NFA)
Noted: Not a financial advisor.
It's always recommended to carefully consider all the factors and conduct thorough research before making any investment decisions. I suggest seeking advice from a licensed financial advisor.

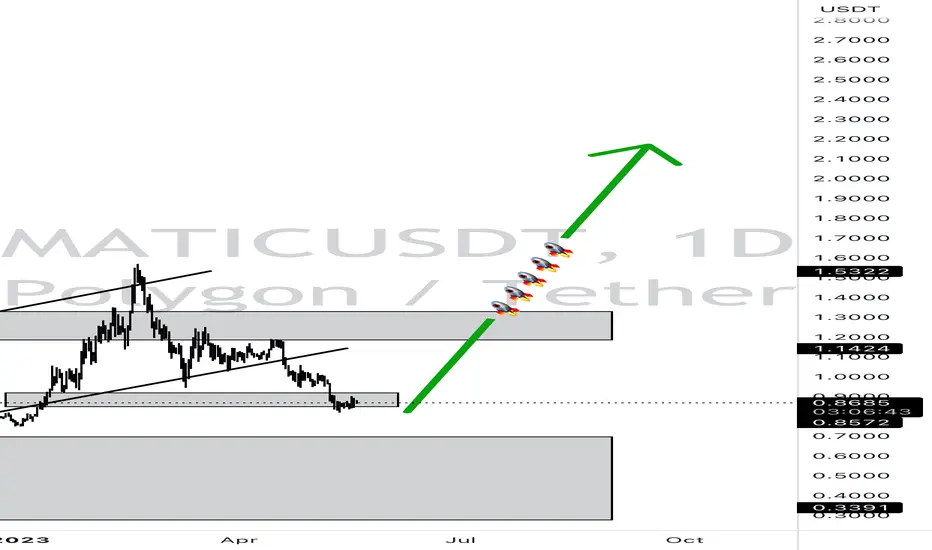
MATIC ROCKET Matic expecting a long rocket movement, Next week’s rocket launch targeting mid second high level of the market as on 1 day tmf
Keep an eye on $HIGH/USDTAccumulate it ranges 🤝 binance
Target mentioned
Noted: Not a financial advisor.
It's always recommended to carefully consider all the factors and conduct thorough research before making any investment decisions. I suggest seeking advice from a licensed financial advisor.

Just an ideaWe could see a retrace to the top the the black line being a triangle at
$0.068
However we could see an even lower retrace, but judging by BTC lack of power At the moment
As well as the ETH sell off and lower highs
I expect a retrace at least to $0.068

ChainGPT (CGPT) Breakout ChainGPT appears in break out territory. If price clears 0.20 then Bull is confirmed.

LONGDont use More than 8% of ur balance
if u have 100 use 8
if you have 1000 use 80
if u have 10000 use 800 and so on
EP1 0.21000
EP2 0.20000
Stop loss Around 6.5%
Targets on the chart
strategy type Fibo+ Ds Channel
Enjoy

BTCUSDTHello to all small and big traders, today I was checking all the empty spaces of CME when I noticed 3 gaps that have not been filled yet, one is in the area of 34000 to 34800, one is in the area of 21000 to 20000 and the other is in the area of 9500 to 10600. It doesn't matter if it is filled, but it must be filled. This plan is for a long-term view. Now or first, we will pay 34,000 dollars, and then the drop and the new floor, and then we will move right at the time of halving for the new ATH, or it will be filled later, whatever the case may be. be careful .

W10-6 KCS BULLISH IDEA(HARMONICS PATTERN)Potential Bullish Entry
Dow Theory In Place - Higher High and Higher Low Expected in Place
Formation of Harmonic Bullish reversal Pattern coupled with bullish divergence at potential reversal zone (PZR)
Entry at the new HH
SL & TP Levels are defined.

✳️ Fantom vs Bitcoin 1.1 Months Later...Here is an update for a pair that we shared late November... A little over a month ago.
Fantom (FTMBTC) continues with a bullish bias.
It is growing slowly and steadily as it should.
While uncertainty can be seen with major pairs/altcoins, the smaller ones paint a clear picture.
After the low is in, we get a long drawn out accumulation phase before the next bullish wave starts.
On the daily timeframe, FTMBTC is trading back above EMA50 giving it mid-term bullish potential. This supports our view of a bullish Q1 2023.
We can see similar charts across hundreds if not thousands of pairs.
Meaning, higher lows positioned for a higher high since the June/July 2022 low.
Some altcoins hit their lows in November and these two are set to grow in the months ahead.
Here is the previous chart, 28-Nov-2022, see for yourself: Fantom vs Bitcoin Moves Above EMA50 (85% Target Mapped)
It takes time...
Patience is key.
Namaste.
