KWEB: China’s Internet Sector - AI Catch-Up and Cheap ValuationsChina’s internet and tech stocks have been hammered for years — regulatory crackdowns, slowing growth fears, and geopolitical tension have crushed sentiment. But as investors know, the best opportunities often hide in what everyone hates.
Enter KWEB, the KraneShares CSI China Internet ETF.
It’s a diversified, liquid way to play a bounce in major names like Alibaba, Tencent, JD .com, Baidu, Meituan and PDD.
Here’s why I think the risk/reward looks compelling now — especially if you believe in AI closing the gap.
Key Bullish Points:
1) Valuations at Rock-Bottom
Many big China internet stocks are still trading at single-digit P/E ratios, even as their cash flows recover. Compared to U.S. big tech trading at 30–50x, this is a huge valuation gap.
Regulatory fears seem largely priced in — Beijing wants growth, not stagnation, and some policies are easing.
2) China’s AI Push — Just “Months Behind”
Jansen Whang recently argued that China’s generative AI development is only “months behind” the U.S. Players like Baidu, Alibaba Cloud, Tencent, and SenseTime are all racing to launch new LLMs and integrated AI tools.
If you believe the gap closes, Chinese platforms could see a major earnings rebound as they roll out AI upgrades across search, cloud, e-commerce and social media.
3) Sentiment So Bad, It’s Good
When the headlines scream “China is uninvestable,” that’s often when big mean reversion trades set up. Even a small policy pivot, stimulus plan, or positive AI news cycle can spark a sharp rally.
KWEB is one of the cleanest ways to express this view because it holds a diversified basket — you don’t have to pick a single winner.
KWEB

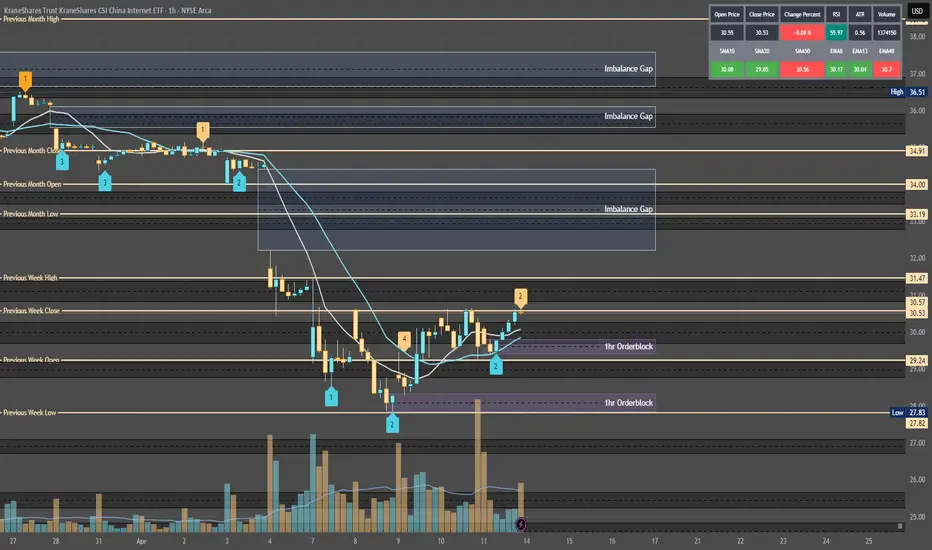
Quantum's KWEB Trading Guide 4/13/25Analysis:
Post-Close Options Activity (April 11):
Data: System reports 469.32K contracts traded on April 11, with puts at 10.99% (calls ~89%). High call volume at $31/$32 strikes suggests bullish bets.
Interpretation: Call-heavy flow indicates retail/institutional optimism, likely targeting a sweep above $31.35 (weekly high). Potential for a liquidity sweep trapping longs, aligning with ICT/SMT reversal.
RSI (14) Level and Trend:
Estimate: Daily RSI ~55 (neutral-bullish), based on April 11 close ($30.52, +2.97% from $29.62). Uptrend from April 8 low ($27.95) but below March 17 peak ($38.401) avoids overbought.
Interpretation: RSI supports bullish setups (above 50), with room for upside before resistance (~70). A sweep to $31.50 could push RSI higher, signaling OTE retracement.
Anonymized X Post Insights (April 11–13):
Summary: Posts highlight Chinese tech optimism (e.g., DeepSeek AI, consumer spending), tempered by tariff fears (Trump’s 125% threats). Some speculate on KWEB breaking $31, others note volatility risks.
Interpretation: Mixed sentiment leans bullish, with chatter about AI and stimulus driving buy-side interest. Tariff uncertainty suggests potential sell-side sweeps if news escalates.
Potential Reversals/Catalysts:
Liquidity Sweeps: Call-heavy options and X speculation point to a buy-side sweep above $31.35 (W-High), trapping retail longs before an OTE reversal to $30.00 (HVN).
Institutional Positioning: High call OI suggests dealers hedging bullish bets, but tariff risks could trigger smart money to fade retail.
Catalysts: Retail Sales (April 15) or tariff relief news could spike KWEB, while escalation could drive sell-side volatility.
Why: Sentiment aligns with ICT/SMT, where bullish retail chatter sets up sweeps, and smart money reverses at OTE. Neutral-bullish RSI and call volume support a setup.
Action: Log sentiment as neutral-bullish, expect sweep above $31 or drop to $29 on tariff news. Highlight for video: “KWEB’s call-heavy buzz could trap retail—watch for a smart money reversal.”
Tariff Impact
Assessment: Severe
Exposure:
KWEB’s holdings (e.g., PDD, JD.com, Tencent) rely on China’s internet economy, with significant supply chain and consumer exposure to U.S.-China trade. Tariffs (e.g., 125% proposed) raise costs for e-commerce and tech exports, hurting revenues.
Example: PDD (Temu) faces U.S. import duties, squeezing margins; JD.com’s logistics chain is tariff-sensitive.
Current Policy (April 13):
Context: Trump’s April 10 statement escalates tariffs to 125% on Chinese goods, with no relief confirmed by April 13. Web reports (Reuters, April 4) note market volatility from tariff fears, impacting KWEB’s April 8 low ($27.95).
Impact: Severe, as KWEB’s ETF structure amplifies holdings’ tariff pain (e.g., Alibaba, Tencent ADRs). Sentiment sours on escalation, driving sell-side sweeps.
Tariff Relief Potential:
Scenario: A 90-day pause or negotiation (rumored on X, inconclusive) could lift KWEB +3–5% ($31.50–$32.00), as seen in past relief rallies (e.g., February 2025, +1.6% on pause news).
Fundamentals: Relief boosts consumer spending on KWEB’s holdings, supporting bullish MSS. Without relief, bearish pressure persists.
AMT Tie-In: Tariff news creates imbalances (LVN breaks), with price seeking HVNs (e.g., $30.00) post-volatility.
Why: Severe tariff exposure makes KWEB sensitive to trade news, fueling sweeps (buy-side on relief, sell-side on escalation), per ICT/SMT.
Action: Rate tariff impact severe, monitor April 14 for negotiation updates. Video: “Tariffs could sink KWEB, but relief might spark a sweep to $32—stay sharp.”
News/Catalysts
Current (April 11, 2025)
Closing Price:
System Data: KWEB closed at $30.52 (currentPrice), +2.97% from prevDayClose ($29.62).
Verification: Matches April 11 high ($30.63), low ($29.41), open ($30.12).
Drivers:
Positive: Call-heavy options (89% calls) and AI buzz (DeepSeek, X posts) drove the rally. Web reports note Chinese tech resilience despite tariffs.
Negative: Tariff fears capped gains, with X posts citing Trump’s 125% threat as a drag.
Sector Trends: China ETFs rose (e.g., MCHI +2.1%, April 11), supporting KWEB’s move.
Why: Options flow and AI speculation fueled bullish momentum, but tariffs restrained breakout above $31.
Action: Highlight $30.52 close, +2.97%, driven by calls and AI. Video: “KWEB jumped 3% on AI hype, but tariffs loom large.”
Upcoming (Week of April 14–18)
Events:
April 15, Retail Sales (8:30 AM): Measures U.S. consumer spending, impacting KWEB’s e-commerce holdings (PDD, JD.com).
April 16–18, Tariff Talks: Potential U.S.-China negotiations, per X chatter (inconclusive).
Ongoing, China Stimulus: Rumored fiscal measures could lift Chinese tech, no date confirmed.
Predictions:
Bullish (+3%, ~$31.50): Strong Retail Sales (+0.5% MoM) or stimulus news boosts e-commerce, sweeping buy-side liquidity ($31.35).
Bearish (-3%, ~$29.50): Weak Retail Sales (-0.2% MoM) or tariff escalation triggers sell-side sweep ($29.41).
Neutral (±1%, $30.20–$30.80): Mixed data or no tariff news keeps KWEB near $30.00 (HVN).
Why: Catalysts drive displacement (sweeps to OHLC/LVNs), setting up OTE entries, per AMT/ICT.
Action: Set alerts for Retail Sales (April 15), monitor X for tariff updates. Video: “Retail Sales could push KWEB to $32 or drop it to $29—big week ahead.”
Technical Setup
Multi-Timeframe Analysis (Adjusted to April 11 Close, $30.52)
Weekly Chart
HVN (High Volume Node):
Level: $30.00 (POC, near W-Open $29.59, D-Close $30.52).
Role: Support, price consolidated March 24–April 11 ($29–$31).
Stance: Bullish (price above HVN, defending $30.00).
LVN (Low Volume Node):
Level: $31.50 (near W-High $31.35, April 4).
Role: Fast-move zone, price dropped post-$31.35 (April 4–8).
Stance: Neutral (price below LVN, potential sweep target).
EMA Trend:
Status: 8-week ($31.50) < 13-week ($32.00) < 48-week ($33.50), downtrend but flattening.
Stance: Neutral (price below EMAs, but $30.52 tests 8-week).
RSI (14):
Level: ~55 (neutral-bullish, up from 45 at $27.95, April 8).
Stance: Bullish (>50, room to 70).
MACD:
Status: Above signal, nearing zero (bullish crossover April 10).
Stance: Bullish (gaining momentum).
Bollinger Bands:
Status: Price at midline ($30.50), bands narrowing.
Stance: Neutral (breakout pending).
Donchian Channels:
Status: Above midline ($29.65, W-Low to W-High).
Stance: Bullish (breakout potential).
Williams %R:
Level: ~-40 (neutral, not overbought).
Stance: Bullish (>-50, rising).
ADR (Average Daily Range):
Status: Expanding (~3%, $0.90/day).
Stance: Bullish (volatility supports moves).
VWAP:
Status: Above VWAP (~$30.20, April 11).
Stance: Bullish (buyers control).
ICT/SMC:
MSS: Bearish (lower highs from $38.401, March 17, but higher low $27.95, April 8, signals potential shift).
Trend: Neutral (consolidation $29–$31, testing W-High $31.35).
Summary: Neutral-bullish, price at HVN ($30.00) with LVN ($31.50) as sweep target. Indicators favor upside, but MSS needs confirmation.
1-Hour Chart
Support/Resistance:
Support: $29.41 (D-Low, April 11), aligns with W-Open ($29.59), HVN ($30.00).
Resistance: $30.63 (D-High, April 11), near LVN ($31.50), W-High ($31.35).
Stance: Bullish (price above support, testing resistance).
RSI (14):
Level: ~60 (bullish, rising from 50 at $29.41).
Stance: Bullish (>50, not overbought).
MACD:
Status: Above signal, positive histogram.
Stance: Bullish (momentum building).
Bollinger Bands:
Status: Price near upper band ($30.60).
Stance: Bullish (breakout potential).
Donchian Channels:
Status: Above midline ($30.02).
Stance: Bullish (trend strength).
Williams %R:
Level: ~-30 (bullish, not overbought).
Stance: Bullish (>-50).
VWAP:
Status: Above VWAP (~$30.30, intraday April 11).
Stance: Bullish (buyers dominate).
ICT/SMC:
Buy-Side Liquidity: Above $30.63 (D-High), $31.35 (W-High), LVN ($31.50). Retail stops cluster here.
Sell-Side Liquidity: Below $29.41 (D-Low), $27.95 (W-Low/M-Low).
OB: Bullish OB at $29.80–$30.00 (April 10 consolidation, demand zone, near HVN $30.00).
FVG: Bullish FVG at $30.00–$30.20 (April 11 gap, unfilled, aligns with D-Open $30.12).
OTE: Fib 61.8%–78.6% from $29.41 (low) to $30.63 (high) = $30.05–$30.15 (overlaps OB/FVG/HVN).
Displacement: Potential impulsive move to $31.50 (LVN) or $29.00 (below D-Low) on Retail Sales or tariff news.
Summary: Bullish bias, with OTE ($30.05–$30.15) as entry zone post-sweep, supported by OB/FVG/HVN.
10-Minute Chart
Closing Move (April 11):
Status: Rallied to $30.52, closed near high ($30.63), strong volume.
Stance: Bullish (buyers pushed close).
EMA Direction:
Status: 8-EMA ($30.45) > 13-EMA ($30.40) > 48-EMA ($30.30), uptrend.
Stance: Bullish (EMAs rising).
RSI (14):
Level: ~65 (bullish, cooling from 70).
Stance: Bullish (>50, not overbought).
MACD:
Status: Above zero, bullish crossover.
Stance: Bullish (momentum intact).
VWAP:
Status: Above VWAP (~$30.40, late April 11).
Stance: Bullish (buyers control).
ICT/SMC:
Liquidity Sweep: Wick to $30.63 (8:50 AM, April 11) tested buy-side, no clear rejection yet.
Retracement: Potential retrace to $30.05–$30.15 (OTE) if sweep completes (e.g., April 14, 8:00 AM).
Entry Signal: Pin bar or engulfing at OTE (e.g., $30.10, 10-minute candle).
Summary: Bullish, awaiting sweep above $30.63 or $31.35, retrace to OTE for entry.
Options Data
Analysis:
GEX (Gamma Exposure):
Status: Positive GEX at $31 strike (high call OI), neutral at $30.
Impact: Dealers buy stock to hedge calls, supporting $31 pin or slight lift to $31.50.
Explanation: Positive GEX stabilizes price near high OI strikes, aligning with LVN ($31.50) sweep.
Stance: Neutral-bullish (pinning likely, breakout possible).
DEX (Delta Exposure):
Status: High call delta (+0.3, 89% call volume).
Impact: Bullish pressure, as dealers hedge calls by buying KWEB.
Explanation: Call-heavy delta fuels upside momentum, supporting buy-side sweep.
Stance: Bullish.
IV (Implied Volatility):
Status: Moderate (~25%, vs. 20–35% norm for KWEB).
Impact: Steady swings ($0.50–$1.00/day), good for ATM/OTM calls.
Explanation: Moderate IV balances premium cost and volatility, ideal for OTE entries.
Stance: Bullish (volatility supports options).
OI (Open Interest):
Status: Call-heavy (65% calls at $31, 20% at $32, 15% puts at $30).
Impact: Momentum toward $31–$32, potential pin at $31 (high OI).
Explanation: High call OI marks targets (W-High $31.35, LVN $31.50), puts at $30 guard HVN.
Stance: Bullish (calls drive upside).
Cem Karsan’s Application and Weekly Trading Breakdown:
Gamma: High at $31 (pinning risk), low at $32 (breakout potential).
Vanna: Rising IV (25% to 30% on Retail Sales) lifts calls, dealers buy KWEB, pushing to $31.50.
Charm: Near OPEX (April 18), $31 calls hold delta if ITM, spiking volatility April 17–18.
Volatility Skew: Call skew (higher IV for $32 vs. $30) favors upside breakouts.
Weekly OI (Exp. April 18): 65% calls at $31, 20% at $32. Pinning likely at $31 unless Retail Sales sparks breakout to $32.
Options Strategy:
Trade: Buy $31 calls at OTE ($30.10, April 14, 8:50 AM), premium ~$0.50.
Exit: $31.50 (W-High/LVN, premium ~$0.90), profit $0.40.
Stop: Below OB ($29.80, premium ~$0.20), risk $0.30.
R:R: 1.33:1 (adjust to 2:1 with partial exit).
ICT/SMC Tie-In: Enter post-sweep ($31.35), retrace to OTE ($30.10), target $31.50.
Vanna:
Status: IV rise (25% to 30%) amplifies calls, dealers buy KWEB.
Impact: Bullish lift to $31–$31.50, aligns with LVN sweep.
Explanation: Vanna boosts delta near high OI, supporting OTE reversal.
Charm:
Status: OPEX (April 18) nears, $31 calls gain delta if KWEB hits $31.
Impact: Volatility spikes April 17–18, favors quick OTE trades.
Explanation: Charm accelerates delta, amplifying sweep-to-OTE moves.
Timeframe Analysis:
Weekly (Exp. April 18):
OI: 65% calls ($31), 20% ($32), 15% puts ($30).
IV: Moderate (25%), rising on catalysts.
Stance: Bullish (calls dominate, breakout risk).
Monthly (Exp. May 2):
OI: Balanced (50% calls $32, 50% puts $29).
IV: Stable (~24%).
Stance: Neutral (consolidation likely).
3-Month (Exp. July 7):
OI: Call skew ($33–$35, 60% calls).
IV: Low (~22%).
Stance: Bullish (long-term upside).
Directional Bias:
Synthesis: Positive GEX ($31 pin), high call DEX (+0.3), moderate IV (25%), call-heavy OI (65% at $31), vanna (IV lift), charm (OPEX volatility), and ICT/SMC (buy-side sweep to $31.35, OTE at $30.10) suggest a bullish trend for April 14, with potential retracement post-sweep.
Why: Options data aligns with ICT/SMT (call OI = buy-side liquidity, OTE = dealer hedging zone), per AMT (LVN sweep, HVN reversal).
Action: Focus on $31 calls, highlight pinning vs. breakout. Video: “KWEB’s $31 call wall could pin or pop—perfect for an OTE play.”
Sympathy Plays
Correlated Assets:
MCHI (iShares MSCI China ETF): Tracks broader Chinese equities, rises ~2–3% if KWEB rallies (e.g., $31.50), due to shared holdings (Alibaba, Tencent).
BABA (Alibaba ADR): KWEB’s top holding, moves +3–4% on KWEB’s sweep to $31.35, driven by e-commerce/AI overlap.
Opposite Mover:
GLD (SPDR Gold ETF): Risk-off asset, fades ~1–2% if KWEB rallies (risk-on), as investors shift from safe havens to tech.
Why: Sympathy plays confirm sector momentum (Chinese tech), while GLD hedges tariff fears, per ICT/SMT sentiment.
Action: Monitor MCHI/BABA for confirmation, GLD for divergence. Video: “If KWEB pops, MCHI and BABA follow—watch gold for the flip side.”
Sector Positioning with RRG
Sector: Technology – Emerging Markets (China Internet).
RRG Position: Improving (vs. MCHI ETF).
Rationale: KWEB’s April 11 rally (+2.97%) outpaces MCHI (+2.1%), with RSI (~55) and call OI signaling strength. Tariff fears weaken absolute gains, but relative momentum grows.
Tie-In: Improving quadrant supports bullish MSS, OTE entries at HVN ($30.00).
Why: RRG aligns with sentiment (call-heavy) and technicals (above HVN), per AMT value area.
Action: Highlight Improving RRG for video: “KWEB’s gaining steam in China tech—prime for a sweep setup.”
Targets
Bullish:
Target: +3.5% to $31.60.
Levels: W-High ($31.35), LVN ($31.50), next resistance ($32.00).
Rationale: Buy-side sweep to $31.35 (W-High), breakout to LVN on Retail Sales or tariff relief, per ICT/SMC.
Bearish:
Target: -3.2% to $29.55.
Levels: D-Low ($29.41), below W-Open ($29.59), HVN ($29.50).
Rationale: Sell-side sweep below $29.41 on weak Retail Sales or tariff escalation, retracing to HVN, per AMT.
Why: Targets tie to OHLC (W-High, D-Low), HVNs/LVNs, and catalysts, ensuring ICT/SMC alignment (liquidity to OTE).
Chinese Internet Stocks on the Edge: KWEB vs. FXI Introduction:
The Chinese internet sector AMEX:KWEB is at a critical juncture when compared to large-cap Chinese stocks AMEX:FXI . The ratio between these two reflects sector leadership—if KWEB outperforms, it signals renewed strength in internet stocks and suggests the sector is leading.
Current Market Context:
Potential Breakdown: The KWEB-to-FXI ratio is teetering near key support. A breakdown here would be a bearish signal for Chinese internet stocks.
Bullish Outlook: However, bulls are closely watching for signs of outperformance from KWEB, which could indicate the start of a new bullish trend.
Higher-Low Formation: If the ratio forms a higher low relative to its long-term trend, it would be a sign of potential strength in the internet sector.
Key Levels to Watch:
Support: Monitor the ratio’s current support level closely. A breakdown below this could lead to increased selling pressure on KWEB.
Resistance: A breakout above recent highs would indicate renewed outperformance and signal a bullish rotation into internet stocks.
Conclusion:
KWEB is at a make-or-break point, and the coming days could determine its fate. If the sector can establish a higher low and break above resistance, it could signal a bullish shift for Chinese internet stocks. Will KWEB lead, or will large-cap Chinese stocks maintain their dominance? Let me know your thoughts in the comments!
Charts:
(Include a chart showing the KWEB-to-FXI ratio, marking key support, resistance, and any signs of higher-low formations.)
Tags: #KWEB #FXI #ChineseStocks #InternetSector #SectorLeadership #TechnicalAnalysis #MarketTrends #China

KWEB BrewingAnother chinese name brewing a great setup
It needs to move quiet a bit before consider an entry, but I have my eyes on this pennat

Kraneshares China Internet ETF | KWEB | Long at $26.00The "beginnings" of a change in the downward trend of China's tech stock market may be starting to unfold. The price of Kraneshares China Internet ETF AMEX:KWEB has finally reconnected with my selected simple moving average (SMA) which often means further price consolidation or future price breakout from the overall mean. I'm not saying this will happen immediately and this particular SMA likes to be tested to "fake out" buyers and sellers (sometimes over months or years). Plus, there are price gaps in the low BER:20S on the daily chart that often get filled before a run. But for the early birds out there, like myself, AMEX:KWEB at $26.00 is in a personal buy zone as a starter position.
Target #1 = $30.00
Target #2 = $37.00
Target #3 = $49.00
Target #4 = $100.00 (very long-term view...)

FXI - iShares China Large-Cap ETF... FXI stock is a strong buy due to China's rapid economic growth, diverse portfolio of leading companies, and potential for high returns. Investing in FXI offers exposure to China's expanding market.
9988.HK
Alibaba Group Holding Limited 9.72%
0700.HK
Tencent Holdings Limited 8.73%
3690.HK
Meituan 8.09%
00939
00939 7.08%
01398
01398 4.74%
03988
03988 4.26%
9999.HK
NetEase, Inc. 4.00%
1810.HK
Xiaomi Corporation 3.77%
9618.HK
JD.com, Inc. 3.73%
01211
01211 3.51%
FXI stock is a strong buy because while the US and Europe have experienced an incredible bull run, China's market hasn't seen the same gains. This offers a unique opportunity for potential growth and high returns.

HSI - KWEB - FXI - YINN --- China UptrendChart is self explantory. Bottomline I think we came to the end of 4 year long bear market in China. If they don`t blow up the Taiwan issue, coast is clear.
Econ gathering on 14-16 July, CCP will explain it reforms. I don`t buy what they sell but they would most likely provde liquidity to the market pre and post this economic forum which they do every 5 years. Even for a small pop, this could be a nice play.
BABA - PDD - JD - Tencent...ideally I play with YINN but all the names will benefit eventually.

THE MOST Bullish chart you will see today!Is of the Shanghai composite.
A beautiful HVF is nearing pattern triggering,.
Early accumulation is probably warranted!
Isn't now the most bearish FUD, over the Chinese economic miracle you have ever seen in a lifetime.
The chart is telling a different story of consolidation of its extreme growth and continuation of it's remarkable rise.
A quadrupling on the index means some of the underling securities will yield life changing gains.
I haven't done any due diligence on individual names
But an #ETF to keep an eye on is #KWEB
Which is a basket of Chinese internet stocks.

Opening (IRA): KWEB May 17th 24 Monied Covered CallLooking to get a fill on a monied covered call in KWEB (IVR/IV 12/33.2) while I wait around for some (or any) vol to show itself in the broader market. That IVR isn't great, but I'm going small so that I can potentially add at more favorable strikes/share cost bases should an opportunity present itself.
It's pre-market, so bid/ask is somewhat wide on both the shares and the short call, but I'm looking to buy a one lot and sell a -75 delta call against for around 26.09 in order to emulate the delta metrics of a 25 delta short put, have built-in short call defense, and to take advantage of IV skew on the call side (it's 39.4% at the 24 call strike; 32.4% at the 24 put).
On a side note, the on margin variant of a Plain Jane short put isn't paying spectacularly from a dollar and cents standpoint: the May 17th 24 short put is paying .37 at the mid, which isn't anything to write home about, but that would be on a BPE of 6.72 (5.51% ROC at max; 2.75% at 50% max; 23.63 break even) should you want to go the standard short put/acquire/cover route.
Break Even/Cost Basis in Shares/Buying Power Effect: 23.09
Max Profit: .91 ($91)
ROC at Max: 3.49%
ROC at 50% max: 1.74%
In all likelihood, I'll have to "penny up" if I don't get a fill for 23.09 ... .

BABA building a potentially bullish setupThe China tech sector is looking was oversold and due for a sizeable rebound soon.
Alibaba (BABA), among others, seems near to complete its corrective B wave and start a new upleg.
Only a break below last year's low would invalidate this view.

KWEB Inverse H&S on Weekly chartLooking at KWEB or Chinese TECH. Inverse H&S Pattern potentially. On fundamental side if China continues to cut rates and add fiscal stimulus this could potentially break out and run. China is only major country cutting interest rates currently.


$PDD - The Appeal 🔥 NASDAQ:PDD appealing setup - remaining subdued throughout the day, setting the stage for a potentially stronger push. If it surpasses $82.83, we can expect a move towards $84, followed by a possible pullback before attempting to test the 61.8% retracement level at $88.45 (gap fill). PDD's showing promise with the recent distribution of $697 million USD in deep discounts to generate consumer demand. The extended rally is also fueled by China stimulus hopes ( NYSE:BABA , NASDAQ:JD and major Chinese tickers are witnessing the same effect).

Chinese Internet Stocks - KWEBnext leg up possibly starts very soon. Looking like an inverted head and shoulders bottoming pattern here, and with daily and weekly bullish divergences on RSI, I would think continuation up is likely.
Over 34.5 would be a big step forward and could take it to the 50 area again.
Good luck!

$JD Potential IHS still intact Hey guys, after a big down day today, I wanted to take a look at the chart again. The inverse head and shoulders is still intact. I really want to see the RSI trendline keep that incline slope.
If it doesn’t hold RSI tendline, we may head all the way to oversold conditions, which could be several dollars below here if we don’t get a significant rally. Also, It could potentially be a sign that the selling pressure is still present.
Everything here is just an opinion, and made for entertainment purposes. This is in no way, shape or form any any type of financial advice or advice in general. This is for entertainment purposes only.

KWEBI believe, for sometime KWEB should take a pause for a brief time:
1) The current price is right at the resistance zone on the weekly chart ($31.xy to $32.nm) - We can see many times in the past the price has turned back from these levels.
2) 50 ema on weekly chart is right at the resistance, working as double resistance for the price move.
3) Dragon fly doji at the resistance means zone of strong supply.
4) The rally has been a swift and strong, now it is a few weeks old for next round of healthy run it should take a pause.
Bull:
1) RSI is healthy.
2) A support is at $28-$29ish
3) Standard Deviation is higher than its previous peak and heading higher
4) Once the pause is over, next pause should be at around $38.50ish
Conclusion: Overall view on KWEB is positive. In a short term the KWEB should take a pause, possibly fall a bit, before starting to run again. If the drama around possibility of US ban on Chinese stocks ends and the Zero COVID policy is lifted, then 2023 will be the year of Chinese Stocks.
PS: I am new to analysis. So, do not forget to do your own research, make your own decision, you are responsible for your trades. I welcome inputs to improve my analysis. So, please share your knowledge and guide me.

KWEB (China Internet stocks) seems to be ready to outperformThe ratio of KWEB/QQQ seems to have completed its bearish pattern and ready to rise. Support around 0.06, targets/resistances at 0.14 then 0.21.

KWEB: UNIQUE LONG TERM OPPORTUNITY?KWEB, Chinese internet ETF
Chinese techs have been in a bear market since February 2021, with the price of KWEB unable to break above the long trend line (in blue).
Kweb has found a bottom in March 2022.
Is Kweb bullish? Is it the end of the bear market for Chinese tech stocks?
Here is everything you need to know before making a decision:
- Currently the price is trying to create a bottoming base as we have seen higher lows (light black line) since March and the bearish trend line (blue) was broken.
- I see an ascending triangle with the top horizontal line of the triangle at 32.71. We tried to break this line 3 times but failed to maintain above. A sustainable break above 32.71 would be considered as bullish.
- We could backtest the rising black line of the ascending triangle before starting a bullish trend, but not sure.
- Mind the small gap around 28 that could also be filled.
- We're above the ichimoku cloud, which shows that the trend is changing. The lagging span (in green) still have to confirm the change of trend by crossing the bearish blue trend line.
- China in quantitative easing mode as western economies are tightening.
I'm long KWEB with a long term view. My buying zone is between 30 and 27.74 with a stop at 26.40 .
Trade safe.

WATCH $BABABullish
Fundamental
- Inflation Macro environment / fear sentiment
- Funds Accumulation
- Positive PE
- Negative PEG ( seems leaning towards a value stock )
- Positive P/FCF
- Weak Sector / Industry / not Leader
- Very competitive online retail market
Technical
- Momentum Theory Indicator - break out downtrend / bottomed out
- Price action formation ( falling wedge )
- Broke out downward trend line and retest
- Price above POC
- Price below major S/R level
- Huge volume spike!
- MACD divergence
Entry idea
- Entry idea was based on few confluences
- Price above major S/R level
- Price above fibo level
- Price above 200 MA
Stop loss set on previous low or POC level
" STEPS BY STEPS, BASE CAMP TO BASE CAMP. I WILL SUMMIT"
Cheers and happy trading!

6/26/22 BABAAlibaba Group Holdings Ltd. ( NYSE:BABA )
Sector: Retail Trade (Internet Retail)
Market Capitalization: $309.183B
Current Price: $117.62
Breakout Price: $120.00
Breakdown Price: $85.00
Buy Zone (Top/Bottom Range): $102.65-$87.00
Sell Zone (Top/Bottom Range): $113.80-$124.95
Price Target: $128.40-$131.70 (1st), $167.50-$171.10 (2nd), $15.70-$14.00 (3rd)
Estimated Duration to Target: 29-31d (1st), 117-124d (2nd), 340-356d (3rd)
Contract of Interest: $BABA 7/15/22 120c, $BABA 10/21/22 130c, $BABA 6/16/23 100p
Trade price as of publish date: $6.47/contract, $11.98/contract, $14.93/contract

6/26/22 PDDPinduoduo Inc. ( NASDAQ:PDD )
Sector: Retail Trade (Internet Retail)
Market Capitalization: $82.667B
Current Price: $65.96
Breakout price: $71.40
Buy Zone (Top/Bottom Range): $55.15-$31.65
Price Target: $94.60-$98.60 (1st), $115.40-$119.30 (2nd)
Estimated Duration to Target: 60-66d (1st), 120-129d (2nd)
Contract of Interest: $PDD 8/19/22 80c, $PDD 10/21/22 90c
Trade price as of publish date: $3.85/contract, $4.50/contract

6/12/22 KWEBKraneShares Trust CSI China Internet ETF ( AMEX:KWEB )
Sector: Miscellaneous (Investment Trusts/Mutual Funds)
Market Capitalization: $--
Current Price: $37.80-$39.60
Breakout price: $32.70
Buy Zone (Top/Bottom Range): $31.60-$26.35
Price Target: $37.80-$39.60
Estimated Duration to Target: 50-53d
Contract of Interest: $KWEB 8/19/22 35c
Trade price as of publish date: $2.38/contract

Long when pullback20th March 2022
KWEB (Chinese internet ETF)
Since China says it will support Chinese IPOs abroad, calls for closure on tech crackdown last week, we can see most Chinese ADR shares shoot up. If KWEB fall below $20, will not be a good sign.
Otherwise, this ETF is good to enter for long term investor. As for trading, long whenever it pull back.
