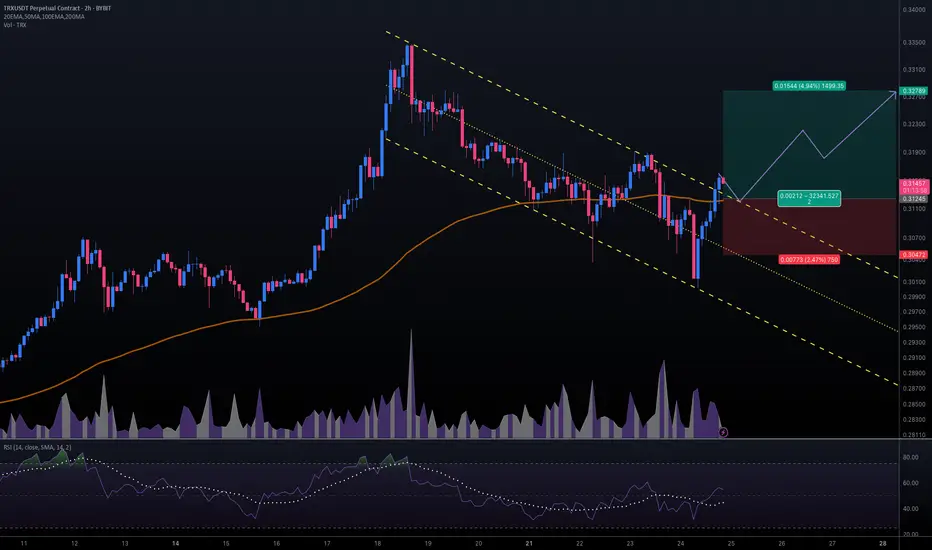
#TRXUSDT #2h (ByBit) Descending channel breakout and retestTron just regained 100EMA support and seems ready for bullish continuation after a pullback to it.
⚡️⚡️ #TRX/USDT ⚡️⚡️
Exchanges: ByBit USDT
Signal Type: Regular (Long)
Leverage: Isolated (16.0X)
Amount: 5.1%
Entry Targets:
1) 0.31245
Take-Profit Targets:
1) 0.32789
Stop Targets:
1) 0.30472
Published By: @Zblaba
CRYPTOCAP:TRX BYBIT:TRXUSDT.P #2h #TRON #DPoS #L1 #Web3 trondao.org tron.network
Risk/Reward= 1:2.0
Expected Profit= +79.1%
Possible Loss= -39.6%
Layer1
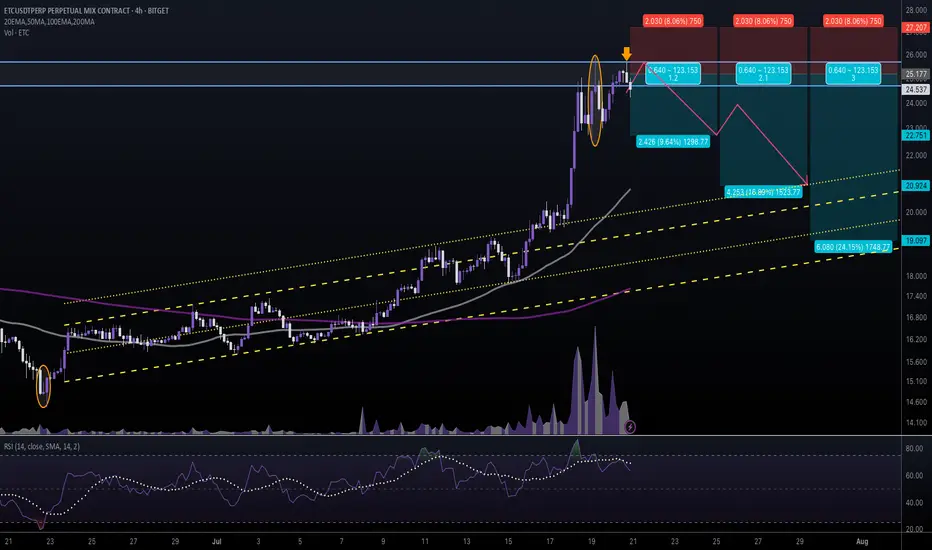
#ETCUSDT #4h (Bitget Futures) Ascending channel retestEthereum Classic printed two evening stars in a row, looks locally topped and ready for correction towards 50MA & 200MA supports.
⚡️⚡️ #ETC/USDT ⚡️⚡️
Exchanges: Bitget Futures
Signal Type: Regular (Short)
Leverage: Isolated (5.0X)
Amount: 5.0%
Entry Zone:
24.679 - 25.675
Take-Profit Targets:
1) 22.751
2) 20.924
3) 19.097
Stop Targets:
1) 27.207
Published By: @Zblaba
CRYPTOCAP:ETC BITGET:ETCUSDT.P #4h #EthereumClassic #PoW #L1 ethereumclassic.org
Risk/Reward= 1:1.2 | 1:2.1 | 1:3.0
Expected Profit= +48.2% | +84.5% | +120.7%
Possible Loss= -40.3%
Estimated Gaintime= 1-2 weeks
TradeCityPro | SUI Eyes Breakout with Bullish Momentum Rising👋 Welcome to TradeCity Pro!
In this analysis, I want to review the SUI coin for you. It’s one of the Layer1 projects in the crypto space, currently ranked 13 on CoinMarketCap with a market cap of $13.66 billion.
📅 Daily Timeframe
On the daily timeframe, a lot has changed for SUI since the previous analysis. After breaking the descending trendline, it has started a new bullish trend.
✔️ In the first bullish leg after breaking the trendline, the price reached the 4.0866 zone, and now after a correction, it’s moving upward again.
📈 The 4.0866 level is a very important resistance. In fact, we can draw a resistance range between 3.6402 and 4.0866, as the price tends to behave erratically within this zone.
⭐ Currently, the price has re-entered this range and if 4.0866 is broken, the bullish wave could continue. The first target for this wave could be 5.2689.
🔼 So, if 4.0866 is broken, I highly recommend opening a long position, because if the price truly breaks this level (and it’s not a fake breakout), then the minimum target would be 5.2689.
📊 If the buying volume continues to increase as it is now, and the RSI breaks above 76.64, the chances of breaking 5.2689 will also rise, and the price may even set a new ATH.
👀 I already have an open position on this coin based on lower timeframe triggers, and I’m currently waiting to see the reaction to 4.0866. Based on my entry, if the price moves toward 5.2689, the risk-to-reward ratio will be very high. That’s why I’ve kept part of my position open to potentially capture that move.
🛒 For spot buying, we can also use a futures strategy — meaning if 4.0866 breaks, we open a futures position targeting 5.2689, and then use the profit from that position to buy SUI in spot, gradually building our spot portfolio.
✨ If you are looking at this coin only for spot, the main trigger is the breakout of 5.2689. But be careful — if the price moves aggressively, it might not give you a proper entry trigger, and entering from that area might be difficult.
📝 Final Thoughts
This analysis reflects our opinions and is not financial advice.
Share your thoughts in the comments, and don’t forget to share this analysis with your friends! ❤️

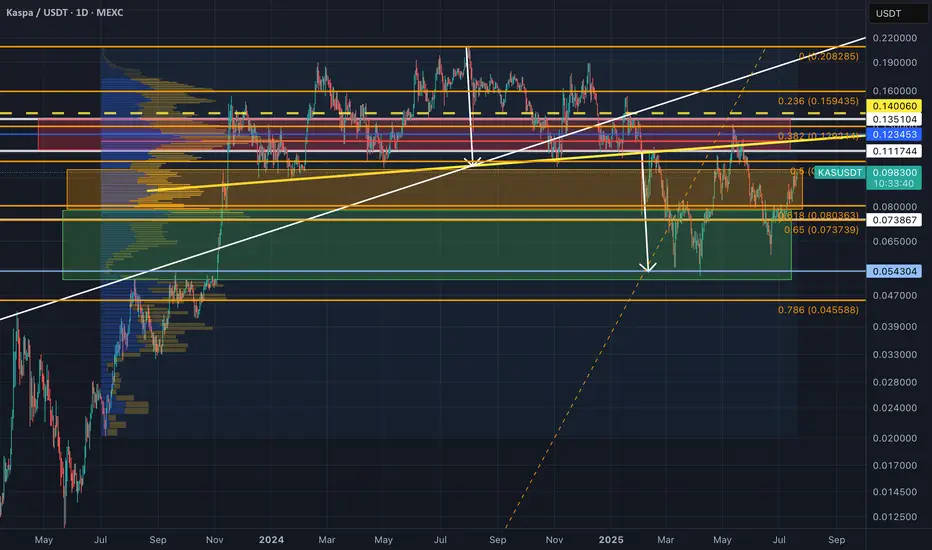
Last chance to reaccumulate Kaspa while it is below 10 cents?Second chance to accumulate CSE:KAS at below 10 cents after its correction down to 5 cents from its 20 cents ATH is coming to an end?
Previously, technicals looked great for CSE:KAS (and other ALTs too) with a breakout from a cup-&-handle pattern in July/Aug2024, but market says otherwise with gloomy economic report. >> For the small portion of capital assigned to trading crypto: I got stopped out from my (manually adjusted) trailing stoploss, with an approx. 6.8%avg loss from my BTC and ETH DCA spot injections into CSE:KAS from 10 cents all the way to 20 cents ATH.
For my long-term investment hold, I had bought from 2 cents all the way to almost ATH (at ~15 cents) and still holding and adding to it now as long as KAS is below. 10 cents. Had started accumulating aggressively again within the green zone, and probably gonna stop soon once KAS leaves the orange zone.
Last cycle, my main Altcoin investment focus was in ADA (POS and UTXO based chain based on academic research and peer-reviewed design), eventually selling most of other ALTs into ADA. This cycle, my personal investment focus is in Kaspa — and probably holding 15%(?) through the bear market correction after blow-off-top into the next cycle together with BTC and some ETH as well. Fingers crossed with regards to price; although the technology, decentralization ethos, and general fundamentals behind it is IMO extremely sound, and has a high probability (though not certain) to eventually establish itself to become one of the (if not THE) top L1s into the future.
———————————————
My reply re. the past YTD price performance of CSE:KAS , which I feel might be worth sharing here.
"For Kaspa, on the YTD timeframe, it has corrected ~50% down, after a ~10x rise from about 2 cents (when I first got in, in 2023) all the way to 20 cents. It is still an early tech about 3 years old and still not widely know; hence as an investment, it is definitely risky and high volatility is to be expected (not listed in high liquidity Tier1 exchanges yet), just like BTC in 2017 where I first bought at ~3kUSD, and a lot more significantly at 5k, and all the way to its ATH at 20kUSD, and stupidly held when it dropped all the way to 3kUSD, and kept on buying with a long-term view.
I view Kaspa in the same light as BTC (different from other cryptos), the only two that I will probably still hold a small but significant portion of, after the blow off top of this cycle due to its fundamentals that I am personally drawn towards -- e.g. POW but 6000x faster than BTC in bps, and ultimately will be 60000x faster once the DAGKnight protocol is implemented in 2026 (trilemma solved); protocol are based on peer-reviewed published research; fair-launched with no-VCs pre-allocation nor pre-mine; no central controlling figure; no DAG/Chain bloating due to implementation of pruning and where 0% TX-archival nodes are needed to maintain the security of mining, and are only necessary for explorers and institutions that intends to track TXs; (soon to come in Q4) Two Layer 2 implementations that will eventually be "Based-Zkrollups" (something that Ethereum planned to implement but was not feasible due to speed and cost issues, even after its POS-fork) -- where L2 TXs are instantly settled onto L1 without security compromising batching of TXs and delayed settlement that Eth-L2s currently does, and more.
But KAS is just a crypto project that I am personally interest in; and I am certainly not recommending anyone to buy as an investment, well unless they see something interesting in it too as I do. ;)"
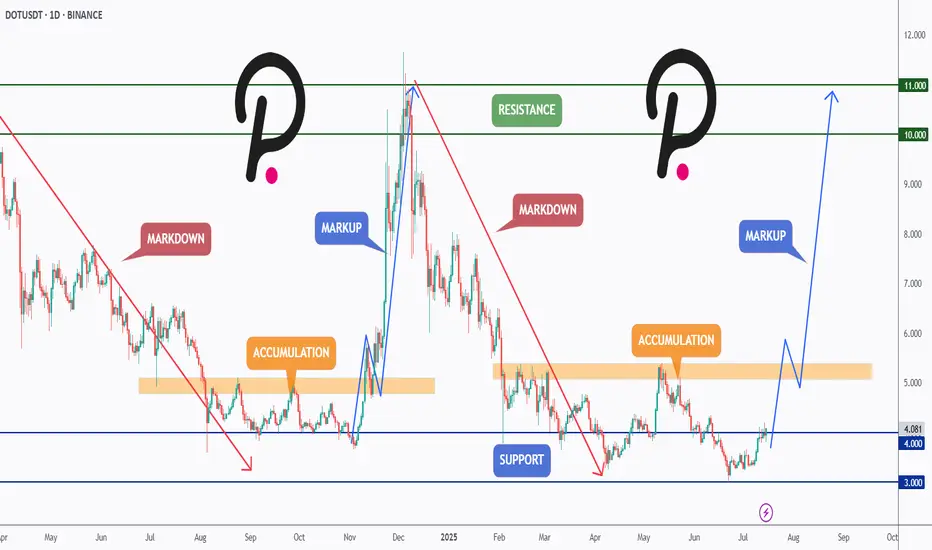
DOT Reloading for Takeoff ?CRYPTOCAP:DOT has been following a textbook Wyckoff cycle — moving from markdown into accumulation, followed by a sharp markup, then another markdown, and once again settling into a fresh accumulation zone.
After retesting the major support at $4 and holding above it, DOT is showing early signs of bullish momentum. If this structure continues, we could be preparing for another markup phase with potential targets at the $6, $10, and even $11 resistance zones.
This setup mirrors the previous cycle — will history repeat itself?
📍 Key Levels:
Support: $4.00 & $3.00
Resistance: $6.00, $10.00, and $11.00
Let me know your thoughts in the comments 👇
📚 Always follow your trading plan regarding entry, risk management, and trade management.
Good luck!
All Strategies Are Good; If Managed Properly!
~Richard Nasr
TradeCityPro | SOL Holds PRZ as Bulls Eye Range Breakout👋 Welcome to TradeCity Pro!
In this analysis, I want to review the SOL coin for you. This is one of the popular Layer1 projects, nicknamed the “Ethereum killer,” with a market cap of $85 billion, currently ranked 6 on CoinMarketCap.
📅 Weekly timeframe
In the weekly timeframe, after the bankruptcy news related to FTX, this coin had a very sharp bearish move and even dropped to as low as 9.84, but it managed to recover afterward.
⭐ From the key top at 27.62, a very strong bullish move started, reaching up to 255.96 and retesting its previous ATH.
📊 Currently, a range box has formed between the 128.66 and 255.96 levels, where the bottom of this box is a very strong PRZ, created from the overlap of a major support zone and the area between the 0.236 and 0.382 Fibonacci levels.
🔍 Also, the price is being supported by the SMA99, which has supported the price twice so far and has prevented the box from breaking to the downside.
⚡️ If you have already bought SOL, you can set your stop-loss if the price closes below this area. A confirmed breakdown could lead to deep corrections toward lower Fibonacci levels.
🛒 For buying this coin, the first trigger is the break of 178.22, which is a bit riskier but offers a good price entry. On the other hand, if the price revisits 128.66 and gives confirmation, we can enter from there.
📈 However, the main trigger for spot entry is the breakout of the 255.96 top. Breaking this level can unlock some very ambitious targets. If that happens, I’ll definitely update the analysis and provide those targets.
📅 Daily timeframe
In this timeframe, we can see the price action in more detail. A small range box has formed between 144.11 and 164.74, and the price is currently stuck below the top of the box and reacting to it.
✨ If 164.74 breaks, we can enter a long position. The next major resistance is 183.54. A breakout above that will serve as the main confirmation for a long position targeting 255.96, which can also be used as a spot trigger.
💥 The RSI oscillator is now above the 50 zone, and if it enters the Overbuy area, it will serve as strong momentum confirmation for this position.
✅ If the price gets rejected from the top, we can also open short positions on lower timeframes. A break below 144.11 will be the main short trigger.
📝 Final Thoughts
This analysis reflects our opinions and is not financial advice.
Share your thoughts in the comments, and don’t forget to share this analysis with your friends! ❤️

TradeCityPro | HBAR Rebounds Sharply After Trendline Breakout👋 Welcome to TradeCity Pro!
In this analysis, I’m going to review the HBAR coin for you—one of the RWA and Layer1 crypto projects, currently ranked 16 on CoinMarketCap with a market cap of 9.95 billion dollars.
📅 Daily Timeframe
On the daily chart, as you can see, after a bullish rally toward the end of 2024, HBAR entered a corrective phase and is currently still in this correction.
✨ A major support zone (highlighted on the chart) was established, and a range box was formed between this zone and 0.21765 where price had been consolidating.
💥 There was also a descending trendline within this box that the price recently broke through, triggering strong bullish momentum. The price has now even broken above the 0.21765 level.
✔️ A significant increase in buying volume has entered the market, and with RSI entering the Overbuy zone, this move looks poised to continue even more sharply.
🔔 If this bullish momentum persists, the next targets are 0.26221 and 0.38402. If you already have an open position, these levels could be suitable for partial profit-taking.
🛒 If you're looking to buy this coin in spot, the breakout and confirmation above 0.21765 is a decent entry. However, the current stop-loss range is quite wide, so reaching a good risk-to-reward ratio might take longer with this trigger.
📈 The next potential spot triggers are 0.26221 and 0.38402. A breakout above 0.38402 would likely signal the start of a new major bullish leg.
📝 Final Thoughts
This analysis reflects our opinions and is not financial advice.
Share your thoughts in the comments, and don’t forget to share this analysis with your friends! ❤️

SUI - Channel Structure
SUI just printed a powerful +12.95% daily move, bouncing cleanly from the mid-range of its long-term ascending channel. This structure has been respected since mid-2023, guiding both impulse legs and corrective phases with precision.
Now trading around $3.47, the next logical magnet is the channel top near $5, especially if momentum persists and market sentiment remains risk-on.
Technical Structure:
Bullish trend within a well-defined ascending channel
Clean reaction from dynamic support (midline)
Clear higher low + breakout structure in play
Upside Target:
$5 (channel resistance)
As long as SUI holds above the rising midline (~$2.80 area), this setup remains valid for trend continuation toward the upper range.
📌 Risk Management:
Break below the midline flips the bias short-term. Until then, trend = friend.

TradeCityPro | NEAR Faces Resistance in Lower Range Zone👋 Welcome to TradeCity Pro!
In this analysis, I’m going to review NEAR, one of the AI and Layer1 crypto projects, currently ranked 35 on CoinMarketCap with a market cap of 2.77 billion dollars.
📅 Daily Timeframe
On the daily chart, NEAR has formed a large ranging box between the 1.884 and 3.548 levels and is currently positioned in the lower half of that range.
✔️ After hitting the lower boundary, the price has formed a trigger around the 2.279 level and is now fluctuating below it.
✨ A breakout above this level could give us a long entry. However, the downside is that volume is decreasing and diverging from price. If this volume drop continues, the likelihood of the range breaking to the downside increases.
📊 If volume starts to rise, considering that the RSI is stabilizing above the 50 zone, the probability of a bullish scenario becomes much stronger.
💥 The main resistance above the current price is at 3.548, which I’ve marked as a zone. In my opinion, breaking this level would be the main trigger for a spot buy, and I personally plan to wait for this level to break before buying spot.
🔔 If the price gets rejected from the 2.279 level and bearish momentum enters the market, a break below 1.884 would be a strong short trigger and could signal the start of a new bearish leg and continuation of the previous downtrend.
📝 Final Thoughts
This analysis reflects our opinions and is not financial advice.
Share your thoughts in the comments, and don’t forget to share this analysis with your friends! ❤️

TradeCityPro | AVAX Holds Key Support in Sideways Structure👋 Welcome to TradeCity Pro!
In this analysis, I want to review the AVAX coin for you. It’s another Layer1 and RWA project whose coin has a market cap of 7.48 billion dollars and ranks 16th on CoinMarketCap.
📅 Daily Timeframe
On the 1-day timeframe, as you can see, the price is sitting on a very important and strong support at the 16.46 zone, which I’ve marked as a range for you.
🔍 This range is where buyer makers are heavily present, and the price has touched it three times so far and has been supported each time. This shows the high strength of this zone.
✨ Currently, after being supported from this zone, the price has reached the 18.77 level and is fluctuating below this level. Volume is also gradually decreasing, and we have to see what happens next.
📊 If the volume keeps decreasing like this, the price will probably continue ranging between 16.46 and 18.77 until volume enters the market. But if strong buying or selling volume enters, the price can make a move and exit this range.
✔️ If buying volume enters and the price wants to move upward, we can enter a long position with a break of 18.77 and even buy in spot. A confirmation for this position could be the RSI breaking above the 50 level.
🛒 I personally consider this trigger suitable for a long position, but for spot I suggest waiting for a break of 25.78. More important than that is Bitcoin dominance, and in my opinion, as long as the long-term trend of Bitcoin dominance is bullish, buying altcoins is not logical and we have to wait until dominance changes trend.
📉 If the price wants to move downward and selling volume enters the market, the break of this same support range would be the best trigger. With a break of 16.46, we can enter a short position, and if you already bought this coin in spot, you can activate your stop-loss as well.
💥 A momentum confirmation for this position would be the RSI breaking below the 30 level and the oscillator entering the Oversell zone.
📝 Final Thoughts
This analysis reflects our opinions and is not financial advice.
Share your thoughts in the comments, and don’t forget to share this analysis with your friends! ❤️

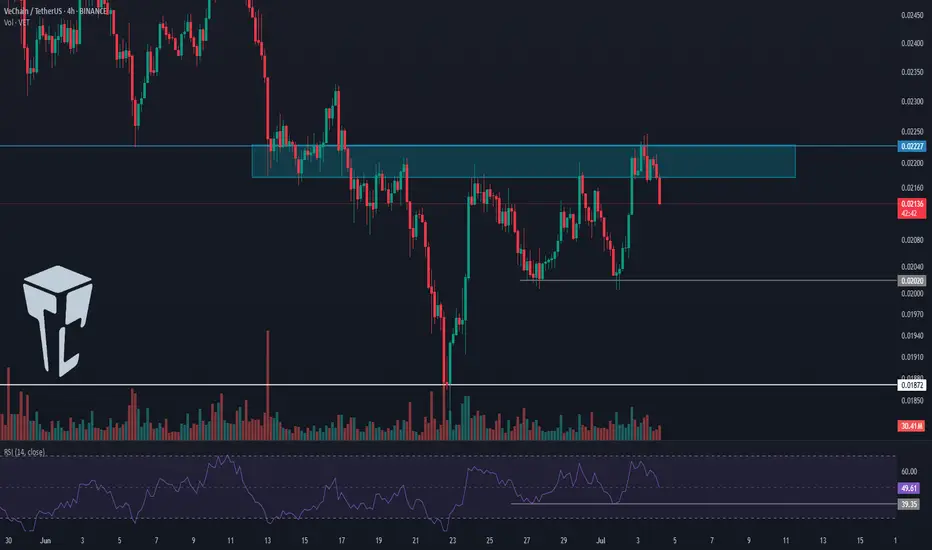
TradeCityPro | VET Battles Key Resistance Amid Buyer Momentum👋 Welcome to TradeCity Pro!
In this analysis, I’m going to review the VET coin for you. VET is a Layer1 and RWA project with a market cap of 1.84 billion dollars, currently ranked 44 on CoinMarketCap.
⏳ 4-Hour Timeframe
On the 4-hour timeframe, as you can see, this coin experienced a downtrend and eventually reached the 0.01872 bottom. It then received support from that level and began a bullish move.
✨ Right now, a significant resistance is located at 0.02227, which I’ve marked on the chart as a supply zone. So far, it seems the price has been rejected from this area.
🔍 Price has attempted to break this zone three times already. Each time, although it managed to penetrate further, it still failed to break through and got rejected.
💥 With each rejection, the RSI oscillator has also been rejected from near the 70 level and moved downward. If, in future attempts, the RSI enters the Overbuy area, the probability of breaking 0.02227 will significantly increase.
📊 Currently, market volume favors buyers. The buying volume on green candles has increased noticeably. Meanwhile, during the rejection from the resistance zone, the selling volume was very low, which signals strong buyer control.
⚡️ If the downtrend continues and price fails to form a higher low above 0.02020, we can enter a short position upon the break of 0.02020. A break of 39.35 on the RSI would be a solid momentum confirmation for this setup.
📉 The main short position can be opened upon the break of 0.01872. This would confirm the continuation of the downtrend and could lead to a sharp downward move.
📝 Final Thoughts
This analysis reflects our opinions and is not financial advice.
Share your thoughts in the comments, and don’t forget to share this analysis with your friends! ❤️
Breakout Watch: NEAR Approaching Moment of Truth If you want, ICBOE:NEAR is currently testing the breakout zone but is still holding below the key trendline.
It’s a critical spot — if NEAR manages to break and close above this trendline, it could unlock further upside. For now, the trendline remains intact, so patience is needed here.
Watching closely to see if the breakout gets confirmed or if we see another rejection.
DYOR, NFA

TradeCityPro | KAS Ranges Near Top with Bullish Momentum Rising👋 Welcome to TradeCity Pro!
In this analysis, I want to review the coin KAS for you. It’s one of the Layer One projects, and its token currently ranks 40 on CoinMarketCap with a market cap of 2.35 billion dollars.
⏳ 4-Hour Timeframe
On the four hour timeframe, the price is moving inside a range box between the levels of 0.082767 (which I’ve also marked as a zone) and 0.091126, and is currently near the top of the box.
✔️ Considering that other coins and market indexes like Bitcoin and Total2 are showing bullish confirmations, the activation of this coin’s long trigger could initiate a strong upward move.
📊 The volume increase shown on the chart is another reason why the probability of breaking the top of the box has gone up.
📈 For a long position, we can enter with the trigger at 0.091126. If the breakout candle comes with strong volume, we’ll have volume confirmation as well, and momentum confirmation will come from RSI breaking above 62.96.
✨ Given the confirmations, the likelihood of this trigger activating seems high, and we can target a move to 0.102417 or even 0.126033.
🛒 For a spot buy of this coin, it’s better to wait for a break above 0.126033. We can open a futures position at the 0.091126 trigger aiming for 0.126033, and once the price reaches 0.126033, we can use the profits from the futures trade to enter the spot market.
🔽 As for bearish movement and a short trigger, the first sign would be rejection from the 0.091126 area. The main trend reversal trigger will be the breakdown of the support zone.
📝 Final Thoughts
This analysis reflects our opinions and is not financial advice.
Share your thoughts in the comments, and don’t forget to share this analysis with your friends! ❤️

TradeCityPro | NEAR: Key Support Battle in Layer 1 AI Protocol👋 Welcome to TradeCity Pro!
In this analysis, I’m going to review the NEAR coin for you — one of the prominent AI-focused and Layer 1 protocols that has gained significant attention in recent years.
🔍 This project’s coin, with the ticker NEAR, currently holds a market cap of $2.94 billion, ranking 34th on CoinMarketCap.
📅 Daily Timeframe
As you can see in the daily timeframe, there is a very strong support level at 2.239, which has been tested multiple times. The price has once again reached this zone.
✨ If this level breaks, the price could drop toward lower supports such as 1.694. Therefore, a break below 2.239 would be a valid trigger for a short position.
💫 The trendline drawn on the chart is also a significant level. If 2.239 is broken, price could potentially react to this trendline as well.
💥 If price holds this support and attempts a bullish move, we can open a long position upon breaking 2.653.
📈 The main long triggers, including potential spot buying, are at 3.355 and 3.548. If these levels are broken, NEAR could begin a strong uptrend toward targets at 4.726 and 7.998.
📊 Currently, market volume is ranging — buyers and sellers are evenly matched. We need to wait and see which side gains dominance to follow the momentum.
✔️ On the RSI oscillator, entering the Oversold zone would confirm a short setup, while breaking above the 50 RSI level would confirm a long setup.
📝 Final Thoughts
This analysis reflects our opinions and is not financial advice.
Share your thoughts in the comments, and don’t forget to share this analysis with your friends! ❤️

TradeCityPro | ALGO: Bearish Pressure Builds Near Key Support👋 Welcome to TradeCity Pro!
In this analysis, I’m going to review the ALGO coin for you. The Algorand project is one of the Layer 1 and RWA projects.
⚡️ The coin, with the ticker ALGO, currently holds a market cap of $1.63 billion and ranks 53rd on CoinMarketCap.
⏳ 4-Hour Timeframe
As you can see in the 4-hour timeframe, after the price reached the 0.2505 resistance level, a bearish phase began, and with the breakdown of the 0.2123 level, the first bearish leg extended down to 0.1912.
✔️ After this drop, the price retraced up to the 0.382 Fibonacci level and now has returned to the 0.1912 zone. Given the strong bearish momentum in the market, the probability of breaking this level is quite high.
✨ If 0.1912 is broken, the extension wave could begin. According to Fibonacci projections, the targets for this position are 0.1780, 0.1732, and 0.1602.
💥 An entry of RSI into the Oversold zone would serve as a very strong momentum confirmation for this position. If that happens, the price may reach the 0.1602 target.
📊 Volume also plays a key role. Currently, the selling volume isn’t very strong, which might result in a fake breakout of 0.1912. I suggest waiting to see whether sell volume increases, because without volume, price movement is unlikely.
📈 For a long position, the first trigger we currently have is the 0.2023 level, which is a significant high and overlaps with the 0.382 Fibonacci retracement level. Breaking this level could resume the long-term bullish trend.
💫 The momentum confirmation for a long position would be the RSI breaking above the 50 level. A breakout here could kick off a bullish trend in the higher timeframes.
📝 Final Thoughts
This analysis reflects our opinions and is not financial advice.
Share your thoughts in the comments, and don’t forget to share this analysis with your friends! ❤️

TradeCityPro | AVAX: Watching Key Resistance in RWA Uptrend👋 Welcome to TradeCity Pro!
In this analysis, I’ll be reviewing the AVAX coin — one of the popular RWA projects in crypto with a high market cap.
🔍 This coin currently has a market cap of $9.94 billion and ranks 14th on CoinMarketCap.
⏳ 4-Hour Timeframe
As shown on the 4-hour chart, there’s a clear ascending trendline that has been tested several times. There was also a fake breakout below the trendline, and now price is reacting to it once again.
⚡️ A resistance level has formed at 23.90, which the price has reacted to. Given the recent bounce off the trendline, the probability of breaking 23.90 has increased.
✔️ A break above 23.90 offers a potential long entry, though this isn’t the main long trigger. The target for this move would be 25.78. The main long position should be considered after a breakout above 25.78.
💥 The 25.78 zone is a key resistance level that marked the top of previous bullish legs, so breaking it could lead to a strong bullish trend.
🔽 On the flip side, if the price prints a lower high below 25.78 and moves back toward the trendline, the probability of breaking the trendline increases.
✨ If the trendline breaks, the confirmation trigger would be 22.10. A break below 22.10 opens a short setup, with the next support level located at 19.23.
📊 Currently, market volume is favoring the buyers. With renewed buying volume off the trendline, if this momentum continues, the bullish scenario becomes more likely.
📝 Final Thoughts
This analysis reflects our opinions and is not financial advice.
Share your thoughts in the comments, and don’t forget to share this analysis with your friends! ❤️

TradeCityPro | CORE: Watching Trendline and RSI for Next Move👋 Welcome to TradeCity Pro!
In this analysis, I’ll be reviewing the CORE token. This project is one of the DeFi infrastructure developers for Bitcoin and also runs its own Layer 1 blockchain.
💥 The token currently holds a market cap of $826 million and is ranked 86th on CoinMarketCap.
⏳ 4-Hour Timeframe
As seen on the 4-hour chart, CORE is in an uptrend supported by an ascending trendline, with price consistently moving higher along it.
✅ In the last bullish leg, price only managed to retest the previous high around 0.8727 and is now undergoing a pullback.
⚡️ This shows signs of weakness in the bullish momentum. If the price fails to close above 0.8727 and drops back to the trendline, the risk of a trendline breakdown increases.
🔍 There’s also the potential for price to form equal highs and higher lows, forming an ascending triangle, which would favor a bullish breakout scenario.
🔑 Watch the RSI oscillator closely. Historically, every time RSI reached the 70 zone during a bullish move, the trend topped out and reversed. So if RSI manages to break above 70 this time, it could trigger a much stronger bullish leg.
📈 For a long position, potential entries include a breakout above 0.8727 or a bullish bounce off the ascending trendline.
🔽 For a short position, the first trigger would be a break of the trendline and activation of the 0.7560 support zone.
📝 Final Thoughts
This analysis reflects our opinions and is not financial advice.
Share your thoughts in the comments, and don’t forget to share this analysis with your friends! ❤️

#SUIUSDT #1D (Bitget Futures) Rising wedge near breakdownSui got drained from Cetus LP and is about to print a spinning top candle on daily.
A retracement down towards 100EMA / descending trendline support seems likely.
⚡️⚡️ #SUI/USDT ⚡️⚡️
Exchanges: Bitget Futures
Signal Type: Regular (Short)
Leverage: Isolated (4.0X)
Amount: 4.8%
Current Price:
3.9642
Entry Zone:
3.9947 - 4.2035
Take-Profit Targets:
1) 3.5901
1) 3.2068
1) 2.8235
Stop Targets:
1) 4.5250
Published By: @Zblaba
CRYPTOCAP:SUI BITGET:SUIUSDT.P #1D #SuiNetwork #L2 sui.io
Risk/Reward= 1:1.2 | 1:2.1 | 1:3.0
Expected Profit= +49.7% | +87.1% | +124.5%
Possible Loss= -41.6%
Estimated Gaintime= 1-2 months

TradeCityPro | S: Trendline Break Signals Key Support Retest👋 Welcome to TradeCity Pro!
In this analysis, I’m going to review the S coin—one of the Layer 1 coins for the Sonic network.
💥 This coin currently holds a market cap of $1.43 billion and ranks 58th on CoinMarketCap.
⏳ 1-Hour Timeframe
On the 4-hour chart, as you can see, there’s a large range box between the 0.3939 and 0.6147 levels where price has been moving sideways.
🔍 A key support zone also exists between 0.45 and 0.46, which has received strong bullish reactions, pushing the price upward toward the 0.6147 top via a trendline.
✔️ Currently, this trendline has been broken, and a new support level has formed at 0.4888, which has been tested several times.
✨ If this 0.4888 level breaks, a short position targeting the 0.45 zone and 0.3939 becomes viable.
📈 For a long position, the first trigger is the 0.5266 level. A breakout here would confirm support at 0.4888 and open the path toward the 0.6147 resistance.
🎲 The RSI oscillator is hovering near the 50 level. A sustained move above this could increase the likelihood of the bullish scenario playing out.
📝 Final Thoughts
This analysis reflects our opinions and is not financial advice.
Share your thoughts in the comments, and don’t forget to share this analysis with your friends! ❤️

SEI breaks the downtrend targets 30cThe SEI network is currently displaying positive price movement after recently breaking out of a downward trend channel that had been in place since the peak on December 5th. On the daily chart, it has been trading sideways within the upper channel, indicating a potential retest of that breakout. However, the momentum isn't particularly strong, especially since Ethereum, the frontrunner in the altcoin resurgence, isn't exhibiting explosive upward movement either.
Should the situation shift and Ethereum regain its leading position, I believe that many struggling smart contract platforms, which have seen their prices plummet by over 80%, could also experience a robust recovery.
If Ethereum manages to climb back into the $2,000+ range, I anticipate that SEI will reach its target on the chart, which is approximately 30 cents.

SOL - Strong Structure Rejected!Hello TradingView Family / Fellow Traders! This is Richard, also known as theSignalyst.
The picture says it all!
📈As long as the $134 structure marked in red holds, I will be expecting a bullish continuation towards the $180 resistance level.
📚 Reminder:
Always stick to your trading plan — entry, risk management, and trade management are key.
Good luck, and happy trading!
All Strategies Are Good, If Managed Properly!
~Rich

Bitcoin Total Market Cap Update – Strategic Scenarios AheadAs of May 8, 2025, the total cryptocurrency market capitalization stands at approximately \$3.012 trillion, reflecting a 2.17% increase from the previous day . Bitcoin's market cap is around \$1.962 trillion, with a current price of \$98,798.11 .
Given these figures, we are considering the following potential scenarios for the crypto market:
---
1. Break Above \$3T and Hold ✅ (30% Probability)
* The market breaks through the \$3 trillion level.
* Retests it as support.
* Continues the bullish momentum from there.
---
2. Rejection and Consolidation 🔁 (50% Probability)
* Price gets rejected at \$3T.
* Moves sideways between \$2.8T and \$3T.
* Eventually breaks out and retests \$3T as support before resuming upward.
---
3. Bearish Turn Below \$2.8T 🔻 (20% Probability)
* Rejection at \$3T.
* Market loses \$2.8T support.
* Retests \$2.8T as resistance, followed by further downside pressure.
---
Key Levels to Watch
* \$2.8T and \$3T are critical zones. Movements between these levels indicate uncertainty and should be approached with caution.
---
Our Perspective
A retest of \$3T as support could present the strongest buying opportunity of this cycle. We urge everyone to stay alert, analyze carefully, and prepare accordingly.
Golden Cross is looming — remain focused and disciplined.
---
Stay updated and connected:
With best regards,
Team ProCryptoEdge
Educate. Empower. Elevate.

TradeCityPro | SUI: Bullish Push Faces Key Resistance Test👋 Welcome to TradeCity Pro!
In this analysis, I want to review the SUI coin for you. It's one of the DeFi layer-1 projects that was highly hyped in 2024 and has recently gained renewed attention due to some news from the project.
🔍 This project's coin, with the symbol SUI, has reached a market cap of $11.3 billion, ranking it 11th on CoinMarketCap.
📅 Daily Timeframe
As you can see in the daily timeframe, since the last analysis I shared in this channel, the price has rebounded from the support zone I highlighted and, after breaking the trendline, made a bullish leg up to 3.6402.
📊 A significant amount of buying volume has entered the market, and the RSI has entered Overbuy territory. These two factors drove the bullish move, and the 3.6402 resistance is a key level that has temporarily held off further price increases.
✔️ Currently, we’re seeing a few corrective candles that caused the price to reject from this resistance, but it's holding up well and still looks poised to move back toward this level.
🛒 For spot buying, if the price moves back toward this area, you can enter a position on a break of 3.6402. The next trigger is the break of 4.0866, and the main resistance ahead is 5.2689.
🔽 If a correction occurs, support levels are 2.7830 and 2.2495. If price retraces, these can serve either as short targets or long entry zones depending on the price reaction.
📉 Confirmation of trend reversal would come if the price fails to make a higher high above 3.6402 and breaks the current low. After that, we can consider opening a short position.
📝 Final Thoughts
This analysis reflects our opinions and is not financial advice.
Share your thoughts in the comments, and don’t forget to share this analysis with your friends! ❤️
