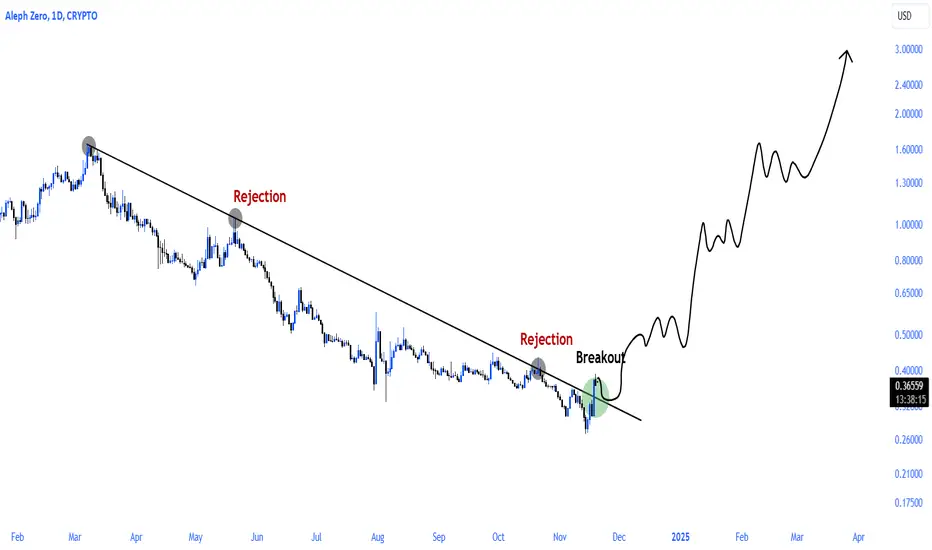
$AZERO$Azero is the L1 project with the lowest value in terms of potential!
#Azero 260-day falling trend breakout has been completed. I think a sharp upward rise wave will begin after the successful retest.
Layer1
TradeCityPro | STX : A Healthy Uptrend with Promising Momentum👋 Welcome to TradeCity Pro!
In this analysis, I’ll review STX, the native token of the Stacks project, a prominent Layer 1 blockchain. The analysis focuses on the weekly timeframe.
⏳ Weekly Timeframe: A Healthy Uptrend
On the weekly chart, a strong uptrend has been in place since reaching the low of 0.201. Thus far, two bullish legs have propelled the price to 3.737, with the price currently testing the resistance at 2.471.
📊 Buying volume continues to increase, showing robust support for the ongoing trend with no signs of weakness. A visible ascending trendline has interacted with the price three times, further reinforcing the bullish momentum.
🔼 The 37.65 support level on the RSI is critical. As long as the RSI remains above this level, the probability of a bullish scenario outweighs the bearish one.
📈 If the price breaks above 3.737, it could move toward new all-time highs. In the event of such a breakout, I will update the analysis to include new targets.
🔽 Bearish Scenario
If the ascending trendline and the 1.264 support level are broken, the possibility of a trend reversal arises. In this case, the first major support level to watch would be 0.442.
📝 Final Thoughts
This analysis reflects our opinions and is not financial advice.
Share your thoughts in the comments, and don’t forget to share this analysis with your friends! ❤️

NEAR/USDT: READY FOR BIG MOVE!!🌟 Hey everyone! 👋
If you’re finding value in this analysis, don’t forget to smash that 👍 and follow for more high-value trade setups! 💹
🔍 Technical Overview:
NEAR Protocol (NEAR) is showcasing strong bullish momentum! 🚀 It has broken out from a bull flag-like structure, with a successful retest confirming the breakout. The 100MA support is holding firm, signaling a potentially massive rally ahead. This could be the perfect time to accumulate some and add more on dips within the given range!
✅ Buy Zone: $6 - $7
🎯 Targets:
Target 1: $10
Target 2: $22
Target 3: $38
Target 4: $48
Target 5: $62
🛡️ Stop Loss (SL): $4.78
💡 Why NEAR Protocol?
NEAR Protocol is a next-gen Layer 1 blockchain designed for scalability, speed, and developer-friendly applications. It’s built on Nightshade sharding technology, enabling super-fast transactions and low costs.
Key fundamentals driving NEAR’s bullish potential:
1️⃣ Growing Ecosystem – NEAR is home to many dApps, DeFi projects, and NFT platforms.
2️⃣ Backed by Big Names – Supported by renowned investors like a16z and Pantera Capital.
3️⃣ Interoperability – Seamless cross-chain communication with Aurora (ETH compatibility).
4️⃣ Mass Adoption – Rapidly expanding user base and developer activity.
With these fundamentals aligning with strong technicals, NEAR is poised for an explosive rally!
💬 What’s your take on NEAR’s price action? Are you seeing the same breakout potential? Drop your thoughts and analysis in the comments below, and let’s profit together on this exciting trade! 🚀

TradeCityPro | ATOM : Momentum Shifts and Key Resistance Levels👋 Welcome toTradeCity Pro!
In this analysis, I will review the ATOM chart. Cosmos is a DeFi project on the Osmosis network and one of its main platforms.
⏳ Weekly Timeframe: Buying Volume Enters the Market
In the weekly timeframe, following multiple declines and significant bearish momentum, the price reached the support level at 3.789, where buying volume entered the market, resulting in a notable price recovery. The market's momentum in the low wave cycle is bullish, and no signs of weakness are observed in this timeframe.
🔼 After the price returned above the 6.552 level, the next resistance is at 8.799, which, so far, has acted as a barrier to further upward movement in the current weekly candle. If this resistance is broken, the next significant level is 15.492, a robust area that will be challenging for the price to surpass.
✨ If the RSI oscillator enter the overbought zone, it may introduce more bullish momentum and market FOMO, potentially driving a price pump.
⏳ Daily Timeframe: Beginning of a Correction?
On the daily timeframe, after substantial buying volume pushed the price to the resistance at 8.779, the volume has started to decline, and momentum has slightly weakened. However, further upward movement remains possible.
⚡️ The RSI oscillator found support near the 70 level and is re-entering the overbought zone. Simultaneously, the price is retesting the 8.799 resistance, and with renewed bullish momentum, this level might be broken.
🧩 On the other hand, the SMA99 has distanced significantly from the price, and given the price's tendency to revert to the mean, a correction is plausible. If buying volume fails to re-enter the market, the likelihood of a correction increases.
🔽 In case of a correction, the first support level is 6.552. If the 8.799 resistance is broken, the next targets will be 14.37 and 16.767.
📝 Final Thoughts
This analysis reflects our opinions and is not financial advice.
Share your thoughts in the comments, and don’t forget to share this analysis with your friends! ❤️

ETHBTC Bottoming - Maybe? Hitting a few possible resistance points here, could ETH be finally bottoming against BTC? Only time will tell.
Some good capitulation but not heaps of volume.
Bullish divergence on RSI which is good.
But it could go lower, lets hope not but you can see the next support right there down lower

$AZERO UPDATE$AZERO up 80% after the bottom confirmation at $0.27 Fibonacci 1.618 level, but this is just the beginning for #Alephzero and the harshest movements have not yet occurred!

TradeCityPro | FTM : Preparing for a Potential Rally👋 Welcome to TradeCity Pro!
In this analysis, I will be reviewing the FTM chart. This project is a Layer 1 blockchain, which has recently gained significant attention and buying volume due to its new airdrop initiative.
📅 Weekly Timeframe: Preparing for Another Rally
In this timeframe, after several months of base formation around $0.1793, the price has now broken through $0.5535, with the next resistance at $1.0785. If the price successfully stabilizes above this resistance, the probability of reaching the ATH at $3.292 increases significantly.
📈 If the RSI oscillator breaks through 62.1, bullish momentum will enter the market, increasing the chances of breaking the resistance and pushing toward the ATH. However, the most crucial factor right now is volume. So far, the main buying volumes haven’t entered the market. Until this happens, the likelihood of breaking the resistance remains low.
📅 Daily Timeframe: Close to Breaking Resistance
On the daily timeframe, after breaking $0.5384, the price has pulled back toward this level and the SMA 99. It has now reached $0.8401, with a significant support level at $0.613.
🔼 The first long trigger in this timeframe is $0.8401, with a target of $1.1448 if this level is broken. However, as mentioned in the weekly analysis, volume remains low, and until larger volumes enter the market, the moves in the market cannot be deemed reliable.
🔍 If the price is rejected at $0.8401, it may pull back again toward the SMA 99 or even revisit $0.5384.
🔽 Currently, there isn’t a suitable short trigger in this timeframe. Personally, I will wait for lower highs and lower lows before considering short positions.
👑 FTM/BTC Analysis
On the daily timeframe for the FTM/BTC pair, there’s a long-term range between 0.00000676 and 0.00001129, with price once moving to the high at 0.00001794 and another time to the low at 0.00000541. Currently, the price is battling resistance at 0.00000817, which is within this range.
🚀 Breaking this resistance, coinciding with $0.8401 on the USD pair, would be a solid confirmation for entering spot buys or futures positions. The next resistances are at 0.00000991 and 0.00001129.
📝 Final Thoughts
This analysis reflects our opinions and is not financial advice.
Share your thoughts in the comments, and don’t forget to share this analysis with your friends! ❤️

Shitty fuds won't stop $Trias Now that the war of bots with the Kucoin (ST) tag and the subsequent shitty fuds that caused an indefinite period are over, the sharp rise wave should begin.

I'm bullish on Sei.. Modern layer 1..For the upcoming period i'm very bullish on SEI.
From what i've researched it's a very fast and modern layer 1.
I started to see high volumes on large and reliable exchanges like Binance, Upbit, Coinbase, Bybit etc.
I have indicated the possible targets in the chart.
* What i share here is not an investment advice. Please do your own research before investing in any digital asset.
* Never take my personal opinions as investment advice, you may lose all your money.

ADA Beautiful Range. Lower First!?Currently rejecting from the local POC. IMO it would make sense to test the untested daily level, VAL, GP below before attempting to move higher into September highs, untested monthly level and channel highs. #Cardano
Calculate Your Risk/Reward so you don't lose more than 1% of your account per trade.
Every day the charts provide new information. You have to adjust or get REKT.
Love it or hate it, hit that thumbs up and share your thoughts below!
This is not financial advice. This is for educational purposes only.

Scroll Governance Token ($SCR) Debut at $212 Million Market CapScroll, a prominent Layer-2 scaling network for Ethereum, recently launched its highly anticipated native governance token, $SCR. The token debuted with a market capitalization of $212 million, pricing at around $1.40 before facing a downward trend to its current value of $1.10, reflecting the challenges faced in its initial release. With a fully diluted valuation (FDV) of $1.1 billion, Scroll is positioning TSX:SCR as a key component of its governance and utility framework as the network progresses towards full decentralization.
However, the token's journey has been far from smooth, plagued by negative sentiment and user concerns over token allocation. Despite this, TSX:SCR 's long-term potential, coupled with its essential role in Scroll’s ecosystem, makes it an intriguing asset for traders and investors alike.
Overview
1. Market Cap & Circulating Supply
The TSX:SCR token launched with a market cap of $212 million and a circulating supply of 190 million tokens. While the token initially started trading at $1.40, it saw a swift correction to $1.10 within the first few hours. The correction, while expected in volatile market conditions, was partly driven by criticism over the token allocation process.
2. Airdrop Concerns & Team Transparency:
A significant factor that influenced early price movements was Scroll's decision to give Binance 5.5% of the total token supply for its Launchpool users. This allocation raised concerns among early adopters who felt the token distribution lacked fairness. Moreover, Scroll’s users voiced frustration over rumors that team members were eligible for airdrops, but these claims were swiftly refuted by core contributors.
Scroll ( TSX:SCR ) took a strong stance against these allegations, emphasizing that no co-founders or team members would receive any portion of the airdrop, aiming to restore trust among the community. Despite these efforts, the negative sentiment lingered as the token price experienced a notable decline of 20%, marking a rough start for $SCR.
3. Trading Volume & Liquidity
Despite its price slump, TSX:SCR saw impressive trading volume, with $189 million traded across all pairs on its first day. The token also accumulated over 500,000 transfers and more than 200,000 holders in just 24 hours, signifying strong market interest. Liquidity remains solid, with over $400,000 positioned within 2% of the spot price on Binance, indicating healthy participation and relatively low slippage for traders.
Technical Analysis:
From a technical perspective, TSX:SCR is currently experiencing a dip, down 12% from its initial trading price. The Relative Strength Index (RSI) sits at 43, which places the token in a neutral territory. This suggests that while there’s some downward pressure, the selling momentum is not overwhelming, and the market could soon stabilize.
One notable pattern in the chart is the appearance of a gap-down formation, which often signals a short-term selling climax. This gap, if not filled quickly, could reverse and provide strong buying opportunities, especially as TSX:SCR approaches key support zones.
The recent price action has created the possibility of a bullish engulfing pattern, hinting at a potential trend reversal. The $1.10 to $1.36 range presents critical pivot points, and any surge beyond $1.36 could propel TSX:SCR toward retesting its previous highs, especially as the token gains more market traction.
In addition, the overall volume profile indicates substantial trading interest, with bullish investors likely stepping in once the selling pressure subsides. Historically, tokens like TSX:SCR tend to see increased demand as they integrate more utility features, and with Scroll’s plans to evolve TSX:SCR into a protocol utility token, the long-term outlook remains optimistic.
What Lies Ahead for Scroll and TSX:SCR ?
The future of TSX:SCR hinges on several key factors:
1. Decentralization & Governance: As Scroll becomes more decentralized, the demand for TSX:SCR as a governance token will likely increase. Its utility in voting on key proposals, network upgrades, and other governance-related activities will add more value over time.
2. Institutional Adoption: As the Scroll network matures, its Layer-2 scalability could attract institutional interest, especially as Ethereum continues to deal with congestion and high transaction fees. This could lead to higher demand for TSX:SCR as institutions seek governance influence within the ecosystem.
3. Technical Strength & Support: The $1.10 support level will be critical in the short term, and if Scroll can maintain or reclaim the $1.36 pivot, it could signal a trend reversal and trigger a rally towards its all-time highs (ATH). The bullish engulfing pattern suggests that buyers may soon regain control, especially if the volume spikes in the coming sessions.
4. Addressing Community Concerns: Lastly, Scroll’s transparency and responsiveness to community concerns will play a vital role in fostering long-term trust. By effectively managing token distribution and ensuring fairness, Scroll can rebuild investor confidence, which will ultimately be reflected in the TSX:SCR price action.
Conclusion
Despite the initial volatility and concerns surrounding its launch, TSX:SCR ’s long-term potential remains intact. The Scroll network’s focus on decentralization and its role in Layer-2 Ethereum scaling solutions could see TSX:SCR emerge as a valuable governance and utility token. While the token faces short-term selling pressure, its fundamental strength, combined with the technical outlook, suggests that the worst may soon be over. A bullish reversal looks likely as TSX:SCR approaches key support levels, and with continued development, Scroll and its native token are well-positioned for future growth.
Investors with a long-term horizon should watch for the $1.36 pivot as a potential entry point, while keeping an eye on market sentiment and upcoming developments within the Scroll ecosystem.

Chainlink Surges 4% on ANZ Collaboration Is $15 the Next Target?Chainlink ( BIST:LINK ), a pioneer in decentralized oracle networks, recently experienced a 4% price surge following a groundbreaking announcement of its collaboration with the Australia and New Zealand Banking Group (ANZ). Together, they aim to revolutionize private transactions for tokenized real-world assets (RWAs) using Chainlink's new CCIP Private Transactions. With the potential to reshape institutional adoption of blockchain, this partnership could be the catalyst for Chainlink's price to reach new heights, with analysts eyeing $15 as the next key target. Let’s dive into the fundamental and technical aspects driving BIST:LINK 's bullish outlook.
The ANZ Partnership and Private Transactions for RWAs
One of the major barriers to institutional blockchain adoption has been the lack of privacy in cross-chain transactions. Financial institutions require complete data confidentiality while interacting with both public and private blockchains to meet stringent regulatory demands, such as Europe’s GDPR (General Data Protection Regulation). Chainlink's latest innovation—CCIP Private Transactions—addresses these concerns, allowing institutions to securely conduct cross-chain transactions without exposing sensitive details.
ANZ Bank, one of the leading financial institutions in Australia and New Zealand, has taken the initiative to pilot Chainlink's privacy solution as part of Singapore’s Project Guardian—an initiative aimed at advancing tokenized RWAs. This move could pave the way for broader institutional blockchain adoption, solving a key privacy issue that has been holding back large-scale institutional use of blockchain technology.
In the words of Chainlink co-founder Sergey Nazarov:
> "The lack of adequate privacy has held back institutional use of blockchain technology. With CCIP Private Transactions, we expect to see more large-scale transactions and an increase in institutional blockchain adoption."
This new feature allows financial institutions like ANZ to maintain full privacy while conducting cross-chain transactions, potentially revolutionizing how RWAs are managed on blockchain platforms. With this powerful use case, Chainlink ( BIST:LINK ) stands at the forefront of enabling institutions to adopt blockchain on a large scale.
Chainlink’s Growing Ecosystem
Beyond private transactions, Chainlink ( BIST:LINK ) continues to strengthen its position in the blockchain space. Recently, the project integrated its Proof of Reserve feature across Solana and Ethereum mainnets to enhance security for wrapped Bitcoin tokens. Chainlink has also partnered with ZKsync and Coinbase’s Base network, pushing further into decentralized finance (DeFi) and cross-chain token transfers. The continued expansion of Chainlink’s ecosystem only adds to the bullish momentum.
Technical Analysis
At the time of writing, BIST:LINK is trading at a 4.53% increase, driven by strong bullish sentiment from the ANZ collaboration and new technological advancements. The Relative Strength Index (RSI) stands at 66, indicating a bullish trend. This is particularly significant as it suggests that BIST:LINK is moving out of its long consolidation phase and gearing up for further gains.
Looking at BIST:LINK 's price chart, the coin is emerging from a falling wedge pattern—a bullish technical formation that often signals a trend reversal and the potential for significant price movements. While the wedge isn’t particularly large, it’s still significant enough to push BIST:LINK towards the $15 mark, especially as we approach the Halloween season, a period historically favorable for altcoin performance.
Currently, BIST:LINK is trading within a bullish price channel, with immediate support found at $7.8. Should prices consolidate around this level, it could set the stage for a further breakout toward the $15 target.
Key Drivers for Chainlink’s Potential Surge to $15
1. Institutional Adoption
The partnership with ANZ and the introduction of CCIP Private Transactions could attract more financial institutions to adopt Chainlink’s privacy solution. Increased institutional adoption is likely to drive demand for BIST:LINK tokens, as they are essential for executing cross-chain transactions and utilizing Chainlink's decentralized oracles.
2. Tokenized Real-World Assets (RWAs)
With the ability to securely tokenize RWAs and conduct private cross-chain transactions, Chainlink has positioned itself at the forefront of a rapidly growing sector. As more institutions seek to tokenize assets such as real estate, bonds, and commodities, the demand for Chainlink’s technology and its native token, BIST:LINK , is expected to rise.
3. Broader Ecosystem Growth
Chainlink's partnerships with major blockchain platforms such as ZKsync and Coinbase’s Base add more utility to $LINK. These collaborations enhance Chainlink's role in cross-chain token transfers, decentralized finance (DeFi), and other blockchain applications, further cementing its dominance in the decentralized oracle space.
4. Bullish Market Sentiment
The overall bullish sentiment in the crypto market, coupled with BIST:LINK 's breakout from a falling wedge pattern, could drive prices higher in the short term. The combination of technical and fundamental factors makes $15 a realistic target for BIST:LINK in the short term.
Conclusion
Chainlink's ( BIST:LINK ) recent price surge following its collaboration with ANZ Bank for private transactions of tokenized RWAs marks a significant milestone for the project. With CCIP Private Transactions, Chainlink ( BIST:LINK ) addresses a key challenge in institutional blockchain adoption—privacy. As institutional use of blockchain technology grows, so too will the demand for Chainlink’s decentralized oracles and its native token.

APT Defies Market Trends A Bullish Breakout or a Prelude to $15?Aptos ( AMEX:APT ) has been catching the attention of traders and analysts alike, with its ecosystem experiencing significant growth, particularly its Total Value Locked (TVL) hitting an all-time high of $916.26M. As Aptos ( AMEX:APT ) continues to surge, many are asking: is AMEX:APT poised for a major rally, and can it reach the $12 mark— or even $15?
Ecosystem on the Rise
The recent spike in TVL highlights Aptos' growing adoption within the decentralized finance (DeFi) space. Aptos ranks 14th in TVL among blockchain ecosystems, with a current value of $604.64 million spread across 48 protocols. Key contributors to this include Aries Markets, Amnis Finance, Thala, and TruStake, all of which have experienced significant TVL growth in the past month.
The rise in TVL signals that developers and users are increasingly choosing Aptos ( AMEX:APT ) for its efficiency and low fees, a key feature of the Aptos Layer-1 blockchain. Aptos' unique use of the Move programming language, originally developed for Facebook’s Diem project, enables faster, more secure transactions. The network's ability to handle 13,000+ transactions per second (TPS) with Block-STM, a system for parallel transaction processing, has attracted partnerships with major players like Microsoft, AWS, and Mastercard. These alliances showcase Aptos' real-world potential for use in sectors like gaming, AI, and NFTs.
Aptos NFT Surge: A Growing Asset Class
Aptos ( AMEX:APT ) is also making waves in the NFT space. Over the last 30 days, Aptos saw 3.9K new collections, with total NFT sales of $24.5M. With 652.5K active wallets, Aptos is rapidly growing its footprint in the NFT marketplace. This surge further solidifies its reputation as a blockchain with wide-ranging applications beyond DeFi, adding momentum to its ongoing rally.
Technical Outlook
From a technical standpoint, Aptos ( AMEX:APT ) is showing strong bullish momentum. Since breaking out of the $9.36 level on October 13, AMEX:APT has continued its upward trend, currently trading at around $10.90. The next significant resistance level sits at $12, and a break above this could trigger a rally toward $15, potentially even testing its all-time high of $19.42—a 75% upside from the current price.
The key technical indicators further support the bullish outlook. The Relative Strength Index (RSI) is at 68, signaling strong buying pressure without being overbought, leaving room for further gains. Moreover, the 50-day Moving Average is nearing a Golden Cross formation, where it crosses above the 200-day Moving Average. This signal typically forecasts the beginning of a strong bullish trend. While the Golden Cross hasn’t fully materialized yet, a push above the $12 pivot could seal the deal, setting Aptos ( AMEX:APT ) up for a major rally.
Risk Factors & Key Support Levels
Despite the strong upward trend, traders should keep an eye on the $10 support level. A breakdown below this price could signal a short-term retreat, with the next significant support lying at $9.75. In contrast, sustained momentum could propel AMEX:APT to $12.50 and beyond, opening the door to its $15 target.
Conclusion
Aptos'—rising TVL, growing NFT sales, and strong partnerships—combined with bullish technical indicators, suggest that a larger rally could be on the horizon. If Aptos ( AMEX:APT ) breaks through its immediate resistance levels, the path to $15 seems not only possible but highly probable. However, as with any cryptocurrency, caution is advised, and traders should watch key support levels closely to gauge whether Aptos ( AMEX:APT ) can maintain its upward trajectory.
With a 40% surge this month alone and a rapidly expanding ecosystem, AMEX:APT is undoubtedly one to watch as it continues to defy broader market trends. Will Aptos hit $15 before the quarter ends? Time will tell, but all signs point toward a bullish future for this rising star in the Layer-1 blockchain space.

ApeCoin ($APE) Skyrockets 118% After ApeChain LaunchApeCoin ( GETTEX:APE ), the native token of the Bored Ape Yacht Club ecosystem, has experienced an explosive price surge, doubling in value over the weekend and hitting $1.5 for the first time since April. This surge is driven by the debut of ApeChain, a Layer-3 network built on Arbitrum Orbit, which has drawn massive attention from investors and traders alike. However, while the fundamentals behind this price movement look strong, technical indicators suggest caution as the token enters overbought territory.
The ApeChain Launch
The launch of ApeChain is the primary driver behind ApeCoin’s impressive 118% rally. ApeChain is a Layer-3 blockchain built on Arbitrum Orbit, and it has introduced several key features that have enhanced its appeal:
- Automatic Yield Mode: ApeChain simplifies passive income for ApeCoin holders, allowing them to earn rewards without the need for manual staking. This innovative feature quickly boosted the user base from 83 to over 3,000 within hours of the launch.
- Cross-Network Bridge: ApeChain also debuted a cross-network bridge that enables seamless transfers between ApeCoin (APE), Wrapped Ethereum (WETH), USD Coin (USDC), Tether (USDT), and Dai (DAI) across the ApeChain, Ethereum, and Arbitrum networks. This expanded utility makes ApeCoin more attractive for cross-chain applications, especially within Yuga Labs’ ecosystem, which includes popular NFT collections like the Bored Ape Yacht Club.
The immediate impact of ApeChain’s debut was a massive spike in trading volume, with Camelot DEX reporting over $5 million in the first three hours. ApeCoin’s on-chain volume followed suit, increasing by nearly 3000% and nearing the $1 billion mark. Such significant gains were echoed in the price, as ApeCoin surged past $1.50, a level it hadn’t touched since April.
Market Response and Investor Sentiment
ApeChain’s launch was met with enthusiasm across the market, with investors excited by the token’s potential utility within the rapidly expanding Yuga Labs ecosystem. ApeCoin ( GETTEX:APE ) also upgraded its smart contract to adopt LayerZero’s Omnichain Fungible Token (OFT) standard, enhancing its interoperability across networks.
This rally was further fueled by the Fear of Missing Out (FOMO) effect, as ApeCoin ( GETTEX:APE ) surpassed a $1 billion market cap, drawing in even more buyers. With ApeChain’s features and the integration of cross-chain transfers, ApeCoin’s potential use cases within the NFT and DeFi spaces have significantly expanded, creating a bullish narrative around the token.
Technical Outlook: Bullish or Overbought?
Despite the strong fundamental narrative, technical indicators suggest caution. At the time of writing, ApeCoin (APE) is trading at $1.55, up 4.48% on the day, and remains well above the recent $1.33 support level. While ApeCoin ( GETTEX:APE ) has successfully broken out of the downward trendline that had constrained its price since June, the Relative Strength Index (RSI) is flashing warning signs.
ApeCoin ( GETTEX:APE ) is in overbought territory, with an RSI above 88, signaling the possibility of a trend reversal or at least a temporary cooling-off period. When an asset is this overbought, profit-taking is likely, leading to increased selling pressure.
ApeCoin ( GETTEX:APE ) is trading above its key moving averages, further cementing its bullish momentum. However, traders should be cautious as a failure to maintain this momentum could trigger a pullback.
If GETTEX:APE can maintain its bullish momentum and stay above the $1.47 resistance level, it could attempt to breach the next psychological barrier of $2.00. However, if a reversal occurs, the first key support level is at $1.33, followed by $1.20.
Potential Risks and Liquidation Levels
While ApeCoin ( GETTEX:APE ) has performed well, there are risks to the upside. CoinGlass data suggests that liquidation levels for ApeCoin are at $1.0178, where a further price rise could lead to the liquidation of $2.59 million in short positions. This could drive the price higher in the short term, but analysts warn that such a move could also create additional selling pressure as traders close out their short positions.
Moreover, the performance of Bitcoin (BTC) could impact ApeCoin’s trajectory. If BTC experiences a correction, the broader market sentiment could turn bearish, putting additional pressure on ApeCoin ( GETTEX:APE ).
Summary
ApeCoin ( GETTEX:APE ) has made significant strides in both its utility and price performance, primarily driven by the ApeChain launch. The introduction of Automatic Yield Mode, cross-network bridges, and LayerZero integration has unlocked new potential for ApeCoin ( GETTEX:APE ) within the broader crypto ecosystem. However, with the RSI indicating overbought conditions, traders should remain cautious as a pullback could be imminent.
In the short term, GETTEX:APE is riding high on bullish momentum, but the looming risks of liquidation and market correction suggest that investors should monitor technical levels closely before making any decisions.

$TRIAS rising loading!$TRIAS, one of the layer1 projects that has been silent for a long time and which I like, forms the right shoulder of the reverse shoulder head and shoulders formation in its weekly view, It will initiate an impressive upward wave with the neckline break that may occur afterwards.
#TRIAS is just one of the #layer1 projects in my bag!

APTOS LOOKS WEAKAptos is at a very crucial level and based on how BTC loooks, I would expect a quick move to the downside before continuation up.
Calculate Your Risk/Reward so you don't lose more than 1% of your account per trade.
Every day the charts provide new information. You have to adjust or get REKT.
Love it or hate it, hit that thumbs up and share your thoughts below!
This is not financial advice. This is for educational purposes only.

AVAX road to $99AVAX appears to be unfolding in a leading diagonal pattern, with a final push in the minor wave 5 still to come. Afterward, we’ll need to watch for a potential retracement in wave 2 of the minor degree.
Once this correction completes, the price could enter a parabolic phase, with powerful bullish candles driving it upward, potentially reaching the $99 target.

Phemex Analysis #27: SUI _ Will It Continue Soar or Sink?After its initial surge, PHEMEX:SUIUSDT.P has been locked in a battle with resistance. Breaking through one hurdle after another, it has now found itself staring at the formidable wall of its all-time high, $2.18. A recent retracement has brought it back to $1.88, leaving investors pondering its next move.
The Road Ahead: A Tale of Three Scenarios
Breaking Free : The most optimistic scenario would see SUI shatter the $2.18 resistance with a surge of volume. This could propel it to even higher heights, igniting a new wave of bullish sentiment.
A Bearish Turn : However, the market has shown signs of weakness. A second one-day high accompanied by a RSI divergence suggests that a bearish reversal might be brewing. If SUI falls below the $1.60 support level with significant volume, a downward spiral could ensue.
The Waiting Game : A more likely scenario is a period of consolidation. SUI might hold the $1.70 support level while investors patiently await a clear breakout signal. Impatience can be a trader's enemy in such situations.
The Path Forward
As SUI navigates this critical juncture, patience and careful analysis are key. While the potential for further gains is undeniable, the risk of a reversal cannot be ignored. Traders must weigh the potential rewards against the risks and make informed decisions.
Tips:
Trade Smarter, Not Harder with Phemex. Benefit from cutting-edge features like multiple watchlists, basket orders, and real-time strategy adjustments. Our unique scaled order system and iceberg order functionality give you a competitive edge.
Disclaimer: This is NOT financial or investment advice. Please conduct your own research (DYOR). Phemex is not responsible, directly or indirectly, for any damage or loss incurred or claimed to be caused by or in association with the use of or reliance on any content, goods, or services mentioned in this article.

Aleo | Layer1 & zero knowledge Aleo is the first platform to provide fully private applications. It accomplishes this by using decentralized systems and zero knowledge cryptography to secure user data online. At its foundation, Aleo delivers unlimited computing power with complete privacy for both users and developers.
Designed as a blockchain that is private by default, open-source, and web-focused, Aleo is seen by its developers as uniquely capable of addressing challenges in blockchain adoption. With Aleo, users can access a wide range of personalized web services while retaining full control over their private data. Aleo operates on its own independent blockchain.
It is available for trading on 4 markets and 7 exchanges, with Gate .io being the most active so far. Coinbase added Aleo to its platform around 24 hours ago under an experimental label. which means the asset is new to the platform, typically exhibiting lower trading volumes and higher volatility.
speaking of coinbase, Aleo recently revealed a partnership with Coinbase to offer custodial services and other initiatives. Aleo’s CEO, Alex Pruden, highlighted Coinbase’s extensive expertise and strong infrastructure as key factors in their decision. The US-based cryptocurrency exchange operates in various sectors, notably working with institutions like the US Department of Justice through its Coinbase Prime service
Aleo has attracted investment from a range of notable venture capital firms and investors.
Some of the key investors in Aleo include:
a16z Andreessen Horowitz, Tiger Global, SoftBank Vision Fund 2,Samsung NEXT, Coinbase Ventures, Galaxy Digital, Polychain Capital..these investors highlight strong backing from both crypto focused and traditional investment firms
we going to bullmarket phase and Aleo can hit higher targets as well

[AVAXUSDT] - bullish patternAvax coin is one of the most important coins in layer1, layer2 tokens
Now it's so close from weekly close ... it's bullish incase of breakout.
The lowest target is at march top (63$)
Best regards cecilion🎯

#EGLDUSDT #1D (ByBit) Big falling wedge breakoutMultiversX (f.k.a. Elrond eGold) looks good for bullish continuation on daily after regaining 50MA support, road to 200MA resistance seems next.
⚡️⚡️ #EGLD/USDT ⚡️⚡️
Exchanges: ByBit USDT
Signal Type: Regular (Long)
Leverage: Isolated (2.0X)
Amount: 5.0%
Current Price:
35.91
Entry Targets:
1) 34.56
Take-Profit Targets:
1) 48.29
Stop Targets:
1) 27.68
Published By: @Zblaba
CRYPTOCAP:EGLD BYBIT:EGLDUSDT.P #1D #Elrond #eGold #MultiversX multiversx.com
Risk/Reward= 1:2.0
Expected Profit= +79.5%
Possible Loss= -39.8%
Estimated Gaintime= 1-2 months

#CRO/USDT 1W (Bybit) inverted Head & Shoulders breakout & retestCronos is pulling back to iHnS neckline support where 20EMA seems to be holding, looks like a great swing opportunity on weekly.
⚡️⚡️ #CRO/USDT ⚡️⚡️
Exchanges: ByBit USDT
Signal Type: Regular (Long)
Leverage: Isolated (1.0X)
Amount: 4.8%
Current Price:
0.12591
Entry Targets:
1) 0.11822
Take-Profit Targets:
1) 0.26475
Stop Targets:
1) 0.0693
Published By: @Zblaba
CRYPTOCAP:CRO #CROUSDT #Cronos #PoS crypto.com
Risk/Reward= 1:3.0
Expected Profit= +123.9%
Possible Loss= -41.4%
Estimated Gaintime= 3-6 months

PULSECHAIN can continue it's recovery...The chart shown is the EVM sidechain of Ethereum --- PLS / by ETH itself
So as this chart produces Green candles.
PLS is earning you more Ethereum
and Red candles mean you are losing ETH value.
For any ratio it is the same deal. i.e BTC/USD. Green equals more USD. RED = less USD.
We have a clear bottom formation yet to truly break out.
But almost there.
As we have seen with other blockchains due to liquidity bonding.
When the Native gas token goes up... the smaller altcoins on the chain start really flying
