Lucid Motors Going Back to $10.00If we take the previous zones with Lucid Motors we can see that we are about to break a critical zone that could potentially bring us first to $13.00 then to $10.00 (SPAC Levels)
LCID has posted poor delivery numbers with numerous expectations. In essence they are burning money at a fast rate, thus quickly diminishing the future expected stock price.
Tread carefully.
Lcid

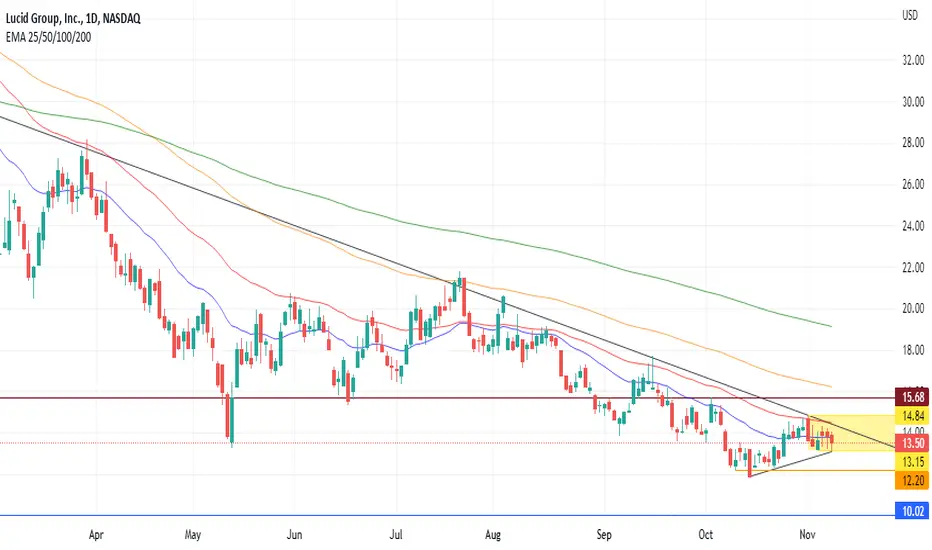
How LCID Share Price May Behave After Disappointed Earnings?Lucid's (LCID) share price has been moving within a narrow price range since the beginning of November (the shaded area in yellow), while LCID share has been trading with the bearish tone in general. Lucid stock is trading on both sides of the 25-day exponential moving average and below the longer-term moving averages in a negative sign on the short and medium term.
Now, on the daily chart, the EMA-50 usually forms a difficult line to break, and LCID share price fails to surpass it and stabilize above it. Accordingly, the reversal of LCID share price from this line, as well as the reversal from the dynamic resistance level or the opening below the yellow price range at $13.15, this may lead us to decline towards the level of $12.20 or below towards the level of $10, levels that the price of Lucid share since 2021.
On the flip side, if LCID share price was able to recover the EMA, it might lead us to the level of 15.68 50 again, while the test of the EMA-100 may be a difficult test for LCID share at the time.
Fundamentally, Lucid recorded a net loss of $530 million for the third quarter of this year, and revenues of $195 million, compared to revenues of $232 million during the corresponding quarter of last year. In addition to recording earnings per share of -40 cents, compared to -43 during the corresponding quarter of last year. While the company stuck to its previous guidance of producing between 6000-7000 cars during the whole year.
LUCID $LCID Long?Lucid analytics:
2 Gaps have been found
- short at $12
- long at $18
Key importance are earning report is coming 11-7-22 Monday. Keep an eye on the report. Nonetheless, we HAVE to close the gap at $18. Keep an eye on the earning report and long to $18

$LCID Earnings/FOMC meeting push -- Potential IHS patternOn the $LCID 4H+ext chart it looks like we've started a potential IHS (Inverted head & shoulders) pattern.
IHS:
Using fibannaci retracement and extension from the high to the low (point 3) we can see a shoulder line forming on the 0.236 fibannaci extension at points 1 & 5. Resistance starts forming at near the 0.236 fibanacci retracement around $13.05 -- which also coincides with some resistance on the volume profile.
At this point it looks like we've started to clear the neck line resistance and we're moving up the fibannaci extension -- as well as the upcoming gap in the volume profile.
Stochastic is over > 60, MACD is making higher highs, and the TTM is firing to the upside.
Considering the macro is looking to potentially do a relief rally leading up to the FOMC meeting on 11/02 and $LCID earnings is on 11/08 we might see a continuation of a channel upwards through this gap in volume.
From Oct 21 close looks like at least another +0.31 pts +2.31% to the upside if momentum continues Mon, Oct 24 as we continue pushing up the gap in the volume profile. Keep in mind the current extension is showing potential resistance/support at the 0.618 line at $13.20. We would need to clear this line with momentum to gap up to the 0.786 line which is where volume profile resistance starts building up.
We have been in a massive bull flag downward channel for quite some time, so expect big resistance as the extension approaches the 1.0 line at $14.02 (+0.71 pts +5.37% upside)-- which happens to coincide with the top line resistance of this bull flag channel.
If we are able to clear this channel and climb up the volume profile, the 4h+ext point of control on the volume profile is up at $15.06, which would be a +1.74 pts +13.09% change to the upside.
Continue monitoring stochsatic and ttm squeeze; break in trend would be a collapse of 0.618 $13.20 support which we could snap the 0.5 quickly and probably land back near the 0.382, and the next major shelf of support on the volume profile around $12.90
PT 1: $13.56 (+2.31%)
PT 2: $14.02 (+5.37)
PT 3 (Max): $15.06 (+13.09%)
Stop limit (break of 0.618 support and snap 0.5 support): $12.90 (-3%)

TESLA - $TSLA - Head & Shoulder - Distribution almost OVER!!!!!When great trees fall, rocks on distant hills shudder, lions hunker down in tall grasses, and even elephants lumber after safety.
Soon Tesla will move from the head & shoulder -- down to its KNEES and that is when we will execute our entry for a long hold.
Sorry Elon, your Ponzi gig is up, you can't produce because you don't have materials and the ones that exist are over priced just like your vehicles.
Your stuck boo, your in a corner, stalemate, king cannot MOVE!
I presented this head & shoulder pattern on $TSLA back in July, before the Right Shoulder was complete and now we are on to the final stages.
I see a bounce occurring before heading lower.
On Monday - US holiday - we should expect lower volume and usually that means a sell off.
This view is on a weekly timeframe. I believe Tesla will wick below the neckline as it has in the past and then squeeze up and fill the GAP to $262.47 (1st target).
If the S&P500 shows strength mid October, prior to OPEX options expiry date, Tesla may keep trekking up the the second target which is in the $290 range before breaking the neckline.
Head and shoulder criteria:
1. Buying volume is diminishing and showed most strength on the left shoulder.
2. The head is much higher then the left shoulder.
3. The neckline fits the description of a proper head and shoulder pattern.
GOOODLUCK TRADERS!

Dark Pool Buy Zones and Sell Short Risk: LCIDDark Pool buy zones tend to provide strong support for stocks running down. If a stock violates the lows of such support, the rebound tends to come quickly, erasing any sell short profits.
This young EV auto manufacturing company is near its IPO price range, which is strong support. The retest of the lows of this bottoming action doesn't show much downside potential for a strong sell short.
There is risk that LCID may gap or run down but then reverse quickly and move back up. Whipsaw reversal candles near Dark Pool buy zones can cause big losses for short sellers at this level.


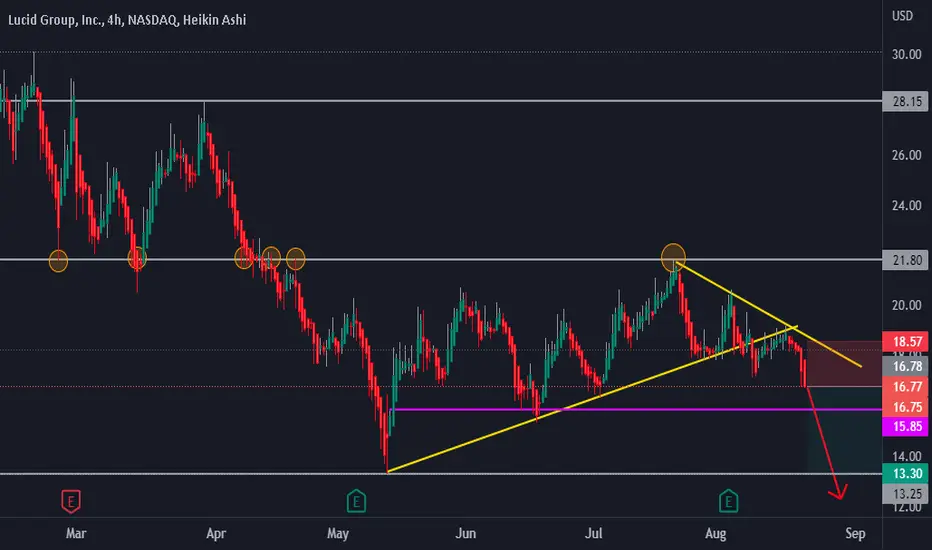
$LCID: Short it to $0...cash burning like there's no tomorrow.I'm shorting $LCID here, nice weekly setup, downside targets are $9-10, and up to $1-2 by December 2nd or sooner. I'm long puts to ride this move, since the stock is hard to borrow.
Worth a shot, you could also consider a portfolio where you long the relatively safe EV names vs shorts in EV startups that are burning cash and unprofitable, which will likely continue to pay off (long $TSLA, $F, $RIVN maybe, vs shorts in $NKLA, $LCID, $ARVL, $FFIE, $FSR, etc)

Lucid LCID Under The Control Of SellersLucid Group (NASDAQ: LCID) stock dropped 6.73% on Tuesday. Lucid has posted last week a nearly 40% miss in revenues alongside a 50% production cut as the company navigated a challenging second quarter.
LCID stock was significantly led by the sellers during Tuesday's session, violating the upward sloping trend line. Now, $16.80 is the key support we should stay above to ensure that yesterday’s bearish setup is over and puts LCID back on a neutral outlook to test $17.90 - $18.40 resistance levels. Otherwise, a confirmed break below $16.80 will then turn LCID decidedly more bearish to test $16.20 - $15.60 support levels. It is worth mentioning that sellers had smashed the major price-based volumes area represented in $18.00 zone and a lower open today below yesterday’s close would confirm further the mentioned area’s violation.

NIO SETUP LONGNYSE:NIO
NIO is thriving despite a faltering Chinese economy.
It has good recent earnings and is competing well with TSLA
and other Chinese EV's like XPEV In the meanwhile it
is making inroads in Europe, especially Scandanavia
They say buy low ( weakness) and sell high ( strength(.
NIO is weak right now as the chart shows. with price
below the cloud now sitting on an advance buy order
support with a low RSI. This is a buying opportunity
As ab aside BIO is said to be seeking a partnership
arrangement with a US Domestic EV company. Should
it find such agreement, it fundamentals likely would
get another uptick.

2X $LCiD 1D Tech. Analysis!LUCID has broken the short-term trendline! From here we are looking for sells/pits only with confirmation.
TSLA SHORT now SETUPNASDAQ:TSLA
TSLA has hit heavy resistance on the 2H chart as it
came up on the heavy sell order zone and the POC of the volume profile
TSLA reacted with Doji candles demonstrating buyer versus seller push and pull dynamics
The RSI is decreasing with a rise in price showing divergence and suggesting
TSLA is about to roll over. The Choppiness Indicator is still moderately elevated
showing buyer. seller action is sideways.
All in all, I forecast that TSLA is set up to short ( or via put options ) with targets
of 790 and 705. For a great reward-to-risk ratio, the stop loss can be $1.00 above
the top of the sell order zone.
Please review and offer your opinion in a comment !
( As an aside take a look at my idea of Sell Tesla Buy Ford using a TSLA / F ratio over
time as the key data for the analysis)

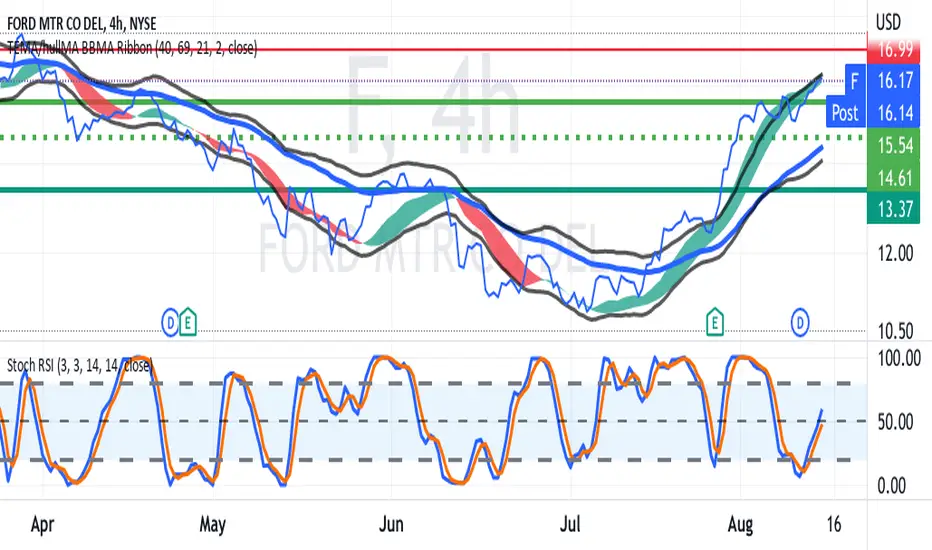
FORD Swing Trade after REVERSAL in JulyNYSE:F
F is trending up while TSLA heads down
US Legislation to support EV purchases with tax credits is helpful
GM's financial troubles are helpful.
Chart shows upgoing BB/EMA channels
and mid-range RSI with recent K/D crossover.
Both suggest a potential swing entry. Depend on unforeseen
changes in the automotive market or the market at large
and a recession versus continued uncertainty, F could
the uptrend for several months also made for the
opportunity to trade call options.
Trade often. Trade well !
LCID Daily Bearflag(Daily)
Beautiful bearflag.
Being in the daily Time frame, i will probably wait until wednesday to see what happens, but a rejection off this bottom trendline, could play long (with time, maybe Octover calls) and try to ride it to the top of the channel,
Downside comes if the flag breaks down, targeting 13.40

OPEN - WAY OVERSOLD - SHARP FALLING WEDGE - ABC CORRETION All,
Open top of watchlist if market turns. Easily could see 17-19 range + IV spikes would be a solid return. Then it will probably vounce down again fade off then go back to mid 20s would be my guess but intial shot here retest of 19ish would be worth watching.

COMPOSITE INDEX Electric Vehicle Stocks TRENDING BEARISH In this daily chart, I made a composite index of electric vehicle stocks using
an approximate formula weighed by stock prices but not market cap.
( ( $NIO + $LCID + $RIDE + $NKLA +$WKHS) x 50 ) + $TSLA
This serves as an approximate normalization adjustment of the varying
stock prices in the collection of stocks.
I did this to later check to see if there is any effect of new legislation
impacting federal tax credits for electric vehicle adoption as a catalyst
for price action.
So far YTD, the composite at large has fallen 18.5% varying from
TSLA is down 6% and LCID as an example of others is down 36%
The composite will be a quick and easy way to see if the composite
and so the market cap of the underlying stocks inflects its downtrend
responsive to the federal legislation catalyst.

Next Earning...?!How much do you expect it to be at the next E event? No where above $30!
Uber has strong tendency in moving downward; despite CEO's plan "focusing on profitability", they are loosing customers, and drivers are leaving them.
NOT REALLY recommended for long term view.


lucid playing nicely rising wedgesits coming to down line of wedges, can hit $17-$18, lets see
if hit $17-$18 range then we can get entry, that time stop loss should be little down of low line

Price Moving Into Resistance But Still Looking Bullish!Hello Traders & Spectators,
LCID has fallen a lot in the past few weeks like everything else but has found a temporary bottom and is now looking to move higher. It is now at a major resistance that it hasn't been able to pass previously but since this resistance has been tapped so many times, that means it is getting weaker. A relief pump seems to be unfolding and ii can see prices pump to the dashed lines above. What do you think?
Love it or hate it, hit that thumbs up and share your thoughts below!
Don't trade with what you're not willing to lose. Safe Trading, Calculate Your Risk/Reward & Collect!
This is not financial advice. This is for educational purposes only.

update after it reached the SL ,gl hopefully a double ;Pthe stock need time ..
so be patient and watch for the 3 boxes it should guide you .

LCID group end of the correction?we might have finished a flat correction
keep an eye on this
I can not talk with confident unless we break the wave 4 of the previous degree
