SPY - RIGHT ANGLED BROADENING WEDGE- WILD THEORY - BIG BULL RUN?All,
Yes, given the nature of the world this is a stretch, however throw away news and say its priced in. Follow me, right angled or any broadening descending wedge usually bullish aka oversold yadda yadda. One of the most powerful patterns out there by a long shot. Anyways of course they have large dips similar to what we see now.
Why this pattern? Notice pattern current (wedge bullish angled) -> next pattern (wedge/falling wedge) extremely bullish patten (only if both wedges hold/break then are powerful). So when you combine these + trend that is what makes a bullish descn wedge possible. because it goes half way up drops down but holds onto a strong trend and takes it the rest of the way.
Just follow this and lets see what happens I think most big stocks are way way over sold 30-60% retraced. I think this makes a ton of sense to make a bull run here and then I think most likely fail and break trend.
Once again just noticing the patterns/theory. 1000000% be careful but worth watching.
Lcid

ALF - DEMAND ZONE - PIVOT ON FADE - LOW FLOAT - BANGERAll,
ALF I think is going to pop huge pretty soon we all know how wild she is when she gets going. This is now a waiting game. I have about 5 alerts set on ALF 2 or 3 below 1 slight above if it moves up and a volume alert. I think extremely soon we see ALF rip again. Make sure to actually watch this one. Actually decent company/future.
Keep in mind how long this stock has been on the market as well. Looks like some garbage downtrend stock, but in reality it hasn't been on the market long enough to even make that true. This could easily be a blimp on the radar. So always keep time on market in the back of your head.

DKNG - HIGHER WATCHLIST THAN ANY OTHER STOCK HERE All,
Put DKNG top of everything on your watchlist. HUGE demand area down here first long term retest. Confluence support trends downard that have popped 20-50%. I HIGHLY suggest watching DKNG over almost any stock in the next few weeks. I think DKNG once it bottoms here 3-6mo out will get you 200-300%. Just be patient or scale in in 30-32 range. Watch for options activity + big candles (hedges,insiders,tutes) buying in. I promise DKNG will return, sports will NOT stop due to COVID. Even Biden clearly said shutdown is not happening.

LUCID GROUP Will Keep Growing! Buy!
Hello,Traders!
LCID stock is trading in an uptrend
And the pair, which is trading
In a rising opening wedge pattern
Has retested a rising support of the wedge
And showed a bullish reaction
So all the signals point in one direction
And I think that the growth will continue
Untill the pair retets the all-time-high resistance
Buy!
Like, comment and subscribe to boost your trading!
See other ideas below too!

NIO - BIG MOVE INCOMING - DIAMOND (MIDDLE?) LOLAll,
Definitely forming a dimaond on daily, usually very large moves out of diamonds sort of a weird spot here you could argue short term diamond top or mid term diaomond bottom. Either way I think this moves big up or down keep close eye on it closer to next week, maybe sooner.

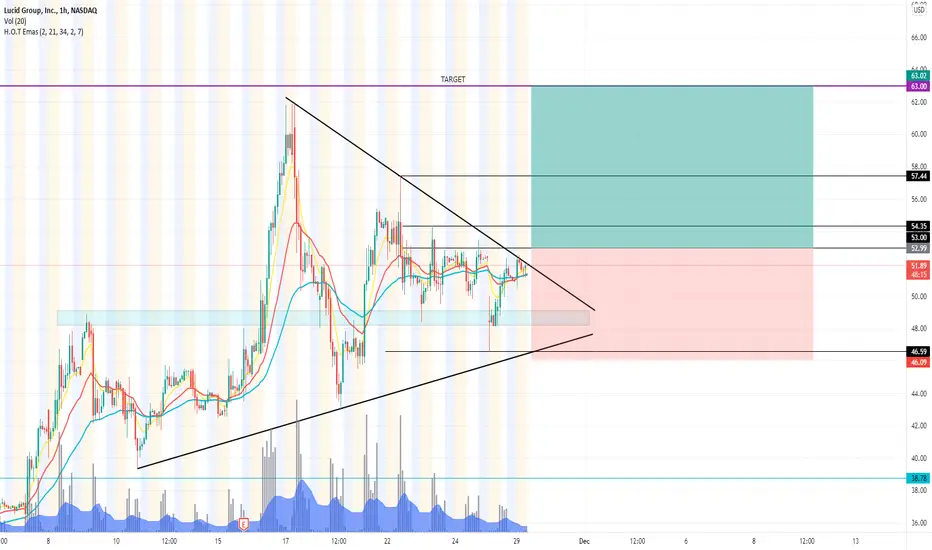
LCID Getting tightWatching this big Symmetrical triangle as price gets tighter inside it.
$53 is a pivot to the upside in my opinion,
Watching price consolidation above it.
$LCID | WEEKLY WATCHLIST 11/29Following Tesla's chart very well and have been tracking the two together. Looks to be a wave C in progress. Still waiting patiently before pulling the trigger to go long on this one.
LCID some upside after consolidationDerived from Twitter, chance for anotehr leg up if we consolidate here for a while.
If current market weakness doesn't cause bigger drops... let's see how the week ends.

JD - ARC ENDING - UP OR DOWN?All,
JD looks like it's going to make a pretty sizeable move here. My honest guess is the downside. With that said I don't think they are a bad company by any means. Decent earnings etc. I just don't see the traffic/high level interest to really keep the momentum up. That being said I always plot both theories up and down so of course do your own DD. Like most of these plays I would do 1:1 puts/calls and drop the other when you have conformation.

APPLE - AAPL - CAN APPLE GET THE PARABOLIC STEP? OR RETRACE DOWNAll,
I think Apple has a chance here to actually breakout big to the upside it needs to keep this new trend line a form some tight higher lows. There is quite a bit of darkpool / options activity on Apple and lots of hedges going on. I can see why. If it holds up here and gets a tight few higher lows over next 2 weeks it would probably hit $200. Flipside if it loses this new trend and market turns down it could see pretty significant retrace out the bottom.
Watch for:
-market (always first)
-any positive/negative Apple news
-give it a little time this is a weekly chart set some alerts
-if you wanted take a straddle or 1:1 ratio short mid range split see if you can hit a small profit on a hedge

Support & Resistance Zones Mapped!LCID had a nice run. The Bears have rejected the upward momentum twice but LCID is still looking strong based on the S/R zones shown. Do you think it will pump through the current resistance or will it dump below the diagonal support shown? I think it will touch the diagonal support but after that, I'm not too sure. A great EV company overall, so let's see how it plays out.
Love it or hate it, hit that thumbs up and share your thoughts!
Don't trade with what you're not willing to lose. Safe Trading Calculate Your Risk/Reward & Collect!
This is not financial advice.

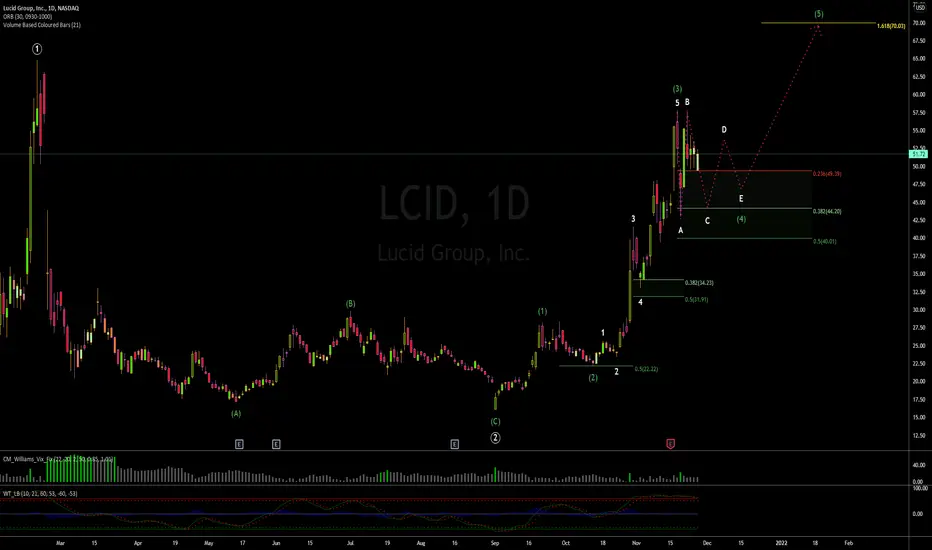
LCID short ideaI have been following $LCID for a while now and I think I spotted the top of this bull run. The elliot wave count is done at the extended fifth wave (I removed the minor waves of the extension cuz the graph looked messy). In addition to the count, there is a bearish divergence on the RSI in the daily chart. Second wave usually retraces 61.8% so that is where my PT is. Good luck in your trades.

$LCID | WEEKLY WATCHLIST 11/22Although we got a strong bounce towards the end of last week, still a bit skeptical going long. We are either still correcting in wave 4 (my preferred count) or starting wave 5 (confirmation is break over $57.75). Still needs time to develop imo.

11/21/21 LCIDLucid Group, Inc. ( NASDAQ:LCID )
Sector: Consumer Durables (Motor Vehicles)
Current Price: $55.21
Breakout price trigger: $57.50
Buy Zone (Top/Bottom Range): $52.50-$47.90
Price Target: $64.70-$66.00
Estimated Duration to Target: 17-21d
Contract of Interest: $LCID 12/17/21 60c, $LCID 12/17/21 65c
Trade price as of publish date: $5.80/contract, $4.50/contract

$LCID Lucid Motors TA - Upcoming Week$LCID Lucid Motors TA and what to expect in upcoming week:
RECAP:
- We can see that Lucid Motors has broken the Resistance line and reversed from the $58/s range.
- Stock after correction bounced at the $42/s range and rose back to $55/s range last week.
- There was an RSI Divergence followed by a large price correction.
- REMEMBER always look out for RSI Divergencies.
- If you follow me I will always lay out the RSI Divergencies when I see them and publish it right away.
NOTES:
- IMPORTANT: Keep an eye on the $50 level range, as it is very important:
-- IF the stock bounces off the $50 level range, it will up-trend towards $58-$60/s range.
-- IF the stock BREAKS the $50 level range it will down-trend towards the next bounce at the $42/s
FUNDEMENTALS:
- We typically do not do any FA here, but very important to note that right now stock futures are -200pnts as I write this.

LCID94$ PT on LCID if it can continue strong and break above it's past highs.
LCID and TSLA should remain strong along with names like FSR , F , XPEV
Not too confident on NIO yet.

#LUCID Cup and Handle formation $71 #lucid long term Cup and Handle pattern prepping for long term target of $71 followed by $99.

LCID 15 minDISCLAIMER:
I am not a financial or investment advisor. All information found here, including any ideas, opinions, views, predictions, forecasts, commentaries, suggestions, or stock picks, expressed, or implied herein, are for entertainment purposes only and should not be construed as personal investment advice. If you decide to invest, please make your own decision, or contact the specialists’ institutions. Thank you

Support & Resistance level for Lucid and Rivian..!Rivian and Lucid have entered the deflationary phase!
I believe Rivian could move toward 95 and cross below this level, and soon we see Lucid below 40!
Review the past few analyses could be interesting:
RIVN:
LCID:
You can see the most important support (green lines) and resistance (red lines) to watch in the coming days in these charts!
DISCLAIMER
I’m not a certified financial planner/advisor, a certified financial analyst, an economist, a CPA, an accountant, or a lawyer. I’m not a finance professional through formal education. The contents on this site are for informational purposes only and do not constitute financial, accounting, or legal advice. I can’t promise that the information shared on my posts is appropriate for you or anyone else. By using this site, you agree to hold me harmless from any ramifications, financial or otherwise, that occur to you as a result of acting on information found on this site.

This could be the last day for Lucid as well!Lucid experienced a 258% gain in 54 days! reached the highest closed price and got dumped in the past 2 hours!
I think closing today could be a safe bet or increasing trailing stop loss to 52..!
DISCLAIMER
I’m not a certified financial planner/advisor, a certified financial analyst, an economist, a CPA, an accountant, or a lawyer. I’m not a finance professional through formal education. The contents on this site are for informational purposes only and do not constitute financial, accounting, or legal advice. I can’t promise that the information shared on my posts is appropriate for you or anyone else. By using this site, you agree to hold me harmless from any ramifications, financial or otherwise, that occur to you as a result of acting on information found on this site.

$LCID | TRADE IDEAUpside is limited from here, looking to complete the daily gap fill. Will eye a re-entry on the wave 4 dip to catch the move to $70+.

Cup and Handle on LCID (Lucid) to play out? Scenario 1 - Biggest thing to note is the cup and handle playing out on the larger timeframe.
This is a more likely scenario bc it could utilize the .382 retracement.
Although historically an ultimate rejection and retracement after a huge bull run gave us the .75 retrace.
This would be scenario 2, a retrace to the blue fan line. This is an ultimate reversal indication.
The green arrow is not drawn in time scale. This is the handle of the cup (possibly) in scenario 1.
A retrace to the .75 would be a possible buy zone to me unless the reason for retrace was extreme bad news for the company
and it was obvious capitulation. In scenario 2 a bounce off the lower 30s with confirmation would be a possible buy zone as well.
Or scenario 3 this thing just rips and rips. If that then I scratch all this and move on for now. Please critique me!

LCID to the MOOON waiting next correction inside the green box, which is the best chance to buy more shares
