#LDO/USDT#LDO
The price is moving within a descending channel on the 1-hour frame, adhering well to it, and is on its way to breaking strongly upwards and retesting it.
We have support from the lower boundary of the descending channel, at 1.128.
We have a downtrend on the RSI indicator that is about to be broken and retested, supporting the upside.
There is a major support area in green at 1.10, which represents a strong basis for the upside.
Don't forget a simple thing: ease and capital.
When you reach the first target, save some money and then change your stop-loss order to an entry order.
For inquiries, please leave a comment.
We have a trend to hold above the 100 Moving Average.
Entry price: 1.139.
First target: 1.172.
Second target: 1.210.
Third target: 1.270.
Don't forget a simple thing: ease and capital.
When you reach your first target, save some money and then change your stop-loss order to an entry order.
For inquiries, please leave a comment.
Thank you.
LDOUSD

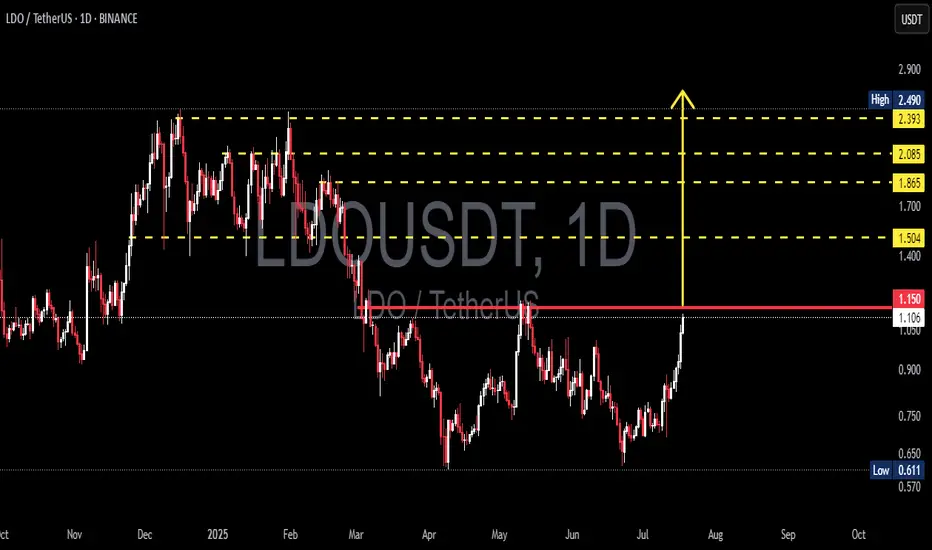
LDO/USDT Breakout Watch Ready to Fly After a Strategic Breakout?🔍 Full Technical Analysis
After months of downtrend and tight consolidation, LDO/USDT is showing clear signs of a bullish resurgence. The breakout above the key psychological resistance at $1.15 opens up a wide path toward higher resistance zones, potentially marking the beginning of a strong upward trend.
📐 Key Pattern Formed:
✅ Double Bottom Pattern
> Clearly visible from May to July 2025, with a neckline at $1.15. This is a classic bullish reversal pattern. The breakout above the neckline confirms the setup, projecting a significant upward move based on the measured height of the pattern.
✅ Horizontal Resistance Breakout
> The $1.15 level acted as a major resistance since April 2025. A clean breakout above it suggests that bulls are regaining control of the market momentum.
✅ Bullish Scenario (Primary Bias)
If the price successfully holds above the $1.15 zone and confirms it as support (successful retest), we may witness a bullish rally targeting the following levels:
🎯 Target 1: $1.504
— A minor resistance and previous consolidation area.
🎯 Target 2: $1.865
— A strong resistance level from earlier distribution zones.
🎯 Target 3: $2.085
— A technically significant level and key reaction point from past price action.
🎯 Target 4: $2.393 – $2.490
— A major supply zone and swing high from early 2025. This serves as the potential final target of the current bullish leg.
🟢 Volume increased during the breakout — a strong confirmation signal that this move is genuine, not a fakeout.
🟢 RSI likely gaining strength — though not shown on this chart, momentum indicators are likely supporting the move with a breakout from neutral levels.
❌ Bearish Scenario (If Breakout Fails)
If the price fails to hold above $1.15 and drops back below $1.05:
🔻 Potential Fakeout Risk
— A correction could send LDO back to:
Minor support at $0.90
Base support at $0.75
Major support at $0.611 (2025’s low)
📉 A breakdown below $0.611 would invalidate the bullish structure entirely, putting LDO back into a strong downtrend.
📊 Final Thoughts:
> LDO/USDT is at a critical decision point. A clean breakout from a strong medium-term structure opens the door for a significant bullish continuation. With pattern confirmation and strong volume support, this setup could mark the beginning of a mid-term uptrend.
The key lies in holding above $1.15 and watching for a healthy retest. This is a premium setup for swing traders and trend followers looking for early entries before a possible major move.
🧠 Trading Tips:
✅ Ideal Entry: On successful retest around $1.15 – $1.10
❌ Stop Loss: Below $1.00
📈 Targets: $1.50, $1.85, $2.08, and $2.49 (scaling out recommended)
#LDO #LDOUSDT #CryptoBreakout #AltcoinRally #TechnicalAnalysis #DoubleBottom #CryptoSignals #TradingViewIdeas #SwingTradeSetup #BullishPattern
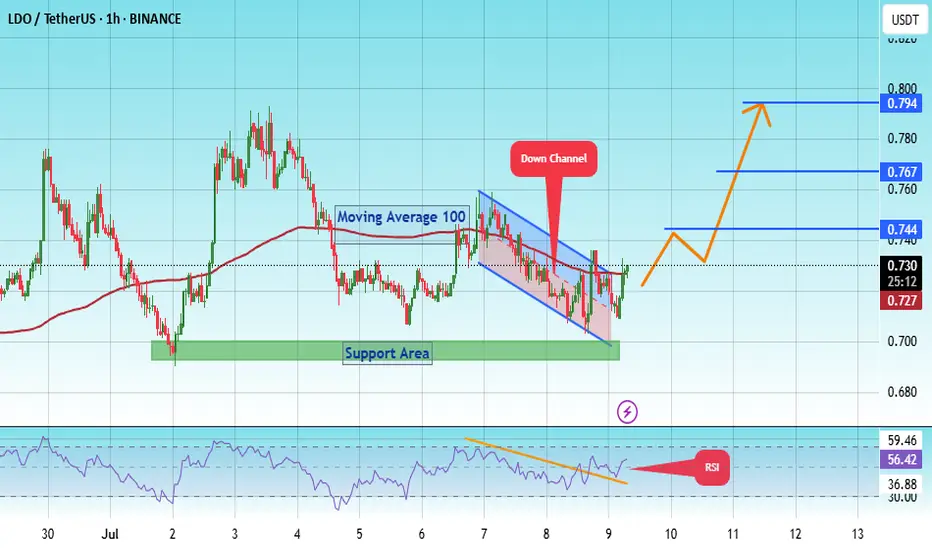
#LDO PUMP TO $ 0.794 ?#LDO
The price is moving within a descending channel on the 1-hour frame, adhering well to it, and is on its way to breaking it strongly upwards and retesting it.
We have a bounce from the lower boundary of the descending channel. This support is at 0.703.
We have a downtrend on the RSI indicator that is about to break and retest, supporting the upside.
There is a major support area in green at 0.695, which represents a strong basis for the upside.
Don't forget a simple thing: ease and capital.
When you reach the first target, save some money and then change your stop-loss order to an entry order.
For inquiries, please leave a comment.
We have a trend to hold above the 100 Moving Average.
Entry price: 0.730
First target: 0.744
Second target: 0.767
Third target: 0.794
Don't forget a simple thing: ease and capital.
When you reach the first target, save some money and then change your stop-loss order to an entry order.
For inquiries, please leave a comment.
Thank you.
#LDO/USDT#LDO
The price is moving within a descending channel on the 1-hour frame, adhering well to it, and is heading toward a strong breakout and retest.
We are experiencing a rebound from the lower boundary of the descending channel. This support is at 0.741.
We have a downtrend on the RSI indicator that is about to be broken and retested, supporting the upward trend.
We are in a trend of consolidation above the 100 moving average.
Entry price: 0.780
First target: 0.805
Second target: 0.837
Third target: 0.870

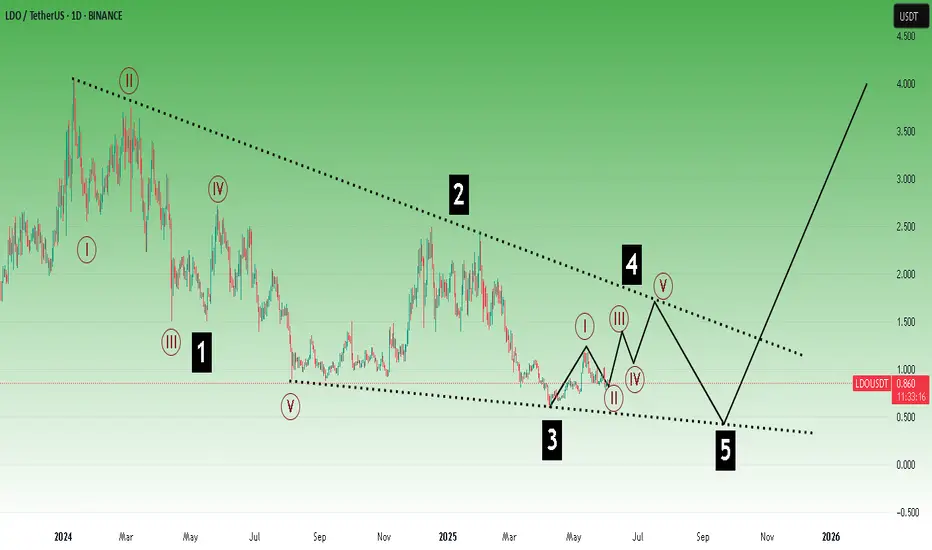
LDO ROADMAPTo me the view is pretty clear.
* The purpose of my graphic drawings is purely educational.
* What i write here is not an investment advice. Please do your own research before investing in any asset.
* Never take my personal opinions as investment advice, you may lose your money.
LDOUSDT 1D AnalysisLDO ~ 1D Analysis
#LDO Buy gradually after retesting this support block with a short term target of at least 10%+ from here.

LDOUSDT 4D Analysis LDO ~ 4D Analysis
#LDO Buy gradually from here if you still have confidence in this coin with a short term target of at least 20%++

#LDO/USDT#LDO
The price is moving within a descending channel on the 1-hour frame, adhering well to it, and is heading for a strong breakout and retest.
We are experiencing a rebound from the lower boundary of the descending channel, which is support at 0.988.
We are experiencing a downtrend on the RSI indicator, which is about to break and retest, supporting the upward trend.
We are looking for stability above the 100 Moving Average.
Entry price: 1.008
First target: 1.022
Second target: 1.042
Third target: 1.067

LDOUSDT 1D AnalysisLDO ~ 1D Analysis
#LDO Buy after successfully penetrating this resistant line with a short -term target of at least 10%+ from here.

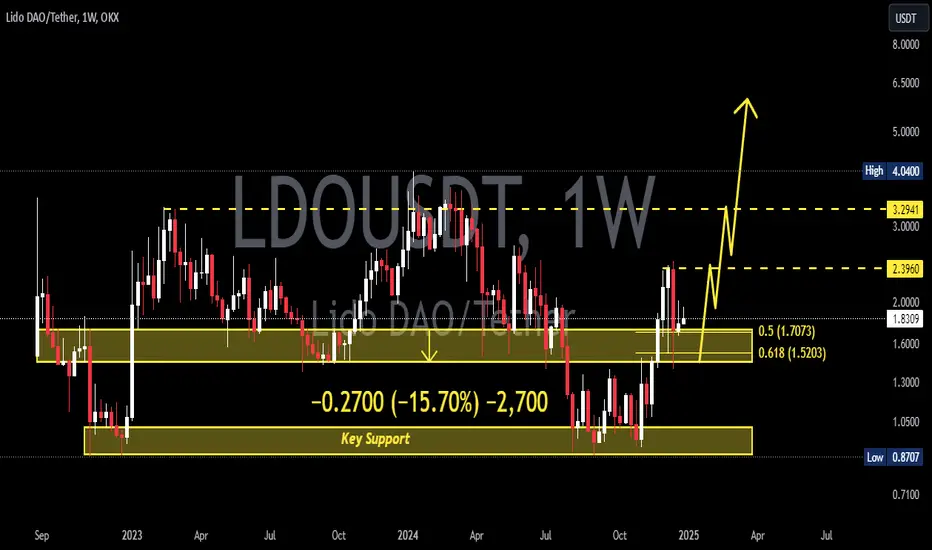
LDO Is The Best Asset NowHello, Skyrexians!
Some of you may be remember my article which I shared more than 1 year ago where called BINANCE:LDOUSDT the worst asset and it dumped exactly as predicted. Then made a mistake making assumption that some coins can grow while other will go down. This assumption has the very low probability to be truth, now I have the clear view that entire crypto will go up soon and LDO can be the greatest performer.
On the weekly chart we can see the huge 3 year accumulation. Current point can be the best to buy. We have bullish divergence on Awesome oscillator, green dot on Bullish/Bearish Reversal Bar Indicator . Moreover, current price action looks like a spring on Wyckoff cycle. The exact target impossible to predict, but I think it shall be above $12.
Best regards,
Ivan Skyrexio
___________________________________________________________
Please, boost this article and subscribe our page if you like analysis!

LDO is bearish for MidTerm (2D)Before anything, pay attention to the timeframe; it’s a 2-day timeframe and requires patience.
From the point where we placed the red arrow on the chart, it seems that the bullish LDO pattern, which was a triangle, has completed. LDO has now entered a bearish pattern of the same degree as the previous bullish pattern.
LDO is expected to remain bearish in the medium term and not break above the red box marked on the chart.
The low-risk area for buy positions in spot has been identified for buyers.
The closure of a daily candle above the invalidation level will invalidate this analysis
For risk management, please don't forget stop loss and capital management
Comment if you have any questions
Thank You

Is This the Final Drop Before a Major Reversal? Read This NOW! Yello, Paradisers! Are we about to witness the final leg of this move, or is one last shakeout coming before a massive reversal? Let’s break it all down using Elliott Wave principles.
💎Wave 1 initiated the downtrend, marking a strong sell-off from higher price levels. Volume surged during this phase, signaling institutional selling and overall market panic. This aggressive downward move set the foundation for the corrective Wave 2.
💎Wave 2 began as the price rebounded after hitting the local low at $1.406. This move aligns with a typical Elliott Wave correction, often retracing 50%–61.8% of Wave 1. The recovery phase pushed the price back up, potentially reaching as high as $1.964 before the next major move.
💎Wave 3, the strongest and longest in the sequence, started once the price failed to sustain above $1.964. This move could extend all the way down to $0.809, a critical level where selling pressure is expected to peak. Historically, volume is highest during Wave 3, indicating aggressive selling and potential accumulation zones forming.
💎Wave 4 might be unfolding right now, forming a short-term recovery. If the price retraces toward $1.392 but fails to break above it, the bearish wave count remains intact. It’s crucial to note that Wave 4 must NOT enter the price range of Wave 2—if it does, the entire Elliott Wave structure is invalidated, suggesting an alternative pattern like an ending diagonal or a larger correction.
💎Wave 5 is the final impulse wave. If Wave 4 faces rejection below $1.392 and consolidates, the market could see the beginning of Wave 5, pushing price toward the $0.746 support zone. This phase typically marks the last exhaustion move before a potential market reversal or a shift in structure.
Patience and strategy win the game, Paradisers! The market is designed to shake out weak hands before the real move happens.
MyCryptoParadise
iFeel the success🌴

LDOUSDT 4DLDO ~ 4D Analysis
#LDO Buy when visiting this support with a short -term target of at least 15%+.

LDOUSDT 1WLDO ~ 1W Analysis
#LDO So far it still continues to maintain this support. Buy gradually from here with a short -term target of at least 20%+.

Trading opportunity for LDOUSDTBased on technical factors there is a Buy position in :
📊 LDOUSDT
🔵 Buy Now
🪫Stop loss 0.800
🔋Target 1.150
📏 R/R 1,8
💸RISK : 1%
We hope it is profitable for you ❤️
Please support our activity with your likes👍 and comments📝

#LDO/USDT#LDO
The price is moving in a descending channel on the 1-hour frame and is adhering to it well and is heading to break it upwards strongly and retest it
We have a bounce from the lower limit of the descending channel, this support is at a price of 1.20
We have a downtrend on the RSI indicator that is about to break and retest, which supports the rise
We have a trend to stabilize above the moving average 100
Entry price 1.23
First target 1.28
Second target 1.34
Third target 1.41

#LDO/USDT#LDO
The price is moving in a descending channel on the 1-hour frame and is adhering to it well and is heading to break it upwards strongly and retest it
We have a bounce from the lower limit of the descending channel, this support is at a price of 1.64
We have a downtrend on the RSI indicator that is about to break and retest, which supports the rise
We have a trend to stabilize above the moving average 100
Entry price 1.71
First target 1.80
Second target 1.87
Third target 1.95

Public trade #16 - #LDO price analysisUsing the "scientific poke method", we decided that it was time for the MIL:LDO price to continue its long and stable upward trend. To “round and beautiful” - $10
And since “someone” has aggressively bought back OKX:LDOUSDT twice from the $1.40-1.56 range, we'll buy some there as well)
So, will it be: one, two, three and off we go?)
_____________________
Did you like our analysis? Leave a comment, like, and follow to get more

#LDO/USDT#LDO
The price is moving in a descending channel on the 1-hour frame and is expected to continue upwards
We have a trend to stabilize above the moving average 100 again
We have a descending trend on the RSI indicator that supports the rise by breaking it upwards
We have a support area at the lower limit of the channel at a price of 1.80
Entry price 1.84
First target 1.885
Second target 1.94
Third target 2.00

LDOUSDT 1WLDO Update ~ 1W
#LDO So far it continues to maintain its bullish structure. This is a very good support Block for gradual rebuys. With a minimum target of 20%+
Lido LDO price has woken up and is ready to surprise everyone ?)Just look who has woken up - CRYPTOCAP:LDO
After almost a year-long downward trend and 3 months of consolidation, it showed an increase of +50% in 1 day !)
Does anyone know what “stimulated” it so much?
Speaking purely on the OKX:LDOUSDT chart, it is not advisable for the price to fall below $1.10-1.15 in the coming days.
If this condition is met, then we can start dreaming of continued growth to the $2.25-2.40 area.
_____________________
Did you like our analysis? Leave a comment, like, and follow to get more

#LDO/USDT Ready to go up#LDO
The price is moving in a descending channel on the 1-hour frame and sticking to it well
We have a bounce from the lower limit of the descending channel, this support is at 1.14
We have a downtrend, the RSI indicator is about to break, which supports the rise
We have a trend to stabilize above the moving average 100
Entry price 1.17
First target 1.20
Second target 1.25
Third target 1.29

The Banana Zone Series - LDO Buy the Dip Levels (9 of 10)Alt-season is here. BTC breakout has been confirmed. If you missed positioning for the next level of exponential moves, what are some of the buy the dip zones while still have time for the bigger moves into the banana zone.
We continue the series with Lido DAO ( MIL:LDO ).
As you can see in my analysis, pull backs to $1.12 and below is my new accumulation zone. I will initiate some leveraged longs for new trades in preparation for the moves to the banana zone in the alt season.
For more aggressive traders, $1.20 and below can be the trigger longs with tight stops.
Not a financial advice so DYOR.
