Major correction coming soon for Bitcoin?We see that Bitcoin is trading in a range since ~ 8 January.
What is this chart showing?
- There was a shift in Market Structure at the 10th off January
- After this shift we saw the Lower-Low
- I see Equal high's, those should get hunted (imo)
(My) Conclusion:
I placed my short order at 50% of the orderblock (blue). I think this could be a major turning point for Bitcoin. Price could easy visit $25000 region (FVG). Price could also drop lower to test broken levels that are (STILL!) untested.
Thank you for checking my analysis!
Do you have tips or other comments? Tell me please! I'm open for feedback!
Learning

NZD/USD - LONG IDEA - 4HReminder - Still Learning - Use or ignore this information as you see fit.
NZD/USD - BUY
1). Price hovered around the 78.6% Fib line for 10 candles.
2). Bounced off that Fib line and is continuing uptrend.
3). Next strong resistance is 0.74297
SL - 0.70906
TP - 0.74100

ZRX at an all-time low but hold your horsesZRX has recently set a new all-time low against Bitcoin. Last time this happened in September 2019 after months of sales against Bitcoin, which back then just ended a short-lived bull run.
Soon after that low, ZRX bounced up by +40% a week. So now many traders are curious if this setup would happen again.
We’ve asked the following question on the Cindicator platform:
The cryptocurrency 0x (ZRX/BTC) settled at 0.00001298 BTC at 10:25 AM UTC at the binance exchange on Monday, January 11. In your opinion, will ZRX/BTC trade above 0.00001623 BTC (+25.0%) at any time before January 25?
Hybrid Intelligence (148,000+ analysts +AI) voted, producing this result: 48.58%
This means uncertainty is very high.
There is about a 50% chance of ZRX going up +25% against BTC over next week.
Of course, there is the same chance of this NOT happening…
It’s best to avoid entering positions now and keep watching what BTC will do: a continued sell-off might drag ZRX even lower.

Checkout These Price Action Patternsyou can learn a lot by focusing on these patterns give some time to your eyes to notice what these patterns are saying !!
Happy learning 😊

My first ETHUSD ideaHi All,
Thank you for opening my post and having a look! I'm new to TA so please don't take this as advice or whatsoever. I'm curious how my idea plays out and i would love to have your feedback.
Trying to learn new stuff everyday!
On the 1h chart (bittrex) im seeing a ascending triangle, which could be seen as a continuation pattern in a down trend.
Currently the price is at $1100 where the 100 ema line needs to be crossed, next to the .382 fib level which needs to be cleared. If this doenst succeed I expect ETH to break below the triangle and drop to the .786 fib level.
$850 would then be my suggested next support level.
Thanks again for (re)viewing my post.
Leave me a comment with your thoughts and feedback!

Understanding how to trade Pennant patterns / Real exampleToday we will show you the theory behind Pennant patterns and apply them to a real example.
CONTINUATION PATTERNS: Ralph Nelson Elliott (who created the Elliott Wave Theory) discovered that there are 4 types of patterns that the resolution of them tend to be in the same direction of the previous impulse once the correction is finished and we have a breakout.
-TRIANGLES
-IRREGULARS
-ZIG-ZAGS
-FLATS
Today we will learn about pennant patterns, which are a type of triangle. Pennant Patterns are made by 5 waves (abcde); you can draw that using the tools you have on trading view on "Patterns."
In general terms, you will be able to draw two converging lines, and the price will start compressing there. It's important to know which is the previous impulse of the pattern to draw the Fibo Extension using that previous impulse. The Fibo Extension will allow you to define targets and are extremely useful when you are at ATH because you can't rely on previous technical movements to define supports or resistances.
HOW TO TRADE THEM?
Entry-level: Always above/below B depending on the direction you are trading. In this case with AMZN, our confirmation level is above B
Stop Level: Always above/below A depending on the direction, you are trading. The easiest way to define your stop level is by setting it above/below the whole structure.
Break-Even level: If the price starts going in the expected direction, you can move your stop loss to your entry-level, once the price reaches the First Fibo Extension
Target: Use the last Fibo extension level. Your minimum risk rewards ratio should always be 1.5, never less than that.
Thanks for reading!

SEC impactAs we are aware over 90% of XRP holdings are done individuals outside of the US. However, we need to understand that this does not mean the US can reach international Laws when it comes to anything involving big money. I have two personal opinions and comment below on what you think. I believe that when Feb 22 hits XRP will be back at the 0.45-0.50 maybe even 0.60 based on the previous structure that we broke back there that started on the 24th of Nov and Wicked out at 0.78. What i expect that from Feb 22nd XRP will wick out at around 0.70 and touch the 0.25-30 before we fly again over 1.00. Now my other personal opinion is simply that the price of XRP remain at the 0.25-0.30 and as a result of the Lawsuit if it may be deemed not a security, bring us directly to the 1.00 price range without the chance to see 0.25.30 again.
Now I believe this to be my personal opinion but if you think about it the Forex market is already a 4-5Trillion dollar market and that's per day. I believe the crypto market capitalization will reach 100 trillion dollars by 2025 if not 2030. This is simply something i see based on where the world is headed in terms of currency and the use of currency globally. Comment down what you think as I personally believe that XRPA itself will one day reach that MKT CAP of 1 trillion dollars. In Crypto, you never say never.

BEL Price action BEL seems to come out of box along with making a reverse head and shoulder pattern. Trade with targets of upto 170 , keeping stop loss at level of right shoulder i.e. around 88. The company also seems to improve fundamentally with healthy dividend payout , almost debt free and increased cash flow and assets.


🎓 EDUCATION 2: STOP Trading (Only) with Technicals ❌Happy Thursday traders! It’s time to continue with our Educational Series on how to become a successful trader with a professional trading approach. It's holiday season, and closed markets mean more time to sharpen our trading skills! Let's go...
In the last post, we touched on the main ingredients of a successful trader (check the link to "related idea"). Let’s reinforce those again:
1. Market Analysis – Your “Analyst” side. Here, you are going to combine Fundamentals, Intermarket analysis, Sentiment analysis, and (the correct) Technical analysis (FIST approach).
2. Trading – Your “Trader” side. Once the analyst in you spots a promising trade idea, the trader in you is responsible to execute the trade with proper entry and exit levels.
3. Management – Your “Manager” side. Every trader is a risk manager. Your manager side is responsible to manage your trade and risk levels, scale in and out of positions, open the correct position sizes, evaluate the reward-to-risk of your trades, etc.
Alright, so far we are still covering your “Analyst” side. Your analyst side determines whether you will buy EURUSD, sell GBPJPY, buy gold, and sell silver. It’s the part of your trading that constantly scans for profitable trade ideas and setups in the markets, and passes them on to your “Trader” side.
Why You Shouldn’t Rely on Technical Analysis?
The majority of new traders I see in the retail space place too much attention on technical analysis. They search the internet for TA articles, look for the “holy grail” indicator, read dozens of technical analysis books, but still don’t manage to improve their trading performance.
The truth is, they don’t understand the markets. I don’t care how many TA books you’ve read in your entire life, if you don’t understand how markets work and what moves prices up and down, you won’t succeed as a trader.
Unfortunately, almost every retail trading website promotes and publishes those articles, because they are attracting clicks of inexperienced traders.
Here is a hint: When I worked in the trading department of a large European bank, I didn’t even look at charts. There are almost no charts and no indicators on the trading floors of big banks and hedge funds!
Do you really think that banks will move hundreds of millions into a trade because the 50-day MA crossed the 100-day MA, or because the price formed a Head & Shoulders pattern? The first time you do this in a bank will likely be your last day as a professional trader.
So why do retail traders trade like that? Because they don’t know of better ways to trade. No one has taught them that trading based purely on technical analysis will never work. It’s in nobody’s interest to teach you this because large market participants need the “dumb money”. Yes, they make a profit when you trade badly and lose money.
So, what’s moving the market if it’s not technicals?
The Forex market is the marketplace for the world’s currencies, and currencies are influenced by supply and demand. To be more precise, interest rates influence currencies, with higher interest rates increasing demand for a currency (therefore leading to higher prices) and lower interest rates decreasing demand for a currency (therefore leading to lower prices.)
We as Forex traders are interest rate traders. We trade currencies based on (short-term) views about their future interest rates. For example, let’s say the market expects higher inflation rates (inflation represents the change in the price of goods and services during a year) in Australia, which could lead to a response from the Reserve Bank of Australia by hiking interest rates. This will create demand for the AUD (remember, global capital is always chasing yield), which in turn would lead to a higher exchange rate of the AUD.
If you only followed technicals and identified a bearish divergence on the RSI in AUD/USD - and you entered short - it’s your fault. The pair would likely move higher on higher interest rate expectations in Australia.
So, when do technical levels work? When the market trades in fair value (in fundamental equilibrium), you’ll find that simple technical rules work. If large market participants agree that the current exchange rate of a currency pair is “fair” given the current fundamentals, smaller players may move the market when the price reaches a support or resistance level, or when the price breaks above or below a triangle. Unfortunately, markets are always in a state of flux and rarely in equilibrium, so following other analytical disciplines (besides technical analysis) will improve your trading performance dramatically.
This chart shows the Band of Agnosticism. This band represents a span of exchange rates where fundamental-based traders are unlikely to join the market because the market is already in a fundamental fair-value zone. As the exchange rate starts to approach the upper or lower band, fundamental-based traders (which happen to be large banks and hedge funds) start considering opening new positions. The volume of their orders pushes the price back inside what is considered fair value.
Professional traders first look at a variety of other factors before they decide what currency pair they want to trade. Once we identify a good trading candidate (our “Analyst” side does that), then it’s time to open the chart and find areas where we could enter with a long position (and those are not trendline breakouts!)
We will cover all of this, step by step, in the coming Educational posts.
Don't forget to FOLLOW to receive all future trade ideas and educational posts!
Happy holidays everyone. 🎆

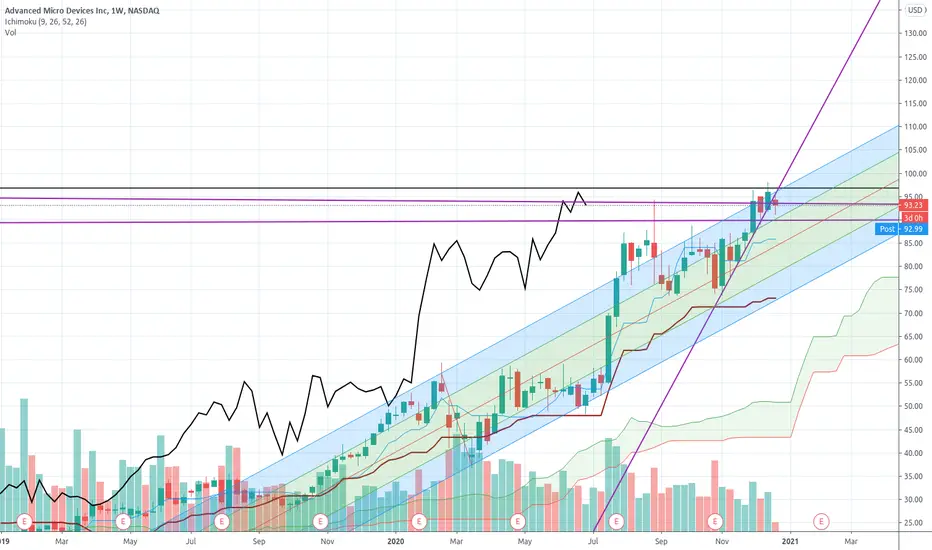
$AMD Pitchfork Weekly. Is this right?Is this analys right on a weekly. Shows AMD is bullish on a weekly. On a daily I am not getting the idea NASDAQ:AMD
Why most people fail as retail traders?I see two main reasons which complement each other for the high rate of failure.
First and foremost, the media and the industry promote this idea that it’s easy to become a profitable trader and anybody can go it. This is, of course, not true. Theoretically, anybody can do it if willing to put the effort and approach it as a business. Practically almost nobody approaches trading with the same rigorousness as any other professional endeavor.
Let’s put aside the first reason, about which there is not much we can do. A big chunk of the industry relies on peoples being naive and we’re not going to change that. On top of the first reason, we have a second reason related to people themselves. Most of those who try trading financial markets simply don’t manage their emotions and risk well enough to survive the learning curve.
Managing your own emotions turns out to be a complex endeavor and constantly changing market conditions lengthen the learning curve. One of the things that makes this business so attractive is also the main thing that makes it so difficult to master.
The direct and sometimes violent feedback you receive from the market, after each trading decision, has an astonishing impact on a human’s ability to keep his psychological well being in check and control his own reactions. It has the potential to disrupt executive functions and trigger instinctual “fight or flight” responses. This leads to emotional trading or trading on tilt which quickly generates more losses than any other mistake you could make in this business.
Most other jobs have a protective buffer zone between usual day to day work decisions and the ultimate feedback — end of the month paycheck. This profession doesn’t. Every little call you make has an immediate impact on your capital. Every little mistake can take a portion of your capital away and every good decision can bring it all back and more. This kind of psychological exposure is heavily distressful and being aware of its mechanisms makes a huge difference.
So … psychology differentiates the pro. Don’t get me wrong … professional discretionary traders are not emotionless but are much more aware and in control of their reactions. The successful pro deeply understands that trading is mainly about people's perceptions and the rest are just details.
You may ask yourself how can such a level be reached? A starting point is to stay away from any market, financial instrument, time frame, trading technique, or any combination of those that doesn’t fit who you are deep inside. The least the exposure to triggers that can awake the demons within, the best.
Always seek strategies that you understand and match your inner self. For example … if you are impatient trade shorter time frames, if you are very risk-averse don’t use huge margin, if you are risk-averse but you don’t have enough capital use margin with a tight risk management (maybe options), if you have a statistical mind try quantitative approaches etc. There are infinite possibilities to adapt to yourself and is a must to do it if you want to have a chance.
It always amuses me to see the vast majority of educational resources geared towards what market does when most of the success in this business is knowing how you adapt to the market, whatever it may do. And, of course, the market is, more or less, the other traders.

Will it go down? Thoughts on it? (Newbie here)Hi guys, I was trying to make an analysis on Gold on a weekle timeframe, I think it might go up since the trend is not going up anymore, I am not aware if the price of gold was fairly overvalued before and thats why is doing a correction at the moment. Any thoughts or improvements? Any prediction about the direction of gold? I believe theres going to be a correction and it might lower up to 0.61 on the FIB retracement. I couldnt find any pattern (Still learning them). Comment what you guys think. Ty

EURUSD - 11 Steps to successfully place a Trade - with MTFA Hi Traders!
The EURUSD is in an overall Uptrend.
Firstly, let's find out what the 11 Steps are and why they're so important:
We seperated the Steps into two categories, the "Outside the Watchlist" part and the "Analysing the pair" part.
"Outside the Watchlist" --> This is the way of analysing. You should already have it in your mind.
So, you don't want to trade just "anything", you have a specific setup for which you must have the rules.
These rules contains the minimum Risk-to-Reward ratio, Market, Trending Stage, Timeframe, etc.
A: Detect the Trend:
If you don't know the trend, you don't know in which direction you want to trade.
It's just trying to find a restaurant without opening your Map. You have to declare the direction before you start to drive.
For declaring, you must analyse whether it is:
- in a Trend
- a Channel or
- a Range.
B: Do your MTFA
You have to know at which situation you are in the big picture to know what to do wisely in the shortterm Timeframe.
Imagine you hear a boy shouting: "I have an A+ in the last test!"
Do you know whether he is a good or a bad student just by hearing this sentence?
It could be his first A+ in this year or the ninth in a row.
C: NEVER BREAK YOUR RULES
There are hundreds and hundreds of Pro-Traders telling you exactly that. And the most of them are successful Traders.
There must be a reason behind it. If you aren't convinced, go and try it on your own. We wouldn't recommend that.
"Analysing the pair" --> Now after you understood the main points of the main structure, we can go deeper and
start analysing the pair.
1: Find Structure Levels:
Find Levels, which other Traders might consider too. Don't forget that there could be a reaction, both good and bad
for you. In addition, it is important to reduce to the main things only to keep a clear view at the market situation.
2: Detect usual behavior:
As mentioned before, you're looking for a specific trading setup.
When you back-/fortested it enough times, you can identify certain patterns, behaviors and effects.
For example, you noticed that after a Trend with a Trendline there is often a short Range with a Consolidation Box.
And after the Consolidation Box it turns over and moves down. So, you wait for a Range after a Trendline-Break.
3: Mark up for an Entry Trigger:
So, we already determined the usual behavior: It's the emergence of a Range.
Now you mark up the characteristic Levels of the Range: Support and Resistance.
Because you want to sell the market, you declare the Break of Support to your Entry Trigger.
4 & 5: Setting the TP and the SL
After declaring the Entry Trigger, you must now where and when to exit before you even place the trade.
For example: You get on the train. Do you think about getting off the train after you already entered?
Hopefully not! And that's the same for Trading.
6: Put the TP & SL into a Position Size Calculator
Now it is getting intresting. The first part was just theoretical.
But we want to actually trade the price. No later than entering your trade after the Entry Trigger
you have to set the Lot size. The problem is, that by not setting an equal Lotsize,
the calculation of the Risk-to-Reward ratio cannot mean anything.
If you risk more $ on one trade
and than on the other and both have the same risk-to-reward ratio, you could still lose money.
That's the failure of Money Management.
7: Wait for the Entry Trigger
This is a point which many Educators doesn't mention. It is a big danger to trade the price before the
market triggers the Entry Trigger. Because if you enter too early, chances are that the market
moves against you, because it is still tending to other Direction.
8: Place the Trade
Now you can be happy. You considered all the rules, you even waited for the Entry Trigger, you calculated your risk
and finally you can place the Trade. Even if it hits your SL : Be happy that this trade did not break any of these rules
and be proud of the preparation of it!
These were the 11 Steps on how to successfully place a Trade. We hope we helped you and that you learned something new.
If something is unclear, please don't hesitate to ask your question .
When you want to give Feedback or critizise anything important, please do that too!
Now we're going to share the screenshots of the MTFA. If you want to know more about anything, please let us know!
The timeframes are: Weekly Timeframe, Daily Timeframe, H4-Timeframe and H1-Timeframe.
Weekly:
Daily:
H4:
H1:
We recommend to trade the Break of the Trendline and the Range in combination with a candlestick pattern.
Thanks and successful Trading :)!

Learn how to create a setup using 5 price action itemsToday we will learn how to create a full setup using 5 Price Action items. This process will be made on the 1H chart and is extremely useful for Swing setups. However, the logic can be applied in any timeframe. This can also be applied to any direction today; we will work with a short setup, but it is the same for a long setup.
1) Daily Resistance zone: If we are working on the 1H chart and the price is about to face a Daily Resistance zone, we should expect a reaction there; WHY? Because The higher the timeframe of a level, the stronger it is, and we should be ready for a reaction there. This should be the first filter to use: The price is about to face a higher degree zone.
2)Define the minor support and resistances of the current trend: If we are waiting for a reaction on the Daily Resistance zone, it is essential to understand the levels we have on the current trend. WHY? Because we will use them to define the next target and the Corrective structure's location to trade.
3)Wait for the breakout of a relevant trendline: In this case, we want to see the price breaking the Ascending trendline; WHY? Because that would be a signal that the Reversal movement on the Daily level is going as expected. The breakout of the Ascending trendline is a key element: Know the conditions are optimal to start thinking on a short setup.
4) Wait for a corrective Structure on the minor Support zone: Corrective Structures are ABC or ABCDE patterns. You should be able to draw edges on that sideways movement. You can define that is ready when you have something like the example you see on the chart.
5) Now, everything is aligned to develop a setup. Your bearish idea is supported with all the previous 4 items; only at that moment you can say I will create a short setup. Define your entry-level below the structure or below "B, set your stop above "C". Define your Target on the next minor support/resistance zone. Pay attention to the risk-reward ratio you have; only take setups with a R/R ratio higher than 1.5
Thanks for reading! We hope this Template can help you with your trading.

Dream scenario: A valuable lessonBitcoin is a small 2% away from all time high. Now is a good time to look back on the past 3 years since it has gone mainstream. Many "strong hands" ended up selling right before the explosion up (the same people that criticized, insulted, reported and mocked me, while let me remind you I bought at the bottom of this explosion at ~12750 when many of them were selling "the top" and many others had already sold).
Not all the 2018 bulls have sold at the bottom, and not all have sold period. A whole lot sold near the bottom, or a little before, or a little after (even some "OGs" sold at 13k or less as the bull market was starting). But generally speaking the people that laughed at me were bullish during the entire bear market while I was bearish from March 2018 to some time in 2020 so the entire bear market, and they ended up exiting all or in part right as the new bull market was starting. Karma hits hard.
While the price going to zero after sucking the bear market bulls back in would be hilarious, where it is at now is sufficient for Bitcoin victims to draw some conclusions.
I will remind what the rules are (made an arbitrary list, those are the main ones that come to mind):
1- Do not lose money. Cut losses quickly. Have an intelligent position size.
2- Have a plan. Told some "experts" with 20 years experience that "you waited that long, why fomo in now?" back in early 2018, just got barked at.
3- Real traders goal is to make money. Victim's goal is to not miss out (and they end up missing out anyway).
4- Waiting for a big pullback for no reason is stupid.
5- Not waiting for a big pullback when one is likely is stupid.
6- Diversify. Even Mr concentration Warren Buffett diversifies (in assets, in industries, and over time).
7- If you find yourself getting influenced by the crowds, the media, etc: cut them off.
8- For stubborn people (you skipped 7 hopefully): well don't be too stubborn if the evidence is saying something different.
9- Brace yourselves for the boring saying we all heard 10 thousand times: there is no free lunch.
10- Run winners. If the price keeps going strongly up and you are on a weekly chart, why would you sell at 13k this year?
11- Use your head. I see so many mind-bogglingly stupid arguments and actions. To those people: make a damn effort, you can't be that dumb (right?).
12- Don't revenge trade: do not try to "get my money back NOW".
13- Revenge trade: If something keeps not working do something different, sometimes this is the opposite.
14- Do not try going too fast
15- Don't day trade
This is very helpful to people that held Bitcoin all of 2018-2019 and end up selling in 2020: www.nooooooooooooooo.com


How to use Corrective Structures to develop a SetupGreat day to learn something, today; we will understand how to use corrective structures to develop a setup on any chart.
a) There are 3 types of Corrective Structures, Zig-Zag (first example), Flat (Second Example), Triangles (third example). Use them as an archetype to spot them on a chart.
b) Now that you understand the types of corrective structures is time to look at one on the chart ( you can see a Flag Pattern on the real chart)
c) Should I trade all the corrective structures I see? NO, YOU DONT! You need Context. Your corrective structure must be well-positioned on the chart, it can be a Trendline, or it can be a Support. Never trade isolated patterns.
d) Then you need a clear path in the direction you are expecting. In this case, we are at All-time Highs, so we don't have any Resistance
e) How can I calculate my target? Use Fibonacci Extensions. Draw it from the base of the impulse towards its top (where the corrective structure starts) and then take it back to the impulse's bottom. Pay attention to 2 levels only 1.27 for Break Even, and 1.618 for Target
f) Only take setups with a risk-reward ratio higher than 1.5
Have a Great Day!!!

