5 Common Mistakes New Traders Must Avoid
Trading in the financial markets can be an exciting journey, but it's not without its challenges. Many new traders often make common mistakes that can lead to losses and frustration. Understanding these mistakes is essential for developing a successful trading strategy. In this idea, we will discuss the top five mistakes new traders make and provide practical tips on how to avoid them. By being aware of these pitfalls, you can improve your trading skills and work towards achieving your financial goals.
1. Lack of a Trading Plan
Mistake: Many new traders dive into trading without a well-defined plan. They often trade based on emotions, tips from friends, or market hype, which can lead to inconsistent results and unnecessary losses.
Solution: Develop a comprehensive trading plan that outlines your trading goals, risk tolerance, entry and exit strategies, and criteria for selecting trades. A good plan should also include guidelines for risk management, such as how much capital you are willing to risk on each trade. Stick to your plan, and avoid making impulsive decisions based on market fluctuations or emotions.
Key Elements of a Trading Plan:
-Objectives: Define what you aim to achieve (e.g., short-term gains, long-term investment).
-Risk Management: Determine how much you are willing to lose on a single trade and set stop-loss orders accordingly.
-Trading Strategies: Decide on the type of analysis you will use (technical, fundamental, or a combination).
2. Ignoring Risk Management
Mistake: New traders often underestimate the importance of risk management, leading to excessive losses. They may over-leverage their positions or fail to set stop-loss orders, which can result in significant financial damage.
Solution: Implement strict risk management rules. A common rule of thumb is to risk no more than 1-2% of your trading capital on a single trade. This approach allows you to withstand several losing trades without depleting your account. Use stop-loss orders to limit your losses and consider using trailing stops to protect profits as trades move in your favor.
Tips for Risk Management:
-Position Sizing: Calculate the appropriate size of your trades based on your risk tolerance.
-Stop-Loss Orders: Always set a stop-loss order to exit a trade if it moves against you.
-Diversification: Avoid putting all your capital into a single trade or asset.
3. Overtrading
Mistake: In an attempt to make quick profits, new traders often engage in overtrading. This can result from the desire to recover losses or the excitement of seeing trades executed, leading to poor decision-making and increased transaction costs.
Solution: Set specific criteria for entering and exiting trades, and resist the urge to trade more frequently than necessary. Focus on quality over quantity. It's better to wait for high-probability setups than to force trades that don’t meet your criteria.
Strategies to Avoid Overtrading:
- Limit Trading Frequency: Define a maximum number of trades per day or week.
- Review Trades: After each trading session, review your trades to assess whether they adhered to your trading plan.
- Take Breaks: If you find yourself feeling overwhelmed or impulsive, take a break from trading to reset your mindset.
4. Emotional Trading
Mistake: Emotional trading occurs when traders let their feelings dictate their decisions. Fear, greed, and frustration can lead to impulsive trades, often resulting in losses.
Solution: Practice emotional discipline. Recognize that emotions can cloud your judgment and lead to poor trading decisions. Use techniques such as journaling to reflect on your trading experiences and identify emotional triggers.
Techniques to Manage Emotions:
-Set Realistic Expectations: Understand that losses are a part of trading, and not every trade will be profitable.
-Develop a Routine: Establish a pre-trading routine to calm your mind and focus on your trading plan.
-Mindfulness Practices: Consider techniques such as meditation or deep-breathing exercises to manage stress and maintain focus.
5. Neglecting Market Research and Education
Mistake: New traders sometimes jump into trading without sufficient knowledge about the markets, trading strategies, or economic indicators. This lack of understanding can lead to poor decision-making.
Solution: Commit to continuous learning. Take advantage of the wealth of educational resources available online, such as webinars, articles, and trading courses. Stay updated with market news and analysis to understand the factors influencing price movements.
Steps for Education:
Read Books: Invest time in reading books on trading, market psychology, and investment strategies to deepen your understanding and broaden your knowledge base.
Practice with a Demo Account: Before trading with real money, use a demo account to practice your strategies in a risk-free environment.
Join Trading Communities: Engage with other traders on platforms like TradingView, where you can share insights and learn from each other.
Follow Experts: Subscribe to trading blogs, YouTube channels, or podcasts from experienced traders.
Trading is a journey that requires discipline, patience, and a commitment to continuous learning. By avoiding these common mistakes and implementing effective strategies, new traders can enhance their trading skills and improve their chances of success in the financial markets. Remember, every trader faces challenges, but those who learn from their experiences and adapt will ultimately thrive.
Learning

This One Emotion Could Be Destroying Your Trading ProfitsIn the world of trading, emotions play a pivotal role in shaping decision-making, and one of the most powerful and potentially dangerous emotions traders face is GREED . Greed, when left unchecked, can lead to impulsive decisions, high-risk behaviors, and significant losses. On the flip side, mastering greed and learning to manage it can make you a more disciplined and successful trader. In this article, we will explore what greed in trading looks like, how it affects performance and practical strategies for managing it.
Greed in Trading?
Greed in trading is the overwhelming desire for more – more profits, more wins, more success – often without regard to risk, logic, or a well-structured plan. It can manifest in different ways, such as overtrading, chasing unrealistic returns, holding on to winning positions for too long, or abandoning a proven strategy in the hope of making quick gains.
How Greed Manifests in Trading:
📈Overtrading: A greedy trader may take on far more trades than necessary, often without proper analysis or risk management, simply to increase exposure to potential profits. Overtrading increases transaction costs, dilutes focus, and leads to emotional burnout.
🏃♂️Chasing Profits: Greed can cause traders to chase after price movements, entering trades impulsively based on fear of missing out (FOMO). This often leads to poor entry points, increased risk, and diminished returns.
⚠️Ignoring Risk Management: A greedy trader might ignore risk parameters like stop losses or over-leverage positions, believing they can maximize profits by taking on more risk. This is a dangerous path, as a single market movement in the wrong direction can wipe out large portions of capital.
⏳Failure to Exit: Holding on to winning trades for too long is another sign of greed. Instead of securing profits according to a trading plan, traders might hold positions with the hope that prices will continue to rise indefinitely, only to see their gains evaporate when the market reverses.
How Greed Affects Trading Performance
Greed can distort your decision-making process. It leads to overconfidence and clouds judgment, causing you to believe that the market will always behave in your favor. This overconfidence pushes traders to abandon their strategies or take unnecessary risks, resulting in:
Emotional Trading: The trader begins to react emotionally to every small market movement, making decisions based on feelings rather than rational analysis.
Impaired Risk Management: Greed often blinds traders to the importance of managing risk, which is the backbone of long-term trading success. A single high-risk move inspired by greed can erase months or years of gains.
Missed Opportunities: By focusing on unrealistic gains or trying to squeeze every bit of profit from a trade, a trader may miss more reliable and smaller, but consistent, opportunities.
The Psychology Behind Greed
Greed is rooted in our psychology and is amplified by the very nature of the financial markets. Trading offers the possibility of instant gains, which triggers a dopamine response in the brain, making us feel rewarded. The lure of quick profits encourages traders to take greater risks or deviate from their trading plans in pursuit of bigger wins.
However, the emotional high from successful trades is often short-lived. Traders can become addicted to this feeling, pushing them to take on more trades or stay in positions for longer than they should. Eventually, this leads to bad habits and unsustainable trading practices
How to Manage Greed in Trading
While greed is a natural human emotion, it can be controlled with the right mindset and strategies. Here are some practical ways to manage greed in trading:
1. Set Realistic Goals
The first step in managing greed is setting clear, realistic trading goals. Rather than aiming for massive, one-time profits, focus on steady, consistent returns. Define what "success" looks like for you on a daily, weekly, and monthly basis. Having measurable goals helps anchor your trading behavior and keeps you grounded.
Example: Instead of aiming for a 100% return in a short period, set a more achievable target like 5%-10% monthly. This may not sound as exciting, but it's more sustainable in the long term.
2. Stick to a Trading Plan
A well-defined trading plan is your safeguard against impulsive decisions driven by greed. Your plan should outline entry and exit points, stop-loss levels, and risk-reward ratios. By adhering strictly to your plan, you can resist the temptation to hold on to trades longer than necessary or jump into trades impulsively.
Key elements of a good trading plan include:
-Entry and exit criteria are based on analysis, not emotion
-Risk management rules (like how much to risk per trade, stop-loss settings)
-Profit-taking strategy, deciding when to lock in gains
3. Use Risk Management Techniques
Effective risk management is the antidote to greed. By setting strict risk parameters, you limit the impact of poor decisions driven by emotions. Always use stop-loss orders to protect yourself from significant losses, and never risk more than a small percentage of your trading capital on any single trade (example 1-2%).
Avoid over-leveraging, as leverage amplifies both profits and losses. While it may be tempting to use high leverage to chase bigger gains, it significantly increases the risk of catastrophic losses.
4. Take Profits Regularly
One way to counteract greed is to develop a habit of taking profits regularly. When you set profit targets ahead of time, you can ensure that you lock in gains before they evaporate. Don’t wait for an unrealistic price surge. Exit trades once your profit target is reached, or scale out by selling a portion of your position as the trade progresses.
5. Practice Emotional Awareness
Being aware of your emotional state is crucial in trading. Take the time to self-reflect and recognize when greed is influencing your decisions. Keep a trading journal to track not just your trades, but also your emotions during the process. This will help you identify patterns and emotional triggers that lead to poor decisions.
Example: After a series of winning trades, you may feel overconfident and tempted to take bigger risks. By noting this in your journal, you can remind yourself to remain disciplined and not deviate from your plan.
6. Focus on Long-Term Success
Trading is a marathon, not a sprint. Focus on the long-term process rather than short-term profits. Greed often leads traders to forget that consistent, small gains compound over time. By shifting your mindset to long-term wealth-building, you’re less likely to take excessive risks or engage in reckless behavior.
Greed is a natural emotion in trading, but it can be highly destructive if not managed properly. The key to success lies in discipline, risk management, and a well-structured trading plan that aligns with your goals. By understanding the psychological drivers of greed and taking proactive steps to control it, traders can make more rational decisions, protect their capital, and increase their chances of long-term success.

Patience Pays Off: Key Strategies for Long-Term InvestorsInvesting is a fundamental pillar in building wealth and securing financial stability. Among the myriad strategies available, long-term investing stands out as one of the most reliable and rewarding. Unlike short-term trading, which seeks to capitalize on price fluctuations over days or weeks, long-term investing focuses on holding assets for several years, or even decades, to allow for substantial growth. This approach is deeply rooted in the principle of patience, which enables investors to navigate market volatility, leverage compounding returns, and achieve their financial goals.
Patience is more than simply waiting; it requires discipline, confidence, and the ability to withstand short-term market turbulence. For long-term investors, patience plays a key role in benefiting from compounding returns, reducing transaction costs, and minimizing tax liabilities. The patience-driven investor is less prone to impulsive decisions and is better positioned to reach financial success over time.
Understanding Long-Term Investing
Long-term investing involves purchasing and holding assets like stocks, bonds, mutual funds, or real estate for extended periods—typically five years or more. The main objective is to benefit from the growth of the investment over time, whether through capital appreciation, dividends, or interest. Unlike short-term strategies, which aim for quick profits, long-term investing emphasizes steady and sustainable growth.
Key to this approach is the power of compounding. Compounding occurs when earnings from investments are reinvested, generating additional returns. Over time, this snowball effect can lead to exponential growth. Long-term investing also benefits from lower transaction costs, as frequent buying and selling of assets is avoided. Furthermore, long-term capital gains are taxed at lower rates than short-term gains, offering additional financial advantages.
While long-term investing still carries risks, particularly during market downturns, it provides the potential for recovery and continued growth. In contrast, short-term investors may face higher volatility and risk due to frequent trades and quick shifts in market sentiment.
S&P500 from 1980 monthly chart
Advantages of Long-Term Investing
The long-term investing approach comes with several compelling advantages:
Compounding Returns: The most powerful advantage of long-term investing is the compounding effect, where reinvested earnings generate additional returns. The longer the investment period, the more significant the compounding becomes. Even modest returns can lead to considerable wealth over time.
Lower Costs: With fewer trades, long-term investors incur significantly lower transaction fees and commissions. This not only preserves capital but also enhances overall returns.
Tax Efficiency: Long-term capital gains are generally taxed at a lower rate than short-term gains, leading to more favorable after-tax returns. The buy-and-hold strategy reduces the frequency of taxable events.
Reduced Stress: Long-term investing minimizes the need for constant market monitoring, providing peace of mind. Investors don’t need to react to daily market swings, allowing them to remain focused on their long-term financial goals.
Alignment with Financial Goals: Long-term investing is well-suited for achieving major financial milestones, such as funding retirement, education, or home purchases. It provides a structured and systematic approach to accumulating wealth over time.
GC1! GOLD FUTURES From 1980 Monthly Chart
Why Patience is Essential in Long-Term Investing
Patience is the cornerstone of long-term investing, as it helps investors remain focused on their goals despite market fluctuations and emotional pressures. Here are key reasons why patience is critical:
1. Navigating Market Volatility
Financial markets are inherently volatile, with asset prices fluctuating due to economic data, geopolitical events, and shifts in investor sentiment. While short-term investors may react to these movements, long-term investors recognize that volatility is part of the market cycle. Patience allows them to ride out these fluctuations, avoiding impulsive decisions and giving their investments time to recover and grow. By not panicking during downturns, long-term investors can stay committed to their strategy and avoid selling assets at a loss.
2. Compounding Returns
Patience is vital in maximizing the benefits of compounding. Compounding requires time to work its magic, as reinvested earnings generate further returns. The longer an investor remains in the market, the greater the potential for compounding to significantly boost their wealth. Even modest annual returns can accumulate into substantial wealth over decades.
3. Behavioral Finance and Emotional Control
Investing often involves emotional decision-making driven by fear, greed, and market noise. Behavioral finance studies show that emotions like panic during market downturns or overconfidence during rallies can lead to poor investment decisions. Patience helps investors manage these emotions by keeping their focus on long-term goals rather than short-term market movements. Investors who remain patient and disciplined are more likely to make rational decisions that align with their overall strategy.
NDX Nasdaq 100 Index Monthly Chart
Strategies to Cultivate Patience in Investing
Maintaining patience as a long-term investor requires a combination of strategies that foster discipline and reduce emotional reactivity:
1. Set Realistic Expectations
Establishing clear, realistic financial goals helps investors stay grounded. Understanding that markets fluctuate and that significant returns take time can reduce impatience. Setting specific goals, such as saving for retirement over a 20- or 30-year period, provides a long-term perspective and a framework for measuring progress.
2. Regular Monitoring Without Overreacting
While it's important to monitor your portfolio, it’s equally important to avoid overreacting to short-term market moves. Periodic reviews, such as quarterly or annual check-ins, allow investors to assess performance without being influenced by daily volatility. By maintaining a big-picture view, investors can avoid impulsive decisions and stay on track with their goals.
3. Diversification
Diversification spreads risk across various asset classes, sectors, and regions, helping to reduce the impact of poor performance in any single investment. A well-diversified portfolio provides a smoother experience, allowing investors to remain patient even during periods of underperformance in certain areas.
4. Continuous Learning and Education
Staying informed about market trends and investment strategies helps investors feel more confident in their decisions. The more knowledge an investor has about market behavior, historical trends, and the benefits of long-term investing, the more patient they can remain during challenging times. Education empowers investors to understand that short-term volatility is part of the process.
Case Studies and Historical Examples
Several well-known examples illustrate the power of patience in long-term investing:
Warren Buffett: One of the most famous proponents of long-term investing, Warren Buffett has built his wealth through patience and disciplined investing. His purchase of Coca-Cola shares in 1988 is a prime example. Despite periods of market volatility, Buffett held his shares, allowing the company's growth and compounding returns to generate significant wealth.
KO Coca-Cola Monthly Chart
Index Funds: Index funds, which track major market indices like the S&P 500, demonstrate the benefits of long-term investing. Over decades, these funds have delivered solid returns, often outperforming actively managed funds. Investors who stay invested in index funds, even during market downturns, benefit from overall market growth.
Common Pitfalls and How to Avoid Them
While patience is key, there are common mistakes that can derail long-term investing:
Panic Selling: Investors who panic during market downturns often sell at a loss, only to see the market recover later. Staying patient and focused on long-term goals helps avoid this costly mistake.
Trying to Time the Market: Attempting to predict market highs and lows is a risky strategy that often leads to missed opportunities. Staying invested allows investors to benefit from overall market growth without the risk of mistimed trades.
Overtrading: Frequent buying and selling erode returns through higher transaction costs and taxes. A buy-and-hold approach helps preserve capital and reduces unnecessary trading.
Conclusion
Patience is not just a virtue in long-term investing—it is a necessity. By maintaining discipline, staying focused on long-term goals, and avoiding emotional reactions to market volatility, investors can harness the full potential of compounding returns and achieve financial success. The strategies of setting realistic expectations, diversifying, and staying informed provide the foundation for a patient, long-term approach to wealth building. Through patience, long-term investors can navigate the ups and downs of the market and emerge with a stronger financial future.

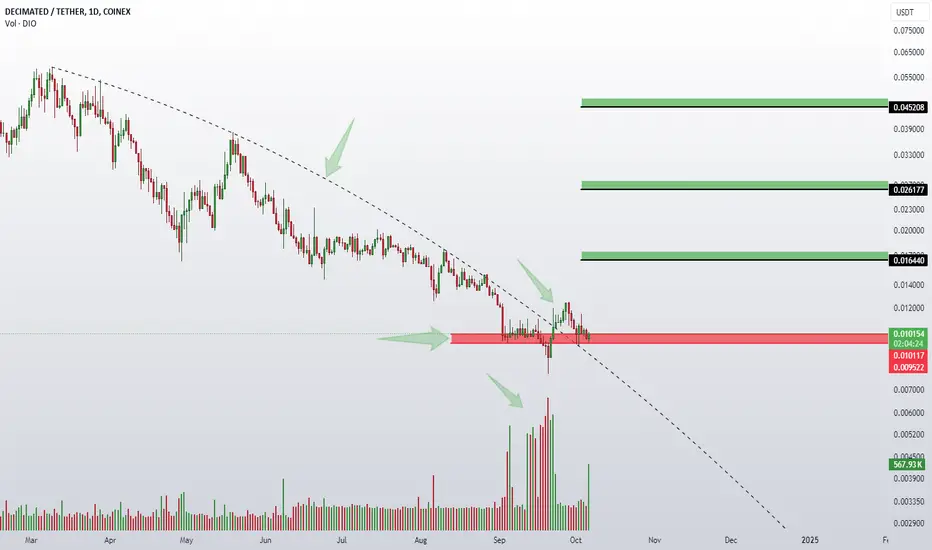
4 basic conditions for entering a profitable growthIn order to be able to enter into a transaction with high profit and at the right time, we need 4 conditions.
4 conditions for entering a profitable deal:
1. Accurate identification of the price floor
2. Volume on this price floor
3. Breaking the trend curve
4. Pullback to the broken trend curve
Don't forget to boost and follow.
HDFC Bank in a Bearish Momentum: Key Resistance and Support ZoneHDFC Bank in a Bearish Momentum: Key Resistance and Support Zones
NSE:HDFCBANK is currently exhibiting a negative trend, facing downward pressure near key levels:
Resistance Zones: 1706 / 1716 / 1726 – These levels could act as significant barriers, with potential sell-offs if the stock fails to breach these zones.
Short-Term Support Levels: 1645 / 1595 – A break below these support zones could accelerate the downside move, signaling further weakness in the stock.
As market volatility increases, it’s crucial to observe price action around these levels to anticipate the next move.
Disclaimer: I am not a SEBI-registered Research Analyst. This analysis is solely for educational purposes. Please do your own research and consult a financial advisor before making any trading decisions.

A Detailed Guide for New Traders!Technical Analysis: A Detailed Guide for New Traders
Technical analysis (TA) is a trading method used to evaluate and predict the future price movements of assets like stocks, cryptocurrencies, commodities, or forex, by analyzing past market data, primarily price and volume. It differs from fundamental analysis, which looks at financial metrics like earnings, revenue, and overall economic conditions. For beginners, here’s a breakdown of technical analysis and its essential tools and concepts:
1. Price Charts: The Foundation of TA
Price charts are visual representations of an asset’s price over a specific period. There are different types of charts, but the most common are:
Line Charts: Show the closing prices over time.
Bar Charts: Display the open, high, low, and close prices (OHLC) for each period.
Candlestick Charts: Similar to bar charts but more visually intuitive, displaying the same OHLC data with colored “candles” for up or down movements.
Candlestick charts are the most popular among traders because they provide more information and are easier to interpret visually.
2. Key Concepts in Technical Analysis
a. Trends
A trend is the general direction in which the price of an asset is moving. Understanding trends is crucial in technical analysis because traders aim to follow the market’s momentum. There are three types of trends:
Uptrend: Prices are generally increasing, making higher highs and higher lows.
Downtrend: Prices are decreasing, making lower highs and lower lows.
Sideways Trend (Range): Prices move within a specific range without a clear upward or downward direction.
b. Support and Resistance
Support: A price level where an asset tends to stop falling due to increased buying demand.
Resistance: A price level where an asset tends to stop rising due to increased selling pressure.
These levels are essential for identifying potential entry and exit points for trades.
c. Moving Averages
Moving averages (MAs) are a simple way to smooth out price data over a specified time period to identify trends more easily. There are two main types:
Simple Moving Average (SMA): The average price over a set number of periods (e.g., 50-day or 200-day SMA).
Exponential Moving Average (EMA): Gives more weight to recent prices, making it more responsive to new information.
Traders use MAs to determine the overall trend, and crossovers (e.g., when a short-term MA crosses a long-term MA) are often seen as buy or sell signals.
3. Indicators and Oscillators
Indicators and oscillators are tools derived from price and volume data to help identify potential trends, reversals, and overbought or oversold conditions.
a. Relative Strength Index (RSI)
The RSI measures the magnitude of recent price changes to evaluate whether an asset is overbought or oversold. It ranges from 0 to 100:
Above 70: Overbought (price might be too high, possible reversal).
Below 30: Oversold (price might be too low, possible reversal).
b. Moving Average Convergence Divergence (MACD)
The MACD is a trend-following momentum indicator that shows the relationship between two moving averages of an asset’s price. It helps traders identify changes in the strength, direction, and momentum of a trend.
MACD Line: The difference between the 12-day and 26-day EMA.
Signal Line: A 9-day EMA of the MACD Line.
Histogram: Shows the difference between the MACD Line and the Signal Line.
A crossover between the MACD Line and the Signal Line can signal buying or selling opportunities.
c. Bollinger Bands
Bollinger Bands consist of a moving average (middle band) and two outer bands that are two standard deviations away from the middle. The bands expand and contract based on market volatility. When the price moves toward the upper band, the asset might be overbought, and when it moves toward the lower band, it might be oversold.
4. Chart Patterns
Chart patterns are formations created by the price movement of an asset, and traders use them to predict future price movements. Some common patterns include:
Head and Shoulders: A reversal pattern that signals a change from bullish to bearish or vice versa.
Triangles (Ascending, Descending, Symmetrical): Continuation patterns that suggest the price will break out in the direction of the current trend.
Double Top and Double Bottom: Reversal patterns indicating that the price may reverse its current trend after testing a support or resistance level twice.
5. Volume Analysis
Volume refers to the number of shares, contracts, or lots traded during a particular period. It can confirm trends or warn of potential reversals:
Rising volume during an uptrend confirms the strength of the trend.
Decreasing volume in a rising trend can indicate a weakening trend and potential reversal.
Volume spikes often occur at trend reversals.
6. Risk Management
No trading strategy is foolproof, and technical analysis is not a crystal ball. To succeed, you must manage your risk:
Stop-Loss Orders: Automatically sell a position if the price moves against you by a certain amount, limiting your losses.
Risk-Reward Ratio: Determine the amount you're willing to risk for a potential reward. A typical ratio is 1:2, meaning for every $1 risked, you aim to make $2 in profit.
Position Sizing: Only risk a small percentage of your total capital (e.g., 1-2%) on a single trade to prevent significant losses.
7. Combining TA with Fundamental Analysis
While technical analysis is valuable, many traders combine it with fundamental analysis to get a complete picture. For instance, in the stock market, technical analysis might show that a stock is oversold, but if the company’s fundamentals (earnings, revenue) are strong, it could be a buying opportunity.
8. Conclusion
Technical analysis is a powerful tool for traders to predict price movements and make informed trading decisions. However, it requires practice and patience. Start with the basics, use demo accounts to test your skills, and never forget to manage your risk.
For beginners, mastering the key concepts like trends, support and resistance, moving averages, and common indicators like RSI and MACD will set you on the path to becoming a successful trader.
Like and follow if you found this helpful!
#Crypto #Bitcoin #bullrun

XAUUSD ANOTHER SETUP IN M30 IS READY | BEAR IN CONTROLHello, everyone! I hope you’re all doing well and ready to dive into today’s trading opportunities. I’m excited to share my analysis on XAUUSD and discuss a potential setup that I believe could be quite rewarding for us.
As we assess the current market landscape, it’s clear that xauusd has recently grabbed all buy-side liquidity. This movement indicates a potential shift in market sentiment and opens the door to bearish momentum. With this in mind, I’m considering a short position on xauusd, with my entry point at 2575.
Here’s my detailed outlook:
Market Analysis: The price action we’ve seen suggests that buyers have exhausted their strength. With liquidity being tapped out, we’re now likely to see sellers take control, pushing prices lower. Historical patterns and current trends support this bearish outlook, making it an opportune moment to capitalize on potential downward movement.
Target Levels: For this trade, my first target is set at 2562, and I’m aiming for further downside to around 2548. These levels have shown significant support in the past, and I anticipate they will be crucial in this trading session.
Risk Management: To protect our investment, I’m implementing a stop loss at 2595. This provides us with a comfortable buffer, allowing for some market fluctuation while safeguarding our capital. It’s essential to have a clear risk management strategy in place, especially in volatile markets like xauusd.
Trade Execution: I encourage everyone to analyze this setup based on your own strategies and risk tolerance. Always ensure that your trade aligns with your overall trading plan. If you’re considering this trade, I recommend staying vigilant and watching for confirmation signals before entering.
Community Engagement: I want to take a moment to express my heartfelt gratitude for the incredible support and engagement you’ve shown for my ideas. Your feedback not only motivates me but also enriches our community. If you have insights, alternative perspectives, or questions about this setup—or if there’s anything else on your mind—please share in the comments! I’m eager to discuss and learn from all of you.
Looking Ahead: As we navigate today’s trading session, let’s remain focused and adaptable. The markets can change rapidly, and being prepared to adjust our strategies is key to success. Remember, trading is not just about making profits; it’s also about continuous learning and growth as traders.
Thank you all once again for being such a fantastic community! Together, let’s make the most of today’s trading opportunities. Here’s to a successful day ahead—let’s aim for those profits! 🚀💰✨
Happy trading, everyone!

EURUSD 1H TIMEFRAME ANALYSIS | SELL MEAL IS READY WHAT YOU THINKHello, everyone! I hope you’re all doing well and ready to dive into today’s trading opportunities. I’m excited to share my analysis on EURUSD and discuss a potential setup that I believe could be quite rewarding for us.
As we assess the current market landscape, it’s clear that eurusd has recently grabbed all buy-side liquidity. This movement indicates a potential shift in market sentiment and opens the door to bearish momentum. With this in mind, I’m considering a short position on eurusd, with my entry point at 1.11800.
Here’s my detailed outlook:
Market Analysis: The price action we’ve seen suggests that buyers have exhausted their strength. With liquidity being tapped out, we’re now likely to see sellers take control, pushing prices lower. Historical patterns and current trends support this bearish outlook, making it an opportune moment to capitalize on potential downward movement.
Target Levels: For this trade, my first target is set at 1.11450, and I’m aiming for further downside to around 1.11150. These levels have shown significant support in the past, and I anticipate they will be crucial in this trading session.
Risk Management: To protect our investment, I’m implementing a stop loss at 1.12200. This provides us with a comfortable 30-pip buffer, allowing for some market fluctuation while safeguarding our capital. It’s essential to have a clear risk management strategy in place, especially in volatile markets like eurusd.
Trade Execution: I encourage everyone to analyze this setup based on your own strategies and risk tolerance. Always ensure that your trade aligns with your overall trading plan. If you’re considering this trade, I recommend staying vigilant and watching for confirmation signals before entering.
Community Engagement: I want to take a moment to express my heartfelt gratitude for the incredible support and engagement you’ve shown for my ideas. Your feedback not only motivates me but also enriches our community. If you have insights, alternative perspectives, or questions about this setup—or if there’s anything else on your mind—please share in the comments! I’m eager to discuss and learn from all of you.
Looking Ahead: As we navigate today’s trading session, let’s remain focused and adaptable. The markets can change rapidly, and being prepared to adjust our strategies is key to success. Remember, trading is not just about making profits; it’s also about continuous learning and growth as traders.
Thank you all once again for being such a fantastic community! Together, let’s make the most of today’s trading opportunities. Here’s to a successful day ahead—let’s aim for those profits! 🚀💰✨
Happy trading, everyone!

XAUUSD 1H TIMEFRAME ANALYSIS | Looking Bearish Food!🌟 Welcome to Our Trading Community! 🌟
Hello, everyone! I hope you’re all doing well and ready to dive into today’s trading opportunities. I’m excited to share my analysis on XAUUSD (gold) and discuss a potential setup that I believe could be quite rewarding for us.
As we assess the current market landscape, it’s clear that gold has recently grabbed all buy-side liquidity. This movement indicates a potential shift in market sentiment and opens the door to bearish momentum. With this in mind, I’m considering a short position on gold, with my entry point at 2582.
Here’s my detailed outlook:
Market Analysis: The price action we’ve seen suggests that buyers have exhausted their strength. With liquidity being tapped out, we’re now likely to see sellers take control, pushing prices lower. Historical patterns and current trends support this bearish outlook, making it an opportune moment to capitalize on potential downward movement.
Target Levels: For this trade, my first target is set at 2567, and I’m aiming for further downside to around 2550. These levels have shown significant support in the past, and I anticipate they will be crucial in this trading session.
Risk Management: To protect our investment, I’m implementing a stop loss at 2594. This provides us with a comfortable 100-pip buffer, allowing for some market fluctuation while safeguarding our capital. It’s essential to have a clear risk management strategy in place, especially in volatile markets like gold.
Trade Execution: I encourage everyone to analyze this setup based on your own strategies and risk tolerance. Always ensure that your trade aligns with your overall trading plan. If you’re considering this trade, I recommend staying vigilant and watching for confirmation signals before entering.
Community Engagement: I want to take a moment to express my heartfelt gratitude for the incredible support and engagement you’ve shown for my ideas. Your feedback not only motivates me but also enriches our community. If you have insights, alternative perspectives, or questions about this setup—or if there’s anything else on your mind—please share in the comments! I’m eager to discuss and learn from all of you.
Looking Ahead: As we navigate today’s trading session, let’s remain focused and adaptable. The markets can change rapidly, and being prepared to adjust our strategies is key to success. Remember, trading is not just about making profits; it’s also about continuous learning and growth as traders.
Thank you all once again for being such a fantastic community! Together, let’s make the most of today’s trading opportunities. Here’s to a successful day ahead—let’s aim for those profits! 🚀💰✨
Happy trading, everyone!

Article Title: Is AI Just Hype?In the whirlwind of AI's rapid ascent, a critical question emerges: Is the hype surrounding AI justified, or are we witnessing a bubble fueled by inflated valuations and limited innovation? Let's delve deep into the AI industry, separating the signal from the noise and providing a sobering reality check.
The Super Micro Cautionary Tale
The financial woes of Super Micro Computer serve as a stark warning. Despite the soaring demand for AI hardware, the company's internal challenges highlight the risks of investing solely in market enthusiasm. This case underscores the importance of **industry openness** and **due diligence** in the face of AI's allure.
A Landscape of Contrasts
The broader AI landscape is a tapestry of contrasting narratives. While pioneers like DeepMind and Tesla are pushing the boundaries of AI applications, a multitude of companies are capitalizing on the hype with products lacking substance. This proliferation of **AI hype** has created a toxic environment characterized by inflated valuations and a lack of substantive innovation.
Market Dynamics and Future Prospects
As the market for AI hardware matures, saturation and potential price drops loom. NVIDIA's dominance may be challenged by competitors, reshaping the industry landscape. The future of AI, however, lies in the development of more sophisticated systems capable of collaboration and learning. The integration of **quantum computing** could revolutionize AI, unlocking solutions to complex problems that are currently beyond our reach.
Conclusion
The AI industry is a complex landscape, filled with both promise and peril. While the hype surrounding AI may be tempting, it's imperative to scrutinize each company's core innovation and value. As the market matures and competition intensifies, those who can deliver **real value** and **technological advancements** will ultimately prevail. The Super Micro case serves as a stark reminder that in the realm of AI, substance, not hype, is the true currency of success.

Can AI Revolutionize Healthcare?The convergence of artificial intelligence (AI) and healthcare is ushering in a new era of medical innovation. As AI models continue to evolve, their potential to revolutionize patient care becomes increasingly evident. Google's Med-Gemini, a family of AI models specifically tailored for medical applications, represents a significant leap forward in this direction.
Google's Med-Gemini's advanced capabilities, including its ability to process complex medical data, reason effectively, and understand long-form text, have the potential to transform various aspects of healthcare. From generating radiology reports to analyzing pathology slides and predicting disease risk, Med-Gemini's applications are vast and far-reaching.
However, the integration of AI into healthcare raises important ethical considerations. As AI models become more sophisticated, it is crucial to address concerns related to bias, privacy, and the potential for job displacement. A balanced approach that emphasizes human-AI collaboration is essential to ensure that AI is used to augment rather than replace human expertise.
The future of healthcare is undoubtedly intertwined with the advancement of AI. By harnessing the power of AI, we can unlock new possibilities for improving patient outcomes, enhancing medical research, and revolutionizing the way we deliver healthcare. As we continue to explore the potential of AI in medicine, it is imperative to approach this journey with a sense of both excitement and responsibility.

Why Large Language Models Struggle with Financial Analysis.Large language models revolutionized areas where text generation, analysis, and interpretation were applied. They perform fabulously with volumes of textual data by drawing logical and interesting inferences from such data. But it is precisely when these models are tasked with the analysis of numerical, or any other, more-complex mathematical relationships that are inevitable in the world of financial analysis that obvious limitations start to appear.
Let's break it down in simpler terms.
Problem in Math and Numerical Data Now, imagine a very complicated mathematical formula, with hundreds of variables involved. All ChatGPT would actually do, if you asked it to solve this, is not really a calculation in the truest sense; it would be an educated guess based on the patterns it learned from training.
That could be used to predict, for example, after reading through several thousand symbols, that the most probable digit after the equals sign is 4, based on statistical probability, but not because there's a good deal of serious mathematical reason for it. This, in short, is a consequence of the fact indicated above, namely that LLMs are created to predict patterns in a language rather than solve equations or carry out logical reasoning through problems. To put it better, consider the difference between an English major and a math major: the English major can read and understand text very well, but if you hand him a complicated derivative problem, he's likely to make an educated guess and check it with a numerical solver, rather than actually solve it step by step.
That is precisely how ChatGPT and similar models tackle a math problem. They just haven't had the underlying training in how to reason through numbers in the way a mathematics major would do.
Financial Analysis and Applying It
Okay, so why does this matter for financial analysis? Suppose you were engaging in some financial analytics on the performance of a stock based on two major data sets: 1) a corpus of tweets about the company and 2) movements of the stock. ChatGPT would be great at doing some sentiment analysis on tweets.
This is able to scan through thousands of tweets and provide a sentiment score, telling if the public opinion about the company is positive, negative, or neutral. Since text understanding is one of the major functionalities of LLMs, it is possible to effectively conduct the latter task.
It gets a bit more challenging when you want it to take a decision based on numerical data. For example, you might ask, "Given the above sentiment scores across tweets and additional data on stock prices, should I buy or sell the stock at this point in time?" It's for this that ChatGPT lets you down. Interpreting raw numbers in the form of something like price data or sentiment score correlations just isn't what LLMs were originally built for.
In this case, ChatGPT will not be able to judge the estimation of relationship between the sentiment scores and prices. If it guesses, the answer could just be entirely random. Such unreliable prediction would be not only of no help but actually dangerous, given that in financial markets, real monetary decisions might be based on the data decisions.
Why Causation and Correlation are Problematic for LLMs More than a math problem, a lot of financial analysis is really trying to figure out which way the correlation runs—between one set of data and another. Say, for example, market sentiment vs. stock prices. But then again, if A and B move together, that does not automatically mean that A causes B to do so because correlation is not causation. Determination of causality requires orders of logical reasoning that LLMs are absolutely incapable of.
One recent paper asked whether LLMs can separate causation from correlation. The researchers developed a data set of 400,000 samples and injected known causal relationships to it. They also tested 17 other pre-trained language models, including ChatGPT, on whether it can be told to determine what is cause and what is effect. The results were shocking: the LLMs performed close to random in their ability to infer causation, meaning they often couldn't distinguish mere correlation from true cause-and-effect relationships. Translated back into our example with the stock market, one might see much more clearly why that would be a problem. If sentiment towards a stock is bullish and the price of a stock does go up, LLM simply wouldn't understand what the two things have to do with each other—let alone if it knew a stock was going to continue to go up. The model may as well say "sell the stock" as give a better answer than flipping a coin would provide.
Will Fine-Tuning Be the Answer
Fine-tuning might be a one-time way out. It will let the model be better at handling such datasets through retraining on the given data. The fine-tuned model for sentiment analysis of textual stock prices should, in fact, be made to pick up the trend between those latter two features.
However, there's a catch.
While this is also supported by the same research, this capability is refined to support only similar operating data on which the models train. The immediate effect of the model on completely new data, which involves sentiment sources or new market conditions, will always put its performance down.
In other words, even fine-tuned models are not generalizable; thus, they can work with data which they have already seen, but they cannot adapt to new or evolving datasets.
Plug-ins and External Tools: One Potential Answer Integration of such systems with domain-specific tooling is one way to overcome this weakness. This is quite akin to the way that ChatGPT now integrates Wolfram Alpha for maths problems. Since ChatGPT is incapable of solving a math problem, it sends the problem further to Wolfram Alpha—a system set up and put in place exclusively for complex calculations—and then relays the answer back to them.
The exact same approach could be replicated in the case of financial analysis: Once the LLM realizes it's working with numerical data or that it has had to infer causality, then work on the general problem can be outsourced to those prepared models or algorithms that have been developed for those particular tasks. Once these analyses are done, the LLM will be able to synthesize and lastly provide an enhanced recommendation or insight. Such a hybrid approach of combining LLMs with specialized analytical tools holds the key to better performance in financial decision-making contexts. What does that mean for a financial analyst and a trader? Thus, if you plan to use ChatGPT or other LLMs in your financial flow of analysis, such limitations shall not be left unattended. Powerful the models may be for sentiment analysis, news analysis, or any type of textual data analysis, numerical analysis should not be relayed on by such models, nor correlational or causality inference-at least not without additional tools or techniques. If you want to do quantitative analysis using LLMs or trading strategies, be prepared to carry out a lot of fine-tuning and many integrations of third-party tools that will surely be able to process numerical data and more sophisticated logical reasoning. That said, one of the most exciting challenges for the future is perhaps that as research continues to sharpen their capability with numbers, causality, and correlation, the ability to use LLMs robustly within financial analysis may improve.

Hidden Costs of Trading You Must Know
In this educational article, we will discuss the hidden costs of trading.
1 - Brokers' Commissions
Trading commission is the brokers' fee for opening a trading position.
Usually, it is calculated based on the size of the trade.
Though most of the traders believe that trading commissions are too low to even count them, the fact is that trading on consistent basis and opening a couple of trading positions weekly, the composite value of commissions may cut a substantial part of our profits.
2 - Education
Of course, most of the trading basics can be found on the Internet absolutely for free.
However, the more experienced you become, the harder it is to find the materials . So you typically should pay for the advanced training.
Moreover, there is no guarantee that the course/coaching that you purchase will improve your trading, quite often traders go through multiple courses/coaching programs before they become consistently profitable.
3 - Spreads
Spread is the difference between the sellers' and buyers' prices.
That difference must be compensated by a trader if one wished to open a trading position.
In highly liquid markets, the spreads are usually low and most of the traders ignore them.
However, being similar to commissions, spreads may cut the substantial part of the overall profits.
4 - Time
When you begin your trading journey, it is not possible to predict how much it will take to become a consistently profitable trader.
Moreover, there is no guarantee that you will become one.
One fact is true, you should spend a couple of years before you find a way to trade profitably, and as we know, the time is money. More time you sacrifice on trading, less time you have on something else.
5 - Swaps
Swap is the fee you pay for transferring a position overnight .
Swap is based on a difference between the interests rates of the currencies that are in a pair that you trade.
Occasionally, swaps can even be positive, and you can earn on holding such positions.
However, most of the time the swaps are negative and the longer you hold your trades, the more costly your trading becomes.
The brokers' commissions, spreads and swaps compose a substantial cost of our trading positions. Adding into the equation the expensive learning materials and time spent on practicing, trading becomes a very expensive game to play.
However, knowing in advance these hidden costs, the one can better prepare himself for a trading journey.

GBPUSD: Spotting the Next Big MoveKey Insights
Upward Trend: The overall trend for GBPUSD remains bullish.
Resistance Levels: 1.3200 and 1.3250 are significant resistance levels. A breakout above these levels could signal further upside potential.
Support Levels: 1.3000 is a key support level. A break below this level could indicate a potential reversal.
Economic Indicators: Keep an eye on economic indicators from both the UK and the US, as they can significantly impact the exchange rate.
Bearish Perspective
Key Points:
Overbought Conditions: GBPUSD might be approaching overbought conditions on certain technical indicators. A pullback could be expected.
Resistance Breakout Failure: If the pair fails to break above the 1.3200 resistance level multiple times, it could signal a potential reversal.
Economic Data: Weak economic data from the UK or strong data from the US could weaken the GBP.
Sell Levels:
1.3200 (resistance)
1.3300 (stronger resistance)
Potential Swing Trade:
Buy on Pullback: If the pair pulls back to the 1.3000 support level, consider buying with a stop-loss below the support. The target could be the next resistance level around 1.3250.
Bullish Perspective
Key Points:
Upward Trend: The overall trend remains bullish, and a breakout above the 1.3200 resistance level could trigger a significant rally.
Positive Economic Indicators: Strong economic data from the UK or weak data from the US could support the GBP.
Technical Indicators: A bullish crossover on a moving average or a positive divergence on an oscillator could reinforce the bullish outlook.
Buy Levels:
1.3000 (support)
1.2800 (stronger support)
Bullish Strategy:
Buy on Pullback: If the pair pulls back to the 1.3000 support level, consider buying with a stop-loss below the support. The target could be the next resistance level around 1.3250.
By combining technical analysis with fundamental factors, you can make more informed decisions about your GBPUSD trades.
Remember: [/b ]Swing trading involves holding positions for a few days or weeks. It's essential to have a well-defined risk management strategy in place. Remember to stay alert for potential market manipulations (Inducements), especially around support and resistance levels. These can often occur during significant events or flash news. Avoid getting caught in these traps by carefully analysing the market using price action.
Disclaimer: This analysis is based on current market conditions and may change. It's essential to conduct your own research before making any investment decisions.

20240822 6JU20241) Did I follow my plan?
A) Entry
B) Exit
2) What mistakes did I make?
3) What could I have done better?
4) What rules will help me with the above?

20240822 CLV20241) Did I follow my plan?
A) Entry
B) Exit
2) What mistakes did I make?
3) What could I have done better?
4) What rules will help me with the above?

$NSE:TATAELXSI Learnings - Time correction/opportunity costNSE:TATAELXSI
🔰Analyzing Tata Elxsi: A Case of Valuation & Earnings Stability ⤵️
🔰 PE Ratio Halved: From 100 to 50
✅ The PE ratio dropped from around 100 to 50, signaling a shift in market sentiment or correction from an overvalued state.
🔰 Timewise Correction, Not a Price Drop
✅ The stock has gone through a timewise correction with sideways movement instead of a steep decline.
↳ This often indicates consolidation after a significant rally.
🔰 Earnings Stability
✅ Despite the PE decline, EPS (Earnings Per Share) remains stable or slightly increasing.
↳ A positive indicator that the company’s earnings capacity is intact.
🔰 Market Sentiment vs. Fundamentals
✅ The PE ratio drop without a corresponding decrease in earnings shows a recalibration of growth expectations.
↳ Remember, valuation and market sentiment can diverge from a company’s actual performance.
🔰 Timing is Key
✅ Entering when valuation is high can lead to modest returns, even if the company performs well.
↳ Patience and strategic timing are crucial.
🔰 Long-Term Perspective
✅ Tata Elxsi’s stable earnings during a timewise correction show the benefits of holding strong fundamentals over short-term volatility.
🔰 Strategic Takeaway
✅ Look beyond PE ratios—understand the business, sector dynamics, and macroeconomic factors.
↳ Align your investment strategy with market conditions and company performance.

20240815 6BU20241) Did I follow my plan?
A) Entry
B) Exit
2) What mistakes did I make?
3) What could I have done better?
4) What rules will help me with the above?

20240815 HGU20241) Did I follow my plan?
A) Entry
B) Exit
2) What mistakes did I make?
3) What could I have done better?
4) What rules will help me with the above?

20240814 6JU20241) Did I follow my plan?
A) Entry
B) Exit
2) What mistakes did I make?
3) What could I have done better?
4) What rules will help me with the above?

20240814 CLU20241) Did I follow my plan?
A) Entry
B) Exit
2) What mistakes did I make?
3) What could I have done better?
4) What rules will help me with the above?

20240814 6CU2024Did I follow my plan?
- Entry
- Exit
What mistakes did I make?
What could I have done better?
What rules will help me with the above?

20240813 MNQU24Did I follow my plan?
- Entry
- Exit
What mistakes did I make?
What could I have done better?
What rules will help me with the above?
