AUDNZD range scalpFor learning purposes for myself.
First time trying a long scalp in the range of this AUDNZD, expecting to try the resistance in this one.
I used the pretty tight stop en take profit as in the chart.
Thanks for reading and I would appreciate some feedback about your view.
Learning

Using A Manual Stop Loss For Beginners @alanmasters (Learning)Hello my dear supporter, Alan Masters here and I want to share a few details about stop losses, the different types and how to better interpret them to maximize potential profits and reduce potential losses when trading with me.
Manual Stop Losses
Right now we are using what I call a "manual stop loss" and I will explain to you why.
Trading cryptocurrency isn't that easy, conventional markets are way easier to trade. Here the cycles are faster and the bots are more advanced, there are many ways that beginners can get lost in the simple actions that are: buy, sell and hold.
The purpose of a stop loss is to close a trade if the trend changes or is certain to change. Meaning, if we are aiming for a target to the upside and the price of an altcoin starts to go down, we close our trade when we confirm that the price will continue falling rather than bounce and go up. This confirmation normally happens where we analysts place our stop loss.
Now, it happens that the same place where a change of trend can be confirmed is also where support is found, in the example above. So imagine the price of the altcoin you are trading quickly going down and hitting support. A conventional stop loss would get activated and you lose your money, but with a manual stop loss, you don't close the trade unless the candle closes below the stop loss price. So in the case that the price is hit but quickly bounces, then there is no need to close the trade as the uptrend will be resumed.
I will share some charts to make it easier to understand why we use a manual stop loss.
First example:
Imagine your stop loss is set at $3579. BTCUSD goes down and hits this price, your trade is stopped and you lose money, but the price quickly bounces up.
With the manual stop loss, you would have to have the candle close below $3579, meaning at least $3578. And the candle on the chart above would look completely red/yellow (negative).
This manual stop loss requires more work as it needs to be checked manually, but this is something necessary when trading crypto as the markets are very volatile.
Other types of stop loss
The basic stop loss is the one where your trade gets closed as soon as a certain price level is hit. If you use this type of stop loss when trading cryptocurrency, I would suggest placing the stop loss at least 5-8% below the actual support.
One final strategy to take your stop loss effort even further, more advanced, is the full candle close below support.
This is a method that I highly recommend as well. For some people it isn't enough to close below support to confirm the trend change, they expect to see a full candle close below support before closing their trades. Taking it even further, you can look for big volume and any type of bearish candlestick or candlestick pattern for additional confirmation.
Piece of advice
We use a stop loss in order to avoid losing money in the case our trade goes wrong. The stop loss is not meant to indicate if the trade is active or not, or if I got it right or wrong... That's not the purpose, we are here to make money.
If you are trading and learning you can always adapt to the moment and make your own decisions based on what you see and not what is written. For example, if a stop loss is hit by 3 satoshis or few cents (in USD) but you notice that the price will move back up, you can keep your trade.
The purpose of the stop loss is to cut your loses but not to close a valid trade.
So take into consideration the market, the charts, signals and everything that is going on. You can also contact me and send me the PAIR you are looking at and I will be happy to help.
For beginners, you can simply follow our trade instructions and start creating your own strategy as you get used to these markets.
Thanks a lot for reading.
Namaste.

IBM in a bearish rising wedge?Looks like the IBM shows us a bearish rising wedge.
Definitely something to look out for, let's keep an eye on it if it works and if yes how much drop we could expect. For now I expect some pullback to a support at approximately 115$.
Since I'm still learning I'm not trading this.
If you feel the same give me some feedback I'm glad to hear from you guys!
Give a like if you feel I'm right.

USDCAD SELLHI, learning trader I have drawn support and resistance starting from a monthly timeframe.
Looking at the daily timeframe I can see price is approaching strong montly resistance and bullish momentum is decreasing as shown by a longer wick on the most recent candle
I believe this is a potential short once we get conformation.
please leave critisim


Technical Analysis 101!!SELF DEVELOPMENT/METHODOLOGY/PSYCHOLOGY
Technical Analysis 101!!
Interpreting the candlestick
This type of chart is an extension of the bar chart as discussed and is actively utilised by
the investors in China for more than 500 years of time period. It helps in providing the
information regarding open, close, low and high in the dimensional format. It can be seen that
the vertical axis of the chart helps in providing information on the prices of the FOREX whereas
the horizontal axis represents the time period. The white candles are the representation of the
advances of the currency and the black candles, on the other hand, represents the decline in the
value of the FOREX. Moreover, the body denotes the thick portion of the candle, and the vertical
line represents the wick. This chart helps the investor to forecast the future price movement of
the FOREX.
b) Charting systems
In the mind of a few people, charts are the exemplary image of the trader’s speciality. The
experienced eye can make ups and down. Charting is a questionable piece of the fund. Future
research is probably going to reveal things about outlining that would amaze people today. All
things considered, even individuals who eagerly restrict the training are ought to be acquainted
with the essential techniques of charting.
Follow your Trading plan, Remain disciplined and keep learning !!
Please Follow, Like,Comment & Follow
Thank you for your support :)
This information is not a recommendation to buy or sell. It is to be used for educational purposes only!

Achieve Financial Security through Self DevelopmentSELF DEVELOPMENT/METHODOLOGY/PSYCHOLOGY
Achieve Financial Security through Self Development
What skill set will you further develop over the next 90 days?What books will you read? What courses will you take? State specifically your personal development action plan for the 90 days...(your personal development is an ongoing process)............................
Strengths and Weaknesses
1. What are your skills?
...................................................
2. Do you tend to be compulsive?
...................................................
3. How much social contact do you need?
...................................................
4.Can you work by yourself day after day? Do you need other people around you?
....................................................
5.What are your psychological strengths and weaknesses? In terms of trading system development?
....................................................
6. Do you have deadlines to meet in your trading?
....................................................
7. And lots more..............................
Please let me know if you have any questions or would like to know more
Happy trading :)
"Invest 3% of your income in yourself (self development) in order to guarantee your future" Brian Tracy

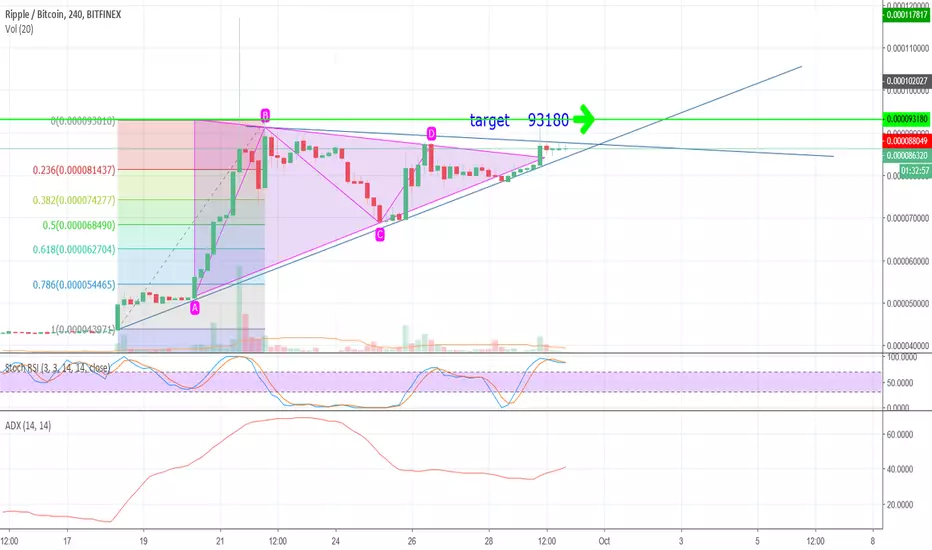
looking @ another xrp jump/ what do you think? if you are going to be an ass just stay away, looking at the 4 hour will we see retest and climb?
could this be the next line of climb that xrp gives us? what are your thoughts and projections?

xrp looking up and long EOY xrp looking like it might take a short bounce and test some support levels before moving up even more
Fiber short ideaOB that led to the break in structure, looks like fiber wants to retest it again. Could prove to be a good 4R short opp

XRP Bull FlagXRP isn't done yet as it seems.
Nice bull flag with 20% profit potential. I already bought at 0.26 but thinking of strengthening my position right now.
Any ideas on this? i'm a novice so feedback is most welcome.

BTC Bullish Falling WedgeI'm learning to trade to forgive me if i'm totally wrong.
To me this seems like a falling wedge, all the signs seem to point toward it.
Oktober has been a month where bitcoin turns around so i'm hoping to see this happen around 15th of oktober.
Also if we make one more lower low there will be a lot of shorting going on which can trigger a massive short squeeze when price picks up even a little, leading up to a lot of buying volume which will confirm the pattern.
Anyone care to comment?


Learning! Chart Number three! Trying to learn analyzing to get better at forcasting and choosing my next profitable targets! Please do bare with me and point out mistakes, other possibnlities, opinions! anything that would be a great help! Thanks
EUR/USD IdeaOnce again, just going of the basic of indicators, low support at about 1.15150 looking to bounce off and rise

Waiting for Profits!Entry - 15.58256
SL -15.53650
Target 1-15.66358
Target 2- 15.71922
Don't follow my trades with out your own research this is just for fun.

Appen Prediction (ASX:APX)Good morning all,
Here is my personal opinion on the future of the heavily publicised, machine learning company, Appen.
By looking at the trend line across a history of lows it shows that the position we are currently in is quite a major moment.
In my opinion 1 of the 2 options below will occur:
Option 1: Price bounces back, bottoming at around $11.15 before rising back up on another wave
Option 2: Price continues downfall, breaks trend line and retests supports at the $10 mark
Disclaimer: Please take all of my ideas with a grain of salt as these are mostly for me to look back and reflect so I can learn and grow as a trader :)
Wishing a good day to you all,
Kyle

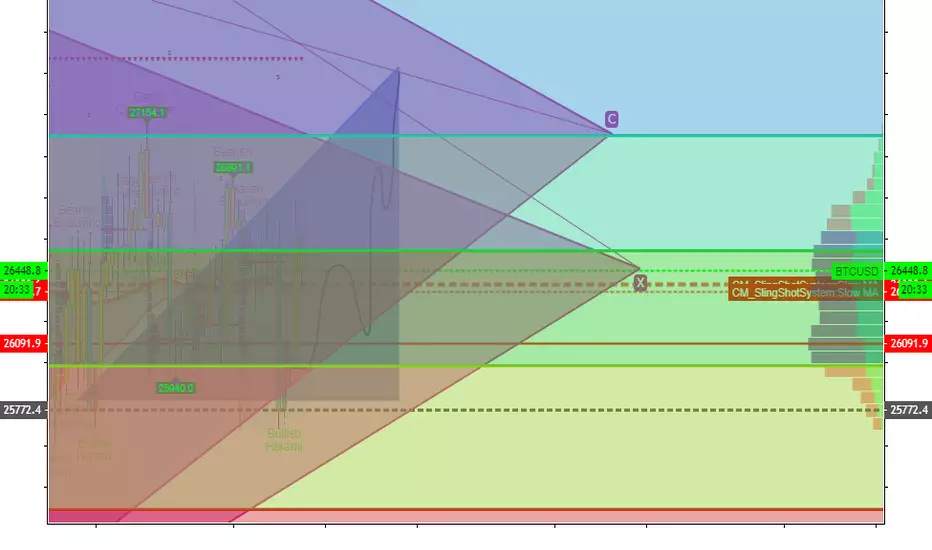
BTCUSD - Bitcoin approaching the first CenterlineWe see two opposing forces.
The orange A/R lines and the white Fork.
The orange dashed Centerline will be first resistance.
But the good news is, that if price can manage to jump above the orange Centerline, then the next target is the white Centerline.
And once above the white Centerline, stage #3 is the orange U-MLH (Upper-Medianline-Parallel).
This is a natural way how Bitcoin comes to live again, producing swinging volatility which we can trade with simple rules.
Happy harvesting §8-)
P!
If you like to learn more about the Pitchforks and how they produce great trades, then here's how you can get your free beginners course:
1. Klick the link at the bottom of this post (on TradinvView.com) to get to our website.
2. Register for the FREE MEMBERSHIP
3. Login and start the course
Happy learning & earning.


CHF/JPY: POSSIBLE ABCD PATTERN!**DISCLAIMER**
DO NOT TAKE THIS AS A BUY OR SELL SIGNAL. THIS IS MY VIEW FOR THE MARKET!
Hi everyone,
As you can see on the chart, there might be a possible ABCD pattern going on. Not only that, there also was a double-top spotted!
Before we go into the possible ABCD pattern, i want to take a look at the support that became a resistance later on. It spiked back to the previous top, which formes a double-top! So, support became resistance. That gave me a clear reason to think it might go down further! So why do i want to short at the resistance level? Because that was previous support. Support becomes resistance remember! The resistance level is also close to a 61.80% fib retracement level! Cool right? ;)
To make things clear and short: It might go a little bit above my short order but, i dont see any reason to "panic" then. Because it needs to break the 100% fib retracement level, and ofcourse: HIT MY STOP-LOSS. I don't want to make this analysis description any longer, let the picture further speak for itself :)
(This is just the paper-trading. I do not invest real money in this trade!)
Once again, do not take this as a buy or sell signal. If you do, i am not responsible.
Thank you for taking your time. If i made a mistake, drop a comment with a argument. If something is unclear to you, or if you have any questions left, please drop a comment too :)
StenB.

GBP/JPY: My view for this trade :)**DISCLAIMER**
DO NOT TAKE THIS AS A BUY OR SELL SIGNAL. THIS IS MY VIEW FOR THE MARKET!
Hi everybody,
This is my first trading idea that i post on TradingView. Please note that i am 16 years old and still in a learning process :) anyways, here's the info:
So as you can see there is a double-bottom and a double-top. i illustrated it with the blue and red lines (and the black lines on the swing high and on the swing low). The white box represents the lows acted as support, which also gave me a reason to think it first goes to the previous resistance level (marked with a red arrow pointing down on the left side on your screen). And, the previous resistance level is also a 50% fib retracement, just to make things clear. After it hit the previous resistance level (50% retracement), i expect it to go to the previous support (and a resistance) level. That is marked with a green striped line.
( This is just the paper-trading. I do not invest real money in this trade! )
TP: 1.663 pips.
SL: 1.142 pips.
Risk/Reward Ratio: 1.46.
Once again, do not take this as a buy or sell signal. If you do, i am not responsible .
Thank you for taking your time. If i made a mistake, drop a comment with a argument. If something is unclear to you, or if you have any questions left, please drop a comment too :)
StenB.

potential right shoulder? GBPJPYForgive me if this is wrong as I am still learning, however would you say over the next few days a potential right shoulder is forming on the GBPJPY daily TF?

pound yen this is what I see the pound yen on a smaller scale could be doing lets see this week how it plays out
