What if we just ignore the crazy December FOMO push?I'm new to trading and have no idea what I'm talking about. This is more of a question than an analysis.
There seems to be a steady uptrend of BTC value if you ignore the December 2017 FOMO crazyness. Longer periods of time to me paint a clearer picture and it looks like HODL is the right approach.
If I compare my portfolio to December 2017, BTC is a terrible investment, but what about looking at the longer trend? It looks like it's up and going higher?
Is this a naive point of view?
Learning


PosibilidadesPosibilidades, una tecnica de scalping en la que rapidamente se puede obtener algún ingreso #Criptomonedas #Traiding

USDZAR Potential Retest & Long Term LongCurrently on a Weekly retest, will be expecting a Long trade once we get the reversal pattern completion. Currently in a Short down to bottom of range / Trend-line.

USDCHF Short on Retest of SupportPrice broke below both Weekly Trendline & Support level, failed retest on Friday and posting a nice flag now. Waiting for Candlestick action.

AUDCHF In Huge Demand Zone for newsNews can obviously go either way but the Aussie looks Bullish across most pairs. As always we wait for news to commence and buy/sell the first retracement.

AUDCAD Early H&S ShoutVideo explains it but the Trendline Slash has occured RSI shows price not likely to break back through now looking for a ranged Shoulder to form within Demand & Supply.

Phase Changes & Events So at one point in this video I get a bit mixed up in my thoughts. I think most publishers would delete it and not share it; but I'm not interestedd in protecting myself. I go off on a pretty long rabbit trail about Support and Resistance areas creating the phase changes that we're looking for. It is an important concept; and I think despite me mixing myself up at one point - I think I should share it with you
I hope you feel the same way. I hope you learned something with me!

Ripple XRP looks BULLISHI think we are close to moving in the upward direction. XRP looks very bullish in my eyes, a lot of energy building up towards the end of the triangle. I see XRP going over the $3.50 at the least.

EURUSDPrice is closing in to a strong support line(not the one that's close the the price though).
Wait and be patient on rejection/acceptance.

Time to Buy Altcoins with Crypto Regulation News Overseas?Investors seems to fearful of Regulators limiting Cryptocurrency access in China, Japan, & South Korea
Stellar has experienced quite a run up with a top coming around the $.90 level and support found at the $.57 level.
News from overseas may test the support with the 200-Day MA already broken & price action closing in on the 100-Day
What if traders could receive Machine Learning Buy/Sell signals that on a daily & weekly schedule to help with their Crypto decisions?
We think its a great time to move into that direction!

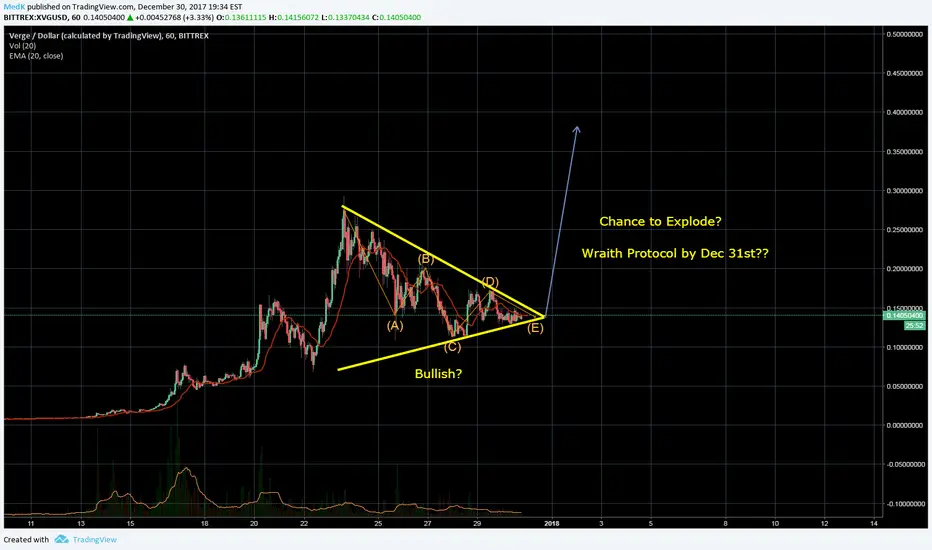
Is Verge breaking out of the Triangle?All signs lead to Verge breaking out, could be wrong though. Verge has been very volatile lately.


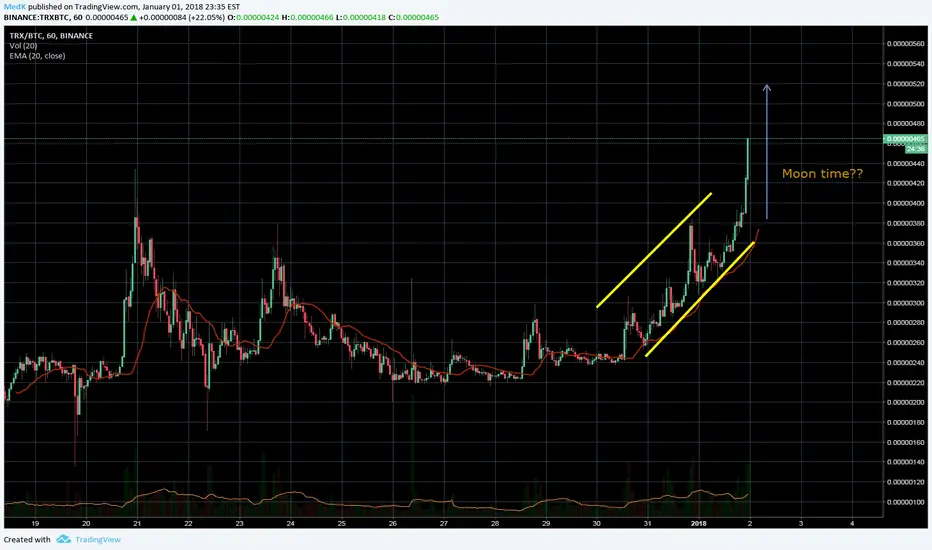
Tron TRX ready to Breakout Upwards?It looks like TRX Finally broke out from the downwards spiral! Broke away from both previous support levels. Let's see if the pattern turns out correct and TRX moves back upwards.


Ripple XRP Cup & HandleLooks like the Cup and Handle is completing. There is a potential for a big jump towards $3.50-4.00 !

CVC/BTC - ShortVery new to Trading View so apologies for the poor TA. This is how I feel $CVC Civic Coin will play out over the next few days. Starting to see the same resistance it felt last time before pushing all time highs. Solid support at .00008900. Once it breaks resistance at .00009500 its going to be blue skies and a new All Time High.
Keep your eyes on $BTC if it starts to run It may just sap the life out of altcoins such as Civic.

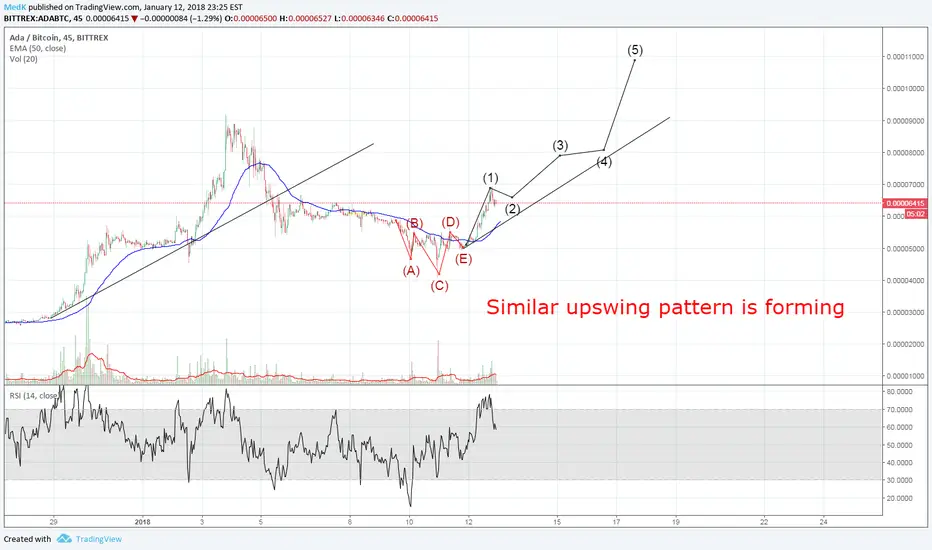
Similar pattern forming againMy last analysis on XRP regarding the similar trend pattern was correct. Now it looks like it will go into consolidation and keep it's upward trend.

Similar Pattern?Just a guess from a visual pattern I see. Plus I think with the bullish run Ripple has had, it will rebound to stay above the $2.00 mark.

Chance to Explode?I think it comes down to their Wraith Protocol Release, it has been promised to be released by December 31st. Also the this is the first full Triangle I see on their chart with Bullish signs. I'm Hodling and hoping all this FUD is actually FUD :) Verge to the moooooooonnnnn.