SUSHI - History Repeating Itself!Dear TradingView community and fellow traders,
I am Richard, also known as theSignalyst.
I find the SUSHI 🍣 daily chart intriguing , as it seems to be following the classic Wyckoff Cycle 📈.
If history repeats itself, we’ve just broken out of the accumulation phase ✅, highlighted in green 🟩.
As long as the bulls 🐂 remain in control, the markup phase may have just begun—potentially pushing SUSHI as high as $2.5 🚀.
❓ What's next?
Will SUSHI continue to trade higher from here, or will this cycle play out differently?
I hope you find this post useful, and I would appreciate your likes and support.
Which scenario do you think is more likely to happen first? and why?
📚 Always follow your trading plan regarding entry, risk management, and trade management.
Good luck!
All Strategies Are Good; If Managed Properly!
~Richard
Lending

TradeCityPro | AAVE: Key Triggers in DeFi Lending Giant's Trend👋 Welcome to TradeCity Pro!
In this analysis, I want to review the AAVE coin for you. The AAVE project is one of the largest DeFi projects, operating in the lending sector, and holds the highest TVL among all projects in this category.
✔️ Currently, the coin of this project has managed to achieve a $2 billion market cap and with this market cap, it ranks 39th on CoinMarketCap.
📅 Daily Time Frame
In the daily time frame, as you can see, after a long-term uptrend that reached up to 383.59, the price entered a corrective phase and, following the break of the 278.56 zone along with a descending trendline, dropped to the 124.31 level.
💫 The 124.31 support is a very strong one, and the price has reacted well to it. The buying candle volume has increased after the price reached this zone, which indicates the strength of this support.
💥 If this support breaks, the price could begin its next bearish leg. The next support that AAVE has in this time frame is at 77.45, which could prevent further decline in case of a sharp bearish move.
📈 For a long position or spot buy, we first need to wait for the descending trendline to break, and for the price to form a higher low and high above this trendline to confirm a trend reversal.
🔼 Currently, the main bullish trigger is at the 194.97 level, and if this level breaks, the price could move back toward the 278.56 and 383.59 zones.
📉 For a futures position, the 148.17 level is a suitable trigger and can offer a risky long position. However, the spot buy and main position trigger is the 194.97 level. A break of the 50 level on RSI would bring bullish momentum into the market and can serve as a good confirmation for a long position.
🧩 For a short position, breaking the 124.31 level is a good trigger, and if this level breaks and RSI enters the oversold zone, the price could make a sharp bearish move.
📊 But more important than all is the market volume, which currently doesn’t have a clear trend. We’ll have to see whether, upon breaking 124.31 or 148.17, sufficient volume enters the market or not.
📝 Final Thoughts
This analysis reflects our opinions and is not financial advice.
Share your thoughts in the comments, and don’t forget to share this analysis with your friends! ❤️

TradeCityPro | XVS: Tracking Its Trajectory in the DeFi Space👋 Welcome to TradeCity Pro!
In this analysis, I want to review the XVS coin, which you requested in the comments. This project is one of the DeFi projects with a market cap of $72 million, ranking 346th on CoinMarketCap.
📅 Weekly Timeframe
In the weekly timeframe, as you can observe, the price started a downtrend after reaching a peak in 2021, and this trend is still ongoing.
✨ Currently, there is a consolidation box from 3.34 to 17.61, and the price has been fluctuating between these two areas for almost three years.
✔️ In the previous weekly candle, the support at 5.45 was broken, and now the price is moving towards the support at 3.34. This support is very crucial, and its breach could trigger another sharp drop.
🔽 There is also a descending trend line that the price has touched twice, and after being rejected by this trend, a significant amount of selling volume entered the market and induced a momentum that led to the breach of the 3.34 support.
📈 For XVS to turn bullish, the only trigger we have for now is the break of the trend line and the activation of its trigger. The trend line trigger is currently at 9.09. However, if the price creates a new structure, we might confirm a bullish turn sooner.
🛒 For buying in spot, the first trigger is the break of 9.09, which is considered a risky trigger in this timeframe. The main trigger is after 17.61.
⚡️ However, as I have mentioned in recent Bitcoin analyses, altcoin triggers and even the Total2 in spot don't currently hold much significance. For buying altcoins in spot, we should wait until Bitcoin dominance turns bearish.
📅 Daily Timeframe
Let's move to the daily timeframe to observe the details of the price movement more closely.
🧩 In this timeframe, we have a curved trend line that the price has hit several times and fallen.
⭐ Currently, after breaking 4.95, we can apply a Fibonacci Extension to find potential support areas. The price has reached the 0.618 level and has tested it. This area might be able to prevent further price falls. Otherwise, the next supports will be at the 0.786 and 1 Fibonacci levels, with the 1 area overlapping with the 3.34 support.
💥 The RSI oscillator is close to oversell and if this oscillator break the 30 level,it will support the bearish movement.
🔼 For buying or a long position, a suitable trigger is the 6.25 area, which is both a significant support and the last peak formed after breaking the 4.95 floor. The main trigger for the start of the primary bullish trend will be at 11.79.
📝 Final Thoughts
This analysis reflects our opinions and is not financial advice.
Share your thoughts in the comments, and don’t forget to share this analysis with your friends! ❤️

Lending space has moved into pressure cooker recoveryAs the overall market and Ethereum falls we have seen price enter recovery phase
Recovery phase forming a 'pressure cooker' can be extremely powerful sign of stable recovery
The lending space has continued to boom with AAVE deposits at all time highs. Deposits keep increasing as Ethereum Foundation adds more ETH into AAVE
Keep an eye on how lending space moves within this forming pressure cooker

TradeCityPro | XVS : Navigating Market Dynamics👋 Welcome to TradeCityPro!
In this analysis, I want to review the XVS coin for you, as requested in the comments. So, I decided to analyze this coin in weekly, daily, and four-hour timeframes.
🔍 The Venus project is one of the DeFi projects active in Lend and Borrow, boasting a TVL of $1.88 billion, ranking it among the top platforms on the Binance network. It's one of the most reputable projects on this network. The project's coin, named XVS, offers additional capabilities on this platform through staking and holding.
📅 Weekly Timeframe
In the weekly timeframe, we see a very large range box starting from a floor of 3.34 and a ceiling at 17.61. XVS is considered a heavy coin due to a lot of staking and a significant number of whales and holders. This means it experiences fewer fluctuations because it has a large amount of money invested in it. Despite Bitcoin and other coins that are near or even above their previous ATHs, this coin is still in its consolidation box.
✨ Another very important support is at 5.45, which is crucial and the price has hit it several times. The market volume started to decrease after reaching the resistance at 17.61 but has increased again in recent weeks. This shows that whales are moving back towards this coin, increasing both the inflow and outflow of money, and consequently, the 24-hour volume has also increased.
🚀 If the price can stabilize above 17.61, we can expect the start of an upward trend and the price could move towards higher targets. The targets for this coin are at 38.73 and 141 dollars. Given the market cap of 137 million dollars, if the project becomes one of the successful crypto projects and attracts more holders and whales, the targets I mentioned will be attainable and not far-fetched.
⚡️ Another important note in the chart is that the 5.45 support, as I mentioned, is crucial, and if it breaks and the RSI also drops below 38.36, the situation for this coin will be very grim. We can expect the price to even break below the floor of 3.34 and move towards newer lows.
📅 Daily Timeframe
As you can see in the daily timeframe, after breaking 7.99, the price moved down to 4.98, but we observed a V pattern in the price that caused it to move back above 7.99. Given the large volume of buying seen in the candles, it seems a significant upward momentum has entered the market, and I believe if the price can continue upwards and break the 11.85 area, we can expect the next bullish leg and even the appropriate momentum to break the 1.49 to finally start the upward trend of this coin in higher cycles.
🔽 On the other hand, if the price forms a lower ceiling relative to 11.85 and moves back towards 4.98, if this area breaks, the next support will be at 3.33. In the RSI, for a bullish position and to confirm the upward trend, breaking the 70 area can give us a suitable confirmation, but for a downward momentum, I currently don’t have a specific trigger and we need to wait for the site and market structure to form to see what trigger it gives us for the entry of downward momentum.
⏳ 4-Hour Timeframe
Let's go to the 4-hour timeframe to specify the futures triggers. As you can see, we can observe the last bullish leg of the price in this timeframe with more details.
📊 After being supported at 4.87 and moving upwards, the price reached 9.10. As you see above, a divergence in the RSI has occurred. Despite the price hitting two identical peaks at 9.10, the RSI has made a lower peak, which could indicate a divergence. The divergence trigger, which was the 50 area, was activated in yesterday’s candle, and we can expect to see the effect of this divergence in the market.
💥 However, keep in mind that in bullish trends with very high momentum, the presence of divergence is due to the mathematical calculations of the RSI and is completely natural. So until the price falls below the 7.69 area, we will not see the effect of the divergence on the price, and the divergence we see will simply be due to the formula and mathematical calculations of the RSI.
🧩 If the 7.69 area breaks, the price might make deeper corrections down to the 0.382 and 0.618 Fibonacci levels, which correspond to areas of 7 dollars and 6.12 dollars respectively. For a long position, our task is very clear and has a good trigger. If the 9.10 area breaks, we can open a long position towards the 11.85 target.
📝 Final Thoughts
This analysis reflects our opinions and is not financial advice.
Share your thoughts in the comments, and don’t forget to share this analysis with your friends! ❤️

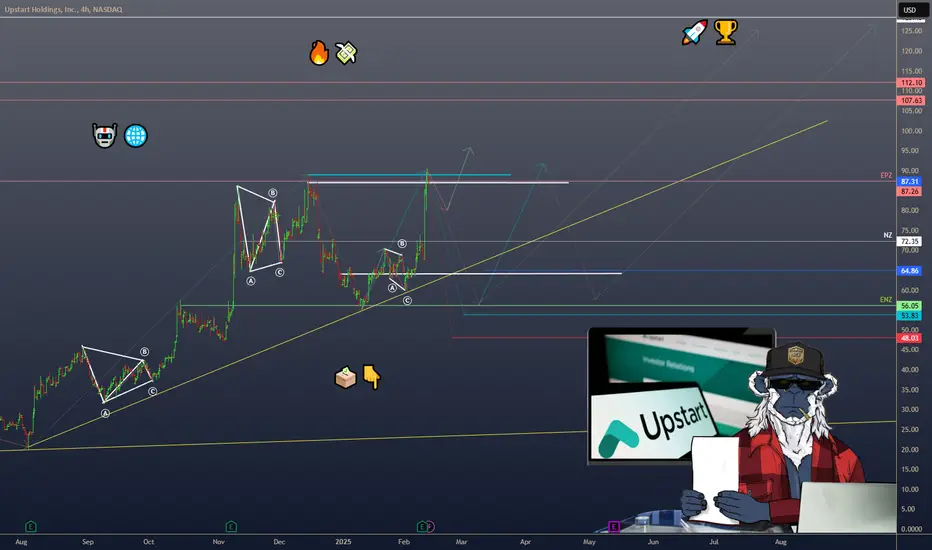
UPSTART ($UPST): AI-DRIVEN LENDING ON THE RISEUPSTART ( NASDAQ:UPST ): AI-DRIVEN LENDING ON THE RISE
1/8 – REVENUE & EARNINGS BLAST
• Q4 2024 revenue: $219M (+56% YoY) 🔥
• Powered by a 68% jump in loan originations 💸
• EPS: $0.26, beating estimates by $0.30 (analysts expected -$0.04) 🚀
• Positive Adj. EBITDA—Upstart’s inching closer to sustained profitability 🏆
2/8 – BIG FINANCIAL EVENTS
• Strong focus on AI model innovation + expanding funding supply 🤖
• Management bullish on earnings call—AI improvements = growth catalyst 🚀
• Renowned for bridging lenders & borrowers via advanced, automated credit assessments 🌐
3/8 – SECTOR COMPARISON
• Some valuation measures say overvalued (e.g., GF Value ~$28 vs. market ~$65) 🧐
• Outpacing fintech peers like SoFi, PayPal, Ally in revenue growth 📈
• Profitability & multiples (P/E, P/S) lag behind due to recent net losses 😬
• Unique AI-lending angle may justify a premium—if it pays off 💡
4/8 – RISK ASSESSMENT
• Partner Dependence: A few big lenders = high exposure ⚠️
• Economic Sensitivity: Loan defaults rise if consumer conditions worsen 🌪️
• Regulatory Hurdles: Shifting financial rules could dent operations 🏛️
• Credit Risk: Holding loans on the balance sheet—watch out in downturns 💥
5/8 – SWOT HIGHLIGHTS
Strengths:
• Advanced AI for credit analysis 🤖
• High automation in approvals ⚡️
• Scalable via partner expansions 🌍
Weaknesses:
• Limited operating history ⏳
• Recent financial losses 📉
• Reliance on key partners 🤝
Opportunities:
• New loan products (auto, HELOC, etc.) 🚗🏠
• Expanding digital lending market 🌐
• Gaining market share as AI evolves 🔬
Threats:
• Fierce fintech competition 🏁
• Possible regulatory changes ⚖️
• Macro headwinds affecting credit demand 🌩️
6/8 – UN/UNDERVALUATION DEBATE
• Some see big future potential → undervalued by growth prospects 💹
• Others worry about multiples & an over-reliance on economic upswings 😬
• Recovery depends on broader economic rebound & strong risk management 🏦
7/8 Is Upstart a gem or a risk?
1️⃣ Bullish—AI lending will transform fintech 🏅
2️⃣ Cautiously Optimistic—Need more stability 🤔
3️⃣ Bearish—Valuation & macro risks are too high 🚫
Vote below! 🗳️👇
8/8 – STRATEGY WATCH
• Keep tabs on new loan products & partnerships 🛠️
• Monitor economic indicators (defaults, credit demand) impacting revenue 💼
• Regulatory shifts can either boost or bury AI-lending advantage ⚠️
TradeCityPro | AAVE : Insights into the DeFi Lending Giant👋 Welcome to TradeCityPro!
In this analysis, I’ll delve into the AAVE token. The current market conditions are challenging, and finding good positions is difficult. Therefore, I’ll focus more on explaining the project and less on chart analysis.
🔍 About AAVE:
AAVE is a blockchain-based platform that allows users to deposit their assets as collateral and borrow against them. Since the platform operates on the blockchain, both collateral and loans are in the form of cryptocurrencies. A key parameter in this platform is the Health Factor, which is calculated based on the collateral amount and the borrowed amount. If this parameter falls below 1, the likelihood of liquidation increases significantly.
🔄 This platform enables users to borrow funds in a decentralized environment. Borrowed funds can be used directly or leveraged within the DeFi space for higher profits. However, this comes with specific risks, as highlighted earlier.
💸 AAVE generates revenue through interest rates charged to users. For instance, if a user supplies Ethereum to the platform, they earn a 5% return, while a borrower pays 7% interest. AAVE earns the 2% spread as its profit for mediating between the supplier and the borrower.
💰 Currently, the platform's Total Value Locked (TVL) stands at $19 billion, ranking second after Lido. This builds substantial trust among users. Due to its revenue model, AAVE is one of the few profitable crypto projects, enabling stakeholders to earn not only from token appreciation but also from platform-generated income.
🤝 Given AAVE's revenue model and the scarcity of profitable crypto projects, it has the potential to grow into one of the largest platforms in the crypto space. Already ranked second in TVL, it can further attract more users and expand its presence.
🔵 If AAVE continues to grow, its token could become one of the most critical assets in the market. With a market cap of $5 billion, AAVE currently ranks 30th by market cap. If its revenue remains stable and the project stays profitable, the token’s rank is likely to improve further.
📅 Weekly Timeframe: Strong Bullish Momentum and Parabolic Movement
In the weekly timeframe, there is a visible accumulation box with its ceiling at $130.24. After breaking this level, strong bullish momentum entered the market. Following a pullback and breaking the $202.63 resistance, the next significant resistance lies at $476.74.
📈 From the initial rise off the $51.76 low, the buying volume has surged significantly, validating the upward trend. The RSI entered the overbought zone after the break of $202.63, further propelling the price upward.
🚀 The $476.74 resistance is critical, coinciding with the ATH level. Breaking this level could lead to a new ATH. Currently, Fibonacci levels for subsequent targets cannot be determined until the price correction zones are identified. After completing the correction, further targets can be analyzed.
🔽 In a corrective scenario:
The first key zone is $202.63, especially if it aligns with the curved trendline, strengthening its significance.A deeper correction could reach $130.24, and breaching this level would end the bullish trend, signaling the start of a new market cycle.
✨ Breaking the $77.45 level would introduce bearish momentum, while a break of the $51.76 support could instill significant fear in the market, potentially leading to sharp price drops.
📅 Daily Timeframe: Signs of a Possible Correction
In the daily timeframe, the latest bullish leg can be examined in more detail. Currently, the price has hit the $381.71 resistance and is undergoing a correction after one test.
🔑 So far, the correction has not been deep, with the price shadowing to the 0.382 Fibonacci level and temporarily recovering. If the correction continues:
The 0.5 Fibonacci level is crucial and observable in lower timeframes.
📉 If both levels are broken, the next major support is $195.25, overlapping with the 0.786 Fibonacci level. This level is the last critical zone to maintain bullish momentum. Breaching it could bring bearish momentum into the market.
🔼 If the correction concludes and the $381.71 resistance is broken, the next resistance lies at $637.94. Breaking the 70 RSI resistance would reintroduce buying momentum. It is notable that the market volume hasn’t declined yet, which supports the bullish trend.
⏳ 4-Hour Timeframe: Futures Triggers
In this timeframe, I will focus solely on futures triggers since the higher timeframe scenarios are already analyzed.
🔽 After reaching the $381.71 resistance, the price entered a corrective phase, touching the 0.382 Fibonacci level before forming support at $295.77. Breaking this support would activate the first short trigger, though it is highly risky due to the overall bullish trend. Personally, I won’t take this position as the market trend is still upward.
💥 Another short trigger could emerge based on Dow Theory, but the market hasn’t yet established the necessary structure.
⚡️ For a long position, the primary trigger is the $381.71 resistance, which is a crucial level. I aim to open a long position if this resistance is broken to profit from the next upward wave. Since opening a position upon breaking this level is challenging, an early long trigger could be identified at $337.93. A break of $53.80, coinciding with the $337.93 resistance, could also provide a good opportunity for a long position.
📝 Final Thoughts
This analysis reflects our opinions and is not financial advice.
Share your thoughts in the comments, and don’t forget to share this analysis with your friends! ❤️ above.

AAVE - An underpriced gem I checked many different assets on the market and one of the most promising from both fundamental and technical points of view is BINANCE:AAVEUSDT
Currently ranked #47 at CMC it is the largest lending protocol. At only <$3 Bln. mkt cap its total lending volume is more than $10 bln. For sure during this bull run there will be a DeFi cycle and AAVE will not be left out.

TradeCityPro | XVS & Bitcoin : Key Levels and Insights👋Welcome to TradeCityPro!
In this analysis, I want to review XVS for you. This token is the native token of the Venus project, which operates on the BSC network and specializes in the DeFi sector. It boasts the highest TVL on this network. This platform allows users to collateralize their assets and borrow funds proportionate to their collateral. Currently, the platform's TVL stands at $1.8 billion, and XVS ranks 361 on CoinMarketCap.
👑 Before analyzing XVS, it's better to take a look at Bitcoin to better understand the market conditions. The Bitcoin analysis is done on the 4-hour timeframe.
⏳ 4-Hour Timeframe: Correction Phase in Bitcoin
On the 4-hour timeframe, after breaking the $72,771 resistance (the previous ATH), we witnessed a very sharp, high-momentum move up to $99,022. Currently, Bitcoin has entered a correction phase. The first significant support in this timeframe is $92,004, which overlaps with the 0.236 Fibonacci level. The price has already reached this level. At the same time, the SMA99 has also aligned with the candles in this area, turning this level into a very strong PRZ.
✨ The RSI oscillator has triggered divergence, exiting the lower Bollinger Band several times, which has eliminated the bullish momentum. However, the most important thing in a bullish market is that when the RSI approaches the 30 level, it often represents a good buying opportunity. Using the Bollinger Band indicator, we can better determine trend reversals and RSI triggers. However, all of these require price confirmation, which can be achieved through Dow Theory rules or short-term resistance breakouts.
📊 On the other hand, the volume of corrective candles is increasing, which is not a good sign for the correction's end and makes the bearish scenario more likely.
🔑 If the $92,004 support breaks, the next key support is $86,841, which aligns with the 0.382 Fibonacci level and is likely to serve as a major support during this correction. For now, I won't discuss other supports; if $86,841 is broken, I'll determine the rest later.
✅ XVS Analysis: Weekly and Daily Timeframes
📅 Weekly Timeframe: Long-Term Box
On this timeframe, the price previously formed a long-term box between $3.17 and $9.19. After breaking this range, a new box was formed between $5.29 and $17.43, where the price currently trades in the lower half of the box and is struggling with resistance at $9.19.
🔼 The previous weekly candle was very strong and powerful but couldn't break the $9.19 level. The current candle is also rejecting from this level. For spot buying, breaking this resistance or $17.43 is suitable. The potential targets are $40.22 and $140.26, with $140.26 being the ATH for this coin.
📉 In case of a drop, the first support is at $5.29, and on the RSI, there is a significant support level at 39.32, which can prevent a price decline. If this support is broken, the next level is $3.17, the all-time low for this coin.
📅 Daily Timeframe: Strong Resistance Zone
On the daily timeframe, the $9.19 resistance can be drawn as a range between $8.18 and $8.91, which is very important. Currently, the price is rejecting from $8.91 and has dropped to $8.18.
🔍 The main and significant support on this chart is the ascending trendline, which previously experienced a false breakout. If the price stabilizes below $8.18, the next corrective target will be reaching this trendline.
💣 If the trendline breaks, the next support is $5.98, which is a strong resistance since the market previously reversed from this level after a false trendline breakout and reached the $8.91 high.
🧩 If the RSI stabilizes above 66.27, the price can start pumping because it has already hit this level twice and been rejected. If the RSI breaks below 50, bearish momentum will enter the market, and the bearish scenario will strengthen.
📝 Final Thoughts
This analysis reflects our opinions and is not financial advice.
Share your thoughts in the comments, and don’t forget to share this analysis with your friends! ❤️

Hatom (HTM) - Promising small-cap crypto for yield in DeFiHatom (HTM) shows notable strength in the daily chart after breaking out from the 30-day exponential moving average (1D 30EMA) on August 19. What acted as a strong resistance from March to August (testing twice in the meantime) can now become strong price support moving forward - currently at ~$0.89 (the 30EMA).
The daily RSI also displays a strong uptrending momentum, at 62.77 by post time.
Fundamentally speaking, Hatom Protocol is one of the most solid and promising DeFi protocols I have found and experienced using in crypto. Hatom Labs, the core developer, is setting solid new standards by the way they do business (multiple tests, plenty of security audits, no rush to launch or make announcements, not trying to induce FOMO with marketing gimmicks, etc.)
They have recently made the 9th protocol update after one year of launch and this is another aspect I like about the project: Hatom Lab's communication strategy - clear of noise.
They reserve their comms for relevant announcements only, as security is their north star.
The recent announcement (which can be found on X @HatomProtocol) revealed some really exciting features ahead for yield farming/generation through liquidity, lending, and booster operations.
They are also launching a decentralized overcollateralized stablecoin called USH to compete with Sky's (formerly MakerDAO) DAI. Which, in my opinion, is very much needed and appreciated. We need more of these solid decentralized stablecoins around.
I'm invested in HTM for the mid- to long-term, but I also think that, right now, the token offers a good long opportunity, so I'm also longing it for the short-term, eyeing the ATH at a first target.
It's important to note that Hatom is a small-cap crypto, so beware of all the risks that come with this kind of asset.
It runs on the MultiversX (EGLD) chain, but are also planning to expand to other chains.
Can buy via the xExchange DEX and long on AshPerp.

#AAVEUSDT #1h (OKX Futures) Rising wedge breakdown and retestAave just printed a gravestone doji followed by a shooting star, seems likely to retrace down to 200MA support.
⚡️⚡️ #AAVE/USDT ⚡️⚡️
Exchanges: OKX Futures
Signal Type: Regular (Short)
Leverage: Isolated (5.0X)
Amount: 4.5%
Current Price:
95.44
Entry Targets:
1) 95.87
Take-Profit Targets:
1) 87.43
Stop Targets:
1) 100.10
Published By: @Zblaba
CRYPTOCAP:AAVE OKX:AAVEUSDT.P #1h #DeFi #DAO aave.com
Risk/Reward= 1:2.0
Expected Profit= +44.0%
Possible Loss= -22.1%
Estimated Gaintime= 3 days

SLOOS Banking Lending Conditions- Released Monday 5th Feb 2024 Please review my prior post for a more detailed breakdown
Released quarterly, the Senior Loan Officer Opinion Survey on Bank Lending Practices (SLOOS) is a survey of up to 80 large domestic banks and 24 branches of international banks to gain insight into credit, lending and bank practices. The Federal Reserve issues and collates the voluntary surveys.
The surveys generally include 25 questions and a number of special questions about development in banking practices. They cover practices for the previous three months, but also deal with expectations for the coming quarter and year. While some queries are quantitative, most are qualitative.
The surveys have come to cover increasingly timely topics, for example, providing the Fed with insight into bank forbearance policies and trends in response to the 2020 economic crisis.
Let’s have a look at the culmination of the some of the more important data in chart form
The Chart
The blue line on the chart plots the results of the SLOOS survey – specifically, the net percentage of polled banks reporting that they’ve tightened their lending standards to commercial and industrial customers.
The other lines are specified on the chart and are self explanatory .
PUKA

MACRO MONDAY 32~The SLOOS~ Is Lending Increasing or decreasing?MACRO MONDAY 32 – The SLOOS
Released Monday 5th Feb 2024 (for Q4 2023)
Released quarterly, the Senior Loan Officer Opinion Survey on Bank Lending Practices (SLOOS) is a survey of up to 80 large domestic banks and 24 branches of international banks to gain insight into credit, lending standards and bank practices. The Federal Reserve issues and collates these voluntary surveys.
The surveys generally include 25 questions and a number of special questions about development in banking practices. They cover practices for the previous three months, but also deal with expectations for the coming quarter and year. While some queries are quantitative, most are qualitative.
The surveys have come to cover increasingly timely topics, for example, providing the Fed with insight into bank forbearance policies and trends in response to the 2020 economic crisis.
Let’s have a look at the culmination of the some of the more important data from the SLOOS in chart form
The Chart
The blue line on the chart plots the results of the SLOOS survey – specifically, the net percentage of polled banks reporting that they’ve tightened their lending standards to commercial and industrial customers.
I have combined the SLOOS Tightening Lending Standards on the chart with the Unemployment Rate. You can clearly see a pattern of the SLOOS leading the Unemployment Rate and also the broad correlation of their trends. Recessions are in grey.
The SLOOS Tightening Lending Standards
(blue line)
▫️ Lending standards tightened significantly prior to the onset of each of the last three recessions (See green lines and text on chart).
▫️ When lending conditions tightened by 54% or greater it coincided with the last four recessions. (Represented by the horizontal red dashed line on the chart and the red area at the top)
▫️ On two occasions the 54% level being breached would have been a pre-recession warning; prior to the 1990 recession and 2000 recession providing approx. 3 months advance warning.
▫️ When we breached the c.34% level in Jan 2008 it marked the beginning of that recession. We are currently at 33.9% (for Q3 2023) and were as high as 50% in the reading released in July (for Q2 2023). Above the 34% on the chart is the orange area, an area of increased recession risk but not guaranteed recession.
▫️ Interestingly, every recession ended close to when we exited back out below the 34% level. This makes the 34% level an incredibly useful level to watch for tomorrows release. If we break below the 34% level it would be a very good sign. We could speculate that it could be a sign of a soft landing being more probable and could suggest a soft recessionary period has already come and gone (based solely on this chart continuing on a downward trajectory under 34%). I emphasize “speculate”.
U.S. Unemployment Rate (Red Line)
▫️ I have included the U.S. Unemployment Rate in red as in the last three recessions you can see that the unemployment rate took a sudden turn up, just before recession. This is a real trigger warning for recession on the chart. Whilst we have had an uptick in recent months, it has not been to the same degree as these prior warning signals. These prior stark increases were an increases of approx. 0.8% over two to three quarters. Our current increase is not even half of this (3.4% to 3.7% from Jan 2023 to present, a 0.3% increase over 1 year). If we rise up to 4.2% or higher we can start getting a little concerned.
▫️ The Unemployment Rate either based or rose above 4.3% prior to the last three recessions onset. This is another important level to watch in conjunction with the 34% and 54% levels on the SLOOS. All these levels increase or decrease the probability of recession and should infer a more or less risk reductive strategy for markets.
In the above we covered the Net percentage of Banks Tightening Standards for Commercial and Industrial Loans to Large and mid-sized firms. The SLOOS provides a similar chart dataset for Tightening Standards for Small Firms, and another similar dataset for Consumer Loans and Credit Cards. I will share a chart in the comments that illustrates all three so that tomorrow we can update you with the new data released for all of them. You are now also better equipped to make your own judgement call based on the history and levels represented in the above chart, all of which is only a guide.
Remember all these charts are available on TradingView and you can press play and update yourself as to where we are in terms of zones or levels breached on the charts.
Thanks for coming along again
PUKA

GFI Swing Failure Pattern!! Bullish!?!GFI Has been slowly selling off over the past few weeks. It is currently at the golden pocket retracement zone and is in the middle of a swing failure pattern. If this candle closes above the blue line it would be an interesting area to long with a stop below the swing low. If price holds and pumps, a 10% pump is possible to the next major resistance.
Every day the charts provide new information. You have to adjust or get REKT.
Love it or hate it, hit that thumbs up and share your thoughts below!
Don't trade with what you're not willing to lose. Calculate Your Risk/Reward!
This is not financial advice. This is for educational purposes only.

Yield curve is inverted today - Its implication and attributeWe have an inverted yield curve today - When the near end yields or interest rates is higher than the far end, we have an inverted yield.
What is its implication and any attributes?
To understand the implications of an inverted yield curve, it is crucial to know what a yield curve is and how it works.
A healthy yield curve –
It shows the relationship between the interest rate and the time to maturity of the bond. A normal yield curve slopes upward, meaning that long-term bonds have a higher yield than short-term bonds. This upward sloping curve indicates that investors demand a higher yield to hold longer-term bonds, as they are taking on more risk by locking up their money for a longer time.
An unhealthy or inverted yield curve –
However, an inverted yield curve occurs when short-term yields are higher than long-term yields. This situation indicates that investors are willing to accept lower yields on longer-term bonds, which is an indication of their pessimism about the economy's future growth prospects. Essentially, investors are willing to lock up their money for an extended period, accepting a lower yield, because they expect economic conditions to deteriorate.
Its implication –
i. It is a reliable predictor of an upcoming economic recession. This phenomenon has been observed many times over the years, and every time an inverted yield curve has occurred, a recession has followed. The reason for this is that an inverted yield curve indicates that investors are losing confidence in the economy, which can lead to decreased investment and spending. This, in turn, can lead to a slowdown in economic growth, which ultimately results in a recession.
ii. Another implication of an inverted yield curve is that it can make borrowing more expensive for certain individuals or companies. Banks typically borrow at short-term rates and lend at long-term rates, earning a profit on the difference between the two. However, an inverted yield curve makes this process less profitable for banks, and they may become less willing to lend, resulting in a tightening of credit conditions.
Attribute –
Short-term fixed deposit saver. ie. Keep rolling your 3-month fixed deposit saving or traders trading into the expected volatility.
In conclusion, an inverted yield curve, where the current Fed fund rate and 3-month yield is higher than the 30-year yield, is a rare occurrence in the bond market that has significant implications for the economy. It is a reliable predictor of an upcoming recession and can result in higher borrowing costs for some individuals and companies. Investors should be aware of this phenomenon and take it into account when making investment decisions.
Some reference for traders:
Micro Treasury Yields & Its Minimum Fluctuation
Micro 2-Year Yield Futures
Ticker: 2YY
0.001 Index points (1/10th basis point per annum) = $1.00
Micro 5-Year Yield Futures
Ticker: 5YY
0.001 Index points (1/10th basis point per annum) = $1.00
Micro 10-Year Yield Futures
Ticker: 10Y
0.001 Index points (1/10th basis point per annum) = $1.00
Micro 30-Year Yield Futures
Ticker: 30Y
0.001 Index points (1/10th basis point per annum) = $1.00
Disclaimer:
• What presented here is not a recommendation, please consult your licensed broker.
• Our mission is to create lateral thinking skills for every investor and trader, knowing when to take a calculated risk with market uncertainty and a bolder risk when opportunity arises.
CME Real-time Market Data help identify trading set-ups in real-time and express my market views. If you have futures in your trading portfolio, you can check out on CME Group data plans available that suit your trading needs www.tradingview.com

$TRU/USDT 3h (#Bybit) Descending channel breakoutTrueFi just regained 50MA support and seems about to push higher and recover, short-term.
⚡️⚡️ #TRU/USDT ⚡️⚡️
Exchanges: Binance Futures, ByBit USDT
Signal Type: Regular (Long)
Leverage: Isolated (3.0X)
Amount: 4.7%
Current Price:
0.08935
Entry Zone:
0.08805 - 0.08295
Take-Profit Targets:
1) 0.09990
2) 0.11075
3) 0.12160
Stop Targets:
1) 0.07345
Published By: @Zblaba
$TRU #TRUUSDT #TrueFi #DeFi #TrustToken
Risk/Reward= 1:1.2 | 1:2.1 | 1:3.0
Expected Profit= +50.5% | +88.6% | +126.7%
Possible Loss= -42.3%
Estimated Gaintime= 1-2 weeks

PLGR: $0.000 63 | a BOLD platform for SOPHISTICATED Playersan interim concept waiting for product fit
and placements for facilitation
concept ahead of market
kinda like SPAC
a shell APPLICATION
that facilitates special deals
CAP: $200K
Float: $15%
Handler: Tony Montana
Business: a venue for co founders stakeholders other businesses
Strategy: Placement.. Buy and hold

LDO B.O.S quick updateBreakdown targets mapped on chart the asset broke trend and could drop all the way to daily support

QIBTC - Potential Double Bottom. Oversold on WeeklyQIBTC has been oversold on weekly timeframe for some time now.
As per chart, if we can hold 46 sats on weekly then we may have a double bottom, and could see some bullish action in the short term.

$AAVE/USDT 3D (#BinanceFutures) Falling wedges on supportAave is looking bottomed here on High Time-Frame (HTF) and is very likely to bounce back on historical demand zone.
Current Price= 132.77
Buy Entry= 131.50 - 117.30
Take Profit= 169.60 | 220.18 | 275.84
Stop Loss= 93.45
Risk/Reward= 1:1.46 | 1:3.09 | 1:4.89
Expected Profit= +36.33% | +76.99% | +121.74%
Possible Loss= -24.88%
Fib. Retracement= 0.236 | 0.441 | 0.618
Margin Leverage= 1x
Estimated Gain-time= 6 months
Tags: #AAVE #AAVEUSDT #Yield #Farming #Lending #Governance #DAO #DeFi #BSC #SolEco
Website: aave.com
Contracts:
#ERC20 0x7Fc66500c84A76Ad7e9c93437bFc5Ac33E2DDaE9
#BEP20 0xfb6115445bff7b52feb98650c87f44907e58f802
#AVAXC 0x8ce2dee54bb9921a2ae0a63dbb2df8ed88b91dd9
#SPL 3vAs4D1WE6Na4tCgt4BApgFfENbm8WY7q4cSPD1yM4Cg
#Fantom 0x6a07A792ab2965C72a5B8088d3a069A7aC3a993B
#Polygon 0xd6df932a45c0f255f85145f286ea0b292b21c90b

Anchor ProtocolAnchor Protocol (ANC) is a lending and borrowing protocol on the Terra blockchain and the 29th project on Binance Launchpool. It uses an over-collateralized architecture to allow users to lend, borrow and earn interest with their digital assets. Anchor is a savings protocol on the Terra blockchain that enables fast withdrawals and pays depositors a low-volatility interest rate, which is amongst the highest among stablecoins at ~19.5%. Anchor makes deposits available to borrowers who pledge liquid-staked PoS assets, bLUNA and bETH, as security.
- i am following Anchor Protocol for a long time and what i see is a perma bullish trend, and have a good reason behind that :
- if you go to check on their website : app.anchorprotocol.com
- You will notice that you can stack ANC for 9.65% APR but also if you use a collateral with UST ( TerraUSD), you will get 70.94% APR.
- You can also stake UST for 17%-24% APR ( 19.47% today )
- So for now not many peoples know about this project but the TVL is already around 14 200 000 000$.
DYOR to dig more and understand how they can reward so much purcentages ( Mechanic of borrowers pay lenders ).
-----------------------------------------------------------------------------------------------
Trading parts :
- i do not recommend to Fomo on ANC now but just pray for a dip.
- if you want to be just a long term hodler, just buy direct and stake.
-----------------------------------------------------------------------------------------------
Buy : 4$ to 3.8$
Rebuy : 3.3$ to 3$
TP1 : 5$ (ATH)
TP2 : 7$
SL : No Need
-----------------------------------------------------------------------------------------------
Happy Tr4Ding !

$XVS/BTC 4h (#BinanceSpot) Falling wedge breakout and retestVenus is pulling back to 50/200MA support and looks good for another leg-up after, short-term.
Current Price= 0.0002292
Buy Entry= 0.0002301 - 0.0002203
Take Profit= 0.0002617 | 0.0002773 | 0.0003008
Stop Loss= 0.0001991
Risk/Reward= 1:1.4 | 1:2 | 1:2.9
Expected Profit= +13.81% | +23.13% | +33.57%
Possible Loss= -11.59%
Fib. Retracement= 0.5 | 0.618 | 0.786
Margin Leverage= 1x
Estimated Gain-time= 3 weeks
Tags: #XVS #XVSBTC #Yield #Farming #Lending #DeFi #BSC #BC #Launchpool
Website: venus.io
Contracts:
#BEP20 0xcf6bb5389c92bdda8a3747ddb454cb7a64626c63
#BEP2 XVS-795

Compound 1/10 of the ATH!butterfly harmonic pattern:
X=$1763
AB=0.78 XA
BC=0.88 AB=$107
0.78 BC=$548
0.88 BC=$696
0.88 XA=$1241
1.13 XA=$2630
1.6 BC=$3952
1.27 XA=$4070
1.41 XA=$6223
2 BC=$9785
1.6 XA=$11800
2.24 BC=$17293
