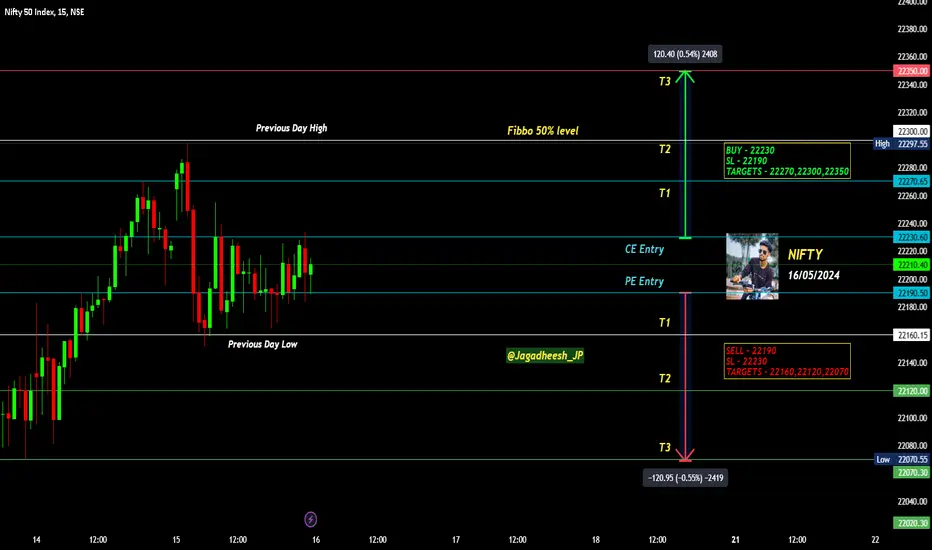
NIFTY INTRADAY LEVELS FOR 16 MAY 2024BUY ABOVE - 22230
SL - 22190
TARGETS - 22270,22300,22350
SELL BELOW - 22190
SL - 22230
TARGETS - 22160,22120,22070
NO TRADE ZONE - 22190 to 22230
Previous Day High - 22300
Previous Day Low - 22160
Based on price action major support & resistance's are here, the red lines acts as resistances, the green lines acts as supports. If the price breaks the support/resistance, it will move to the next support/resistance line. White lines indicates previous day high & low, high acts as a resistance & low acts as a support for next day.
Trendlines are also significant to price action. If the price is above/below the trendlines, can expect an UP/DOWN with aggressive move.
Please NOTE: this levels are for intraday trading only.
Disclaimer - All information on this page is for educational purposes only,
we are not SEBI Registered, Please consult a SEBI registered financial advisor for your financial matters before investing And taking any decision. We are not responsible for any profit/loss you made.
Request your support and engagement by liking and commenting & follow to provide encouragement
HAPPY TRADING 👍
Levels
BANK NIFTY INTRADAY LEVELS FOR 15/05/2024BUY ABOVE - 47900
SL - 47730
TARGETS - 48050,48220,48460
SELL BELOW - 47730
SL - 47900
TARGETS - 47560,47400,47200
NO TRADE ZONE - 47730 to 47900
Previous Day High - 47900
Previous Day Low - 47570
Based on price action major support & resistance's are here, the red lines acts as resistances, the green lines acts as supports. If the price breaks the support/resistance, it will move to the next support/resistance line. White lines indicates previous day high & low, high acts as a resistance & low acts as a support for next day.
Trendlines are also significant to price action. If the price is above/below the trendlines, can expect an UP/DOWN with aggressive move.
Please NOTE: this levels are for intraday trading only.
Disclaimer - All information on this page is for educational purposes only,
we are not SEBI Registered, Please consult a SEBI registered financial advisor for your financial matters before investing And taking any decision. We are not responsible for any profit/loss you made.
Request your support and engagement by liking and commenting & follow to provide encouragement
HAPPY TRADING 👍

NIFTY INTRADAY LEVELS FOR 15/05/2024BUY ABOVE - 22300
SL - 22220
TARGETS - 22350,22420,22470
SELL BELOW - 22180
SL - 22220
TARGETS - 22130,22070,22020
NO TRADE ZONE - 22180 to 22270
Previous Day High - 22270
Previous Day Low - 22070
Based on price action major support & resistance's are here, the red lines acts as resistances, the green lines acts as supports. If the price breaks the support/resistance, it will move to the next support/resistance line. White lines indicates previous day high & low, high acts as a resistance & low acts as a support for next day.
Trendlines are also significant to price action. If the price is above/below the trendlines, can expect an UP/DOWN with aggressive move.
Please NOTE: this levels are for intraday trading only.
Disclaimer - All information on this page is for educational purposes only,
we are not SEBI Registered, Please consult a SEBI registered financial advisor for your financial matters before investing And taking any decision. We are not responsible for any profit/loss you made.
Request your support and engagement by liking and commenting & follow to provide encouragement
HAPPY TRADING 👍

BANK NIFTY INTRADAY LEVELS FOR 13/05/2024BUY ABOVE - 47560
SL - 47400
TARGETS - 47730,47900,48050
SELL BELOW - 47400
SL - 47560
TARGETS - 47200,47000,46800
NO TRADE ZONE - 47400 to 47560
Previous Day High - 47900
Previous Day Low - 47400
Based on price action major support & resistance's are here, the red lines acts as resistances, the green lines acts as supports. If the price breaks the support/resistance, it will move to the next support/resistance line. White lines indicates previous day high & low, high acts as a resistance & low acts as a support for next day.
Trendlines are also significant to price action. If the price is above/below the trendlines, can expect an UP/DOWN with aggressive move.
Please NOTE: this levels are for intraday trading only.
Disclaimer - All information on this page is for educational purposes only,
we are not SEBI Registered, Please consult a SEBI registered financial advisor for your financial matters before investing And taking any decision. We are not responsible for any profit/loss you made.
Request your support and engagement by liking and commenting & follow to provide encouragement
HAPPY TRADING 👍

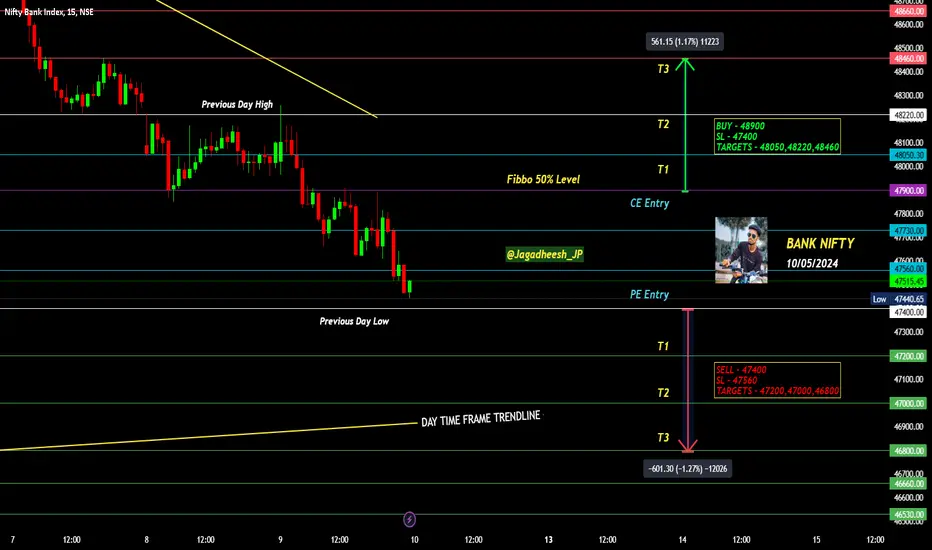
BANK NIFTY INTRADAY LEVELS FOR 10/05/2024BUY ABOVE - 48900
SL - 47400
TARGETS - 48050,48220,48460
SELL BELOW - 47400
SL - 47560
TARGETS - 47200,47000,46800
NO TRADE ZONE - 47400 to 47900
Previous Day High - 48220
Previous Day Low - 47400
Based on price action major support & resistance's are here, the red lines acts as resistances, the green lines acts as supports. If the price breaks the support/resistance, it will move to the next support/resistance line. White lines indicates previous day high & low, high acts as a resistance & low acts as a support for next day.
Trendlines are also significant to price action. If the price is above/below the trendlines, can expect an UP/DOWN with aggressive move.
Please NOTE: this levels are for intraday trading only.
Disclaimer - All information on this page is for educational purposes only,
we are not SEBI Registered, Please consult a SEBI registered financial advisor for your financial matters before investing And taking any decision. We are not responsible for any profit/loss you made.
Request your support and engagement by liking and commenting & follow to provide encouragement
HAPPY TRADING 👍
BANK NIFTY INTRADAY LEVELS FOR 07/05/2024BUY ABOVE - 48970
SL - 48800
TARGETS - 49130,49300,49480
SELL BELOW - 48800
SL - 48970
TARGETS - 48660,48500,48400
NO TRADE ZONE - 48800 to 48970
Previous Day High - 49300
Previous Day Low - 48800
Based on price action major support & resistance's are here, the red lines acts as resistances, the green lines acts as supports. If the price breaks the support/resistance, it will move to the next support/resistance line. White lines indicates previous day high & low, high acts as a resistance & low acts as a support for next day.
Trendlines are also significant to price action. If the price is above/below the trendlines, can expect an UP/DOWN with aggressive move.
Please NOTE: this levels are for intraday trading only.
Disclaimer - All information on this page is for educational purposes only,
we are not SEBI Registered, Please consult a SEBI registered financial advisor for your financial matters before investing And taking any decision. We are not responsible for any profit/loss you made.
Request your support and engagement by liking and commenting & follow to provide encouragement
HAPPY TRADING 👍

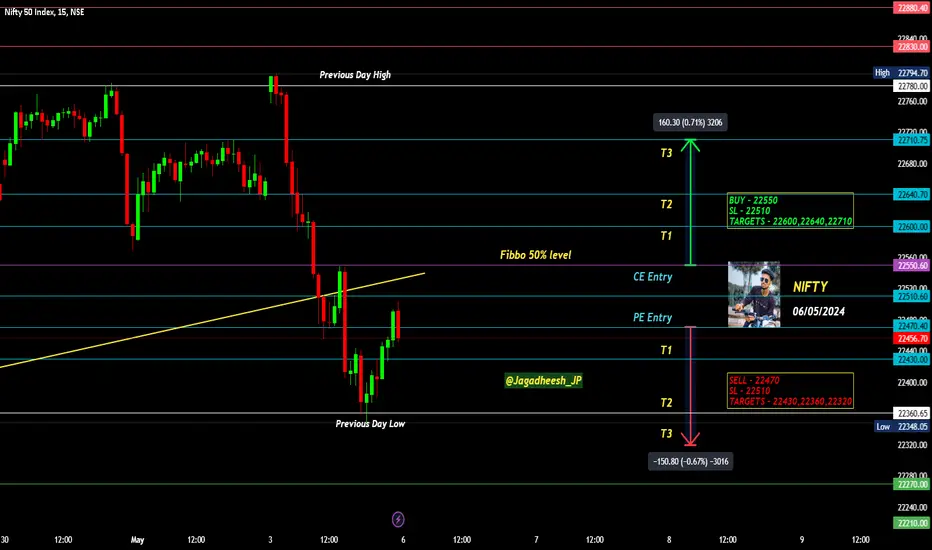
NIFTY INTRADAY LEVELS FOR 06/05/2024BUY ABOVE - 22550
SL - 22510
TARGETS - 22600,22640,22710
SELL BELOW - 22470
SL - 22510
TARGETS - 22430,22360,22320
NO TRADE ZONE - 22470 to 22550
Previous Day High - 22780
Previous Day Low - 22360
Based on price action major support & resistance's are here, the red lines acts as resistances, the green lines acts as supports. If the price breaks the support/resistance, it will move to the next support/resistance line. White lines indicates previous day high & low, high acts as a resistance & low acts as a support for next day.
Trendlines are also significant to price action. If the price is above/below the trendlines, can expect an UP/DOWN with aggressive move.
Please NOTE: this levels are for intraday trading only.
Disclaimer - All information on this page is for educational purposes only,
we are not SEBI Registered, Please consult a SEBI registered financial advisor for your financial matters before investing And taking any decision. We are not responsible for any profit/loss you made.
Request your support and engagement by liking and commenting & follow to provide encouragement
HAPPY TRADING 👍
BANK NIFTY INTRADAY LEVELS FOR 03/05/2024BUY ABOVE - 49480
SL - 49340
TARGETS - 49670,49850,50000
SELL BELOW - 49180
SL - 49340
TARGETS - 49020,48800,48630
NO TRADE ZONE - 49180 to 49480
Previous Day High - 49480
Previous Day Low - 49180
Based on price action major support & resistance's are here, the red lines acts as resistances, the green lines acts as supports. If the price breaks the support/resistance, it will move to the next support/resistance line. White lines indicates previous day high & low, high acts as a resistance & low acts as a support for next day.
Trendlines are also significant to price action. If the price is above/below the trendlines, can expect an UP/DOWN with aggressive move.
Please NOTE: this levels are for intraday trading only.
Disclaimer - All information on this page is for educational purposes only,
we are not SEBI Registered, Please consult a SEBI registered financial advisor for your financial matters before investing And taking any decision. We are not responsible for any profit/loss you made.
Request your support and engagement by liking and commenting & follow to provide encouragement
HAPPY TRADING 👍

NIFTY INTRADAY LEVELS FOR 02/05/2024BUY ABOVE - 22600
SL - 22550
TARGETS - 22660,22710,22780
SELL BELOW - 22550
SL - 22600
TARGETS - 22510,22470,22430
NO TRADE ZONE - 22550 to 22600
Previous Day High - 22780
Previous Day Low - 22550
Based on price action major support & resistance's are here, the red lines acts as resistances, the green lines acts as supports. If the price breaks the support/resistance, it will move to the next support/resistance line. White lines indicates previous day high & low, high acts as a resistance & low acts as a support for next day.
Trendlines are also significant to price action. If the price is above/below the trendlines, can expect an UP/DOWN with aggressive move.
Please NOTE: this levels are for intraday trading only.
Disclaimer - All information on this page is for educational purposes only,
we are not SEBI Registered, Please consult a SEBI registered financial advisor for your financial matters before investing And taking any decision. We are not responsible for any profit/loss you made.
Request your support and engagement by liking and commenting & follow to provide encouragement
HAPPY TRADING 👍


$SPY trend rejection/EMA cross/MACD rejectionNot looking great as we head into #FED and NASDAQ:AAPL earnings to close out this week. The weekly 21 EMA is 494ish. If 500 breaks then that would be next level of support to watch.

BANK NIFTY INTRADAY LEVELS FOR 30/04/2024BUY ABOVE - 49480
SL - 49250
TARGETS - 49670,49850,50000
SELL BELOW - 49250
SL - 49480
TARGETS - 49020,48800,48630
NO TRADE ZONE - 49250 to 49480
Previous Day High - 49480
Previous Day Low - 48310
Based on price action major support & resistance's are here, the red lines acts as resistances, the green lines acts as supports. If the price breaks the support/resistance, it will move to the next support/resistance line. White lines indicates previous day high & low, high acts as a resistance & low acts as a support for next day.
Trendlines are also significant to price action. If the price is above/below the trendlines, can expect an UP/DOWN with aggressive move.
Please NOTE: this levels are for intraday trading only.
Disclaimer - All information on this page is for educational purposes only,
we are not SEBI Registered, Please consult a SEBI registered financial advisor for your financial matters before investing And taking any decision. We are not responsible for any profit/loss you made.
Request your support and engagement by liking and commenting & follow to provide encouragement
HAPPY TRADING 👍

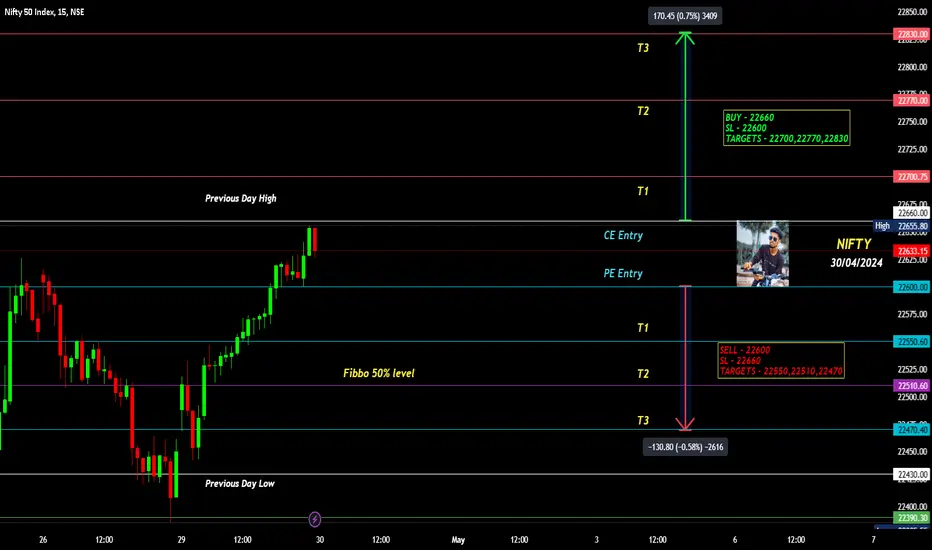
NIFTY INTRADAY LEVELS FOR 30/04/2024BUY ABOVE - 22660
SL - 22600
TARGETS - 22700,22770,22830
SELL BELOW - 22600
SL - 22660
TARGETS - 22550,22510,22470
NO TRADE ZONE - 22600 to 22660
Previous Day High - 22660
Previous Day Low - 22430
Based on price action major support & resistance's are here, the red lines acts as resistances, the green lines acts as supports. If the price breaks the support/resistance, it will move to the next support/resistance line. White lines indicates previous day high & low, high acts as a resistance & low acts as a support for next day.
Trendlines are also significant to price action. If the price is above/below the trendlines, can expect an UP/DOWN with aggressive move.
Please NOTE: this levels are for intraday trading only.
Disclaimer - All information on this page is for educational purposes only,
we are not SEBI Registered, Please consult a SEBI registered financial advisor for your financial matters before investing And taking any decision. We are not responsible for any profit/loss you made.
Request your support and engagement by liking and commenting & follow to provide encouragement
HAPPY TRADING 👍
BANK NIFTY INTRADAY LEVEL FOR 29/04/2024BUY ABOVE - 48310
SL - 48220
TARGETS - 48400,48500,48630
SELL BELOW - 48120
SL - 48220
TARGETS - 48030,47940,47840
NO TRADE ZONE - 48120 to 48310
Previous Day High - 48630
Previous Day Low - 48120
Based on price action major support & resistance's are here, the red lines acts as resistances, the green lines acts as supports. If the price breaks the support/resistance, it will move to the next support/resistance line. White lines indicates previous day high & low, high acts as a resistance & low acts as a support for next day.
Trendlines are also significant to price action. If the price is above/below the trendlines, can expect an UP/DOWN with aggressive move.
Please NOTE: this levels are for intraday trading only.
Disclaimer - All information on this page is for educational purposes only,
we are not SEBI Registered, Please consult a SEBI registered financial advisor for your financial matters before investing And taking any decision. We are not responsible for any profit/loss you made.
Request your support and engagement by liking and commenting & follow to provide encouragement
HAPPY TRADING 👍

NIFTY INTRADAY LEVELS FOR 29/04/2024BUY ABOVE - 22470
SL - 22430
TARGETS - 22510,22550,22620
SELL BELOW - 22390
SL - 22430
TARGETS - 22360,22320,22270
NO TRADE ZONE - 22390 to 22470
Previous Day High - 22620
Previous Day Low - 22390
Based on price action major support & resistance's are here, the red lines acts as resistances, the green lines acts as supports. If the price breaks the support/resistance, it will move to the next support/resistance line. White lines indicates previous day high & low, high acts as a resistance & low acts as a support for next day.
Trendlines are also significant to price action. If the price is above/below the trendlines, can expect an UP/DOWN with aggressive move.
Please NOTE: this levels are for intraday trading only.
Disclaimer - All information on this page is for educational purposes only,
we are not SEBI Registered, Please consult a SEBI registered financial advisor for your financial matters before investing And taking any decision. We are not responsible for any profit/loss you made.
Request your support and engagement by liking and commenting & follow to provide encouragement
HAPPY TRADING 👍

BANK NIFTY INTRADAY LEVELS FOR 26/04/2024BUY ABOVE - 48630
SL - 48500
TARGETS - 48800,48930,49050
SELL BELOW - 48400
SL - 48500
TARGETS - 48310,48220,48120
NO TRADE ZONE - 48400 to 48630
Previous Day High - 48630
Previous Day Low - 47730
Based on price action major support & resistance's are here, the red lines acts as resistances, the green lines acts as supports. If the price breaks the support/resistance, it will move to the next support/resistance line. White lines indicates previous day high & low, high acts as a resistance & low acts as a support for next day.
Trendlines are also significant to price action. If the price is above/below the trendlines, can expect an UP/DOWN with aggressive move.
Please NOTE: this levels are for intraday trading only.
Disclaimer - All information on this page is for educational purposes only,
we are not SEBI Registered, Please consult a SEBI registered financial advisor for your financial matters before investing And taking any decision. We are not responsible for any profit/loss you made.
Request your support and engagement by liking and commenting & follow to provide encouragement
HAPPY TRADING 👍

BANK NIFTY INTRADAY LEVELS FOR 25/04/2024BUY ABOVE - 48260
SL - 48120
TARGETS - 48400,48510,48670
SELL BELOW - 48120
SL - 48260
TARGETS - 48030,47940,47840
NO TRADE ZONE - 48120 to 48260
Previous Day High - 48260
Previous Day Low - 48030
Based on price action major support & resistance's are here, the red lines acts as resistances, the green lines acts as supports. If the price breaks the support/resistance, it will move to the next support/resistance line. White lines indicates previous day high & low, high acts as a resistance & low acts as a support for next day.
Trendlines are also significant to price action. If the price is above/below the trendlines, can expect an UP/DOWN with aggressive move.
Please NOTE: this levels are for intraday trading only.
Disclaimer - All information on this page is for educational purposes only,
we are not SEBI Registered, Please consult a SEBI registered financial advisor for your financial matters before investing And taking any decision. We are not responsible for any profit/loss you made.
Request your support and engagement by liking and commenting & follow to provide encouragement
HAPPY TRADING 👍

NIFTY INTRADAY LEVELS FOR 25/04/2024BUY ABOVE - 22430
SL - 22360
TARGETS - 22470,22510,22570
SELL BELOW - 22360
SL - 22430
TARGETS - 22320,22270,22210
NO TRADE ZONE - 22360 to 22430
Previous Day High - 22470
Previous Day Low - 22390
Based on price action major support & resistance's are here, the red lines acts as resistances, the green lines acts as supports. If the price breaks the support/resistance, it will move to the next support/resistance line. White lines indicates previous day high & low, high acts as a resistance & low acts as a support for next day.
Trendlines are also significant to price action. If the price is above/below the trendlines, can expect an UP/DOWN with aggressive move.
Please NOTE: this levels are for intraday trading only.
Disclaimer - All information on this page is for educational purposes only,
we are not SEBI Registered, Please consult a SEBI registered financial advisor for your financial matters before investing And taking any decision. We are not responsible for any profit/loss you made.
Request your support and engagement by liking and commenting & follow to provide encouragement
HAPPY TRADING 👍

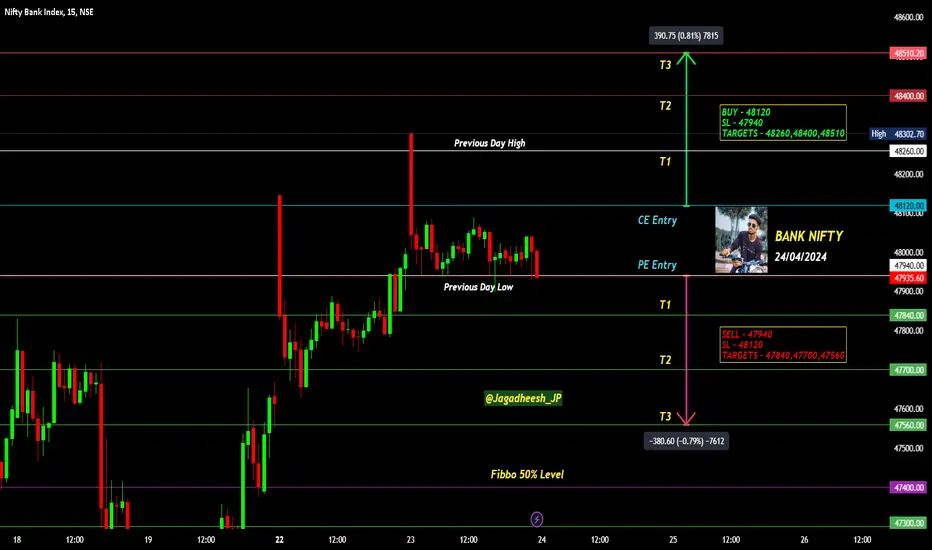
BANK NIFTY INTRADAY LEVELS FOR 24/04/2024BUY ABOVE - 48120
SL - 47940
TARGETS - 48260,48400,48510
SELL BELOW - 47940
SL - 48120
TARGETS - 47840,47700,47560
NO TRADE ZONE - 47940 to 48120
Previous Day High - 48260
Previous Day Low - 47940
Based on price action major support & resistance's are here, the red lines acts as resistances, the green lines acts as supports. If the price breaks the support/resistance, it will move to the next support/resistance line. White lines indicates previous day high & low, high acts as a resistance & low acts as a support for next day.
Trendlines are also significant to price action. If the price is above/below the trendlines, can expect an UP/DOWN with aggressive move.
Please NOTE: this levels are for intraday trading only.
Disclaimer - All information on this page is for educational purposes only,
we are not SEBI Registered, Please consult a SEBI registered financial advisor for your financial matters before investing And taking any decision. We are not responsible for any profit/loss you made.
Request your support and engagement by liking and commenting & follow to provide encouragement
HAPPY TRADING 👍
NIFTY INTRADAY LEVELS FOR 24/04/2024BUY ABOVE - 22430
SL - 22360
TARGETS - 22470,22510,22570
SELL BELOW - 22360
SL - 22430
TARGETS - 22320,22270,22210
NO TRADE ZONE - 22360 to 22430
Previous Day High - 22430
Previous Day Low - 22360
Based on price action major support & resistance's are here, the red lines acts as resistances, the green lines acts as supports. If the price breaks the support/resistance, it will move to the next support/resistance line. White lines indicates previous day high & low, high acts as a resistance & low acts as a support for next day.
Trendlines are also significant to price action. If the price is above/below the trendlines, can expect an UP/DOWN with aggressive move.
Please NOTE: this levels are for intraday trading only.
Disclaimer - All information on this page is for educational purposes only,
we are not SEBI Registered, Please consult a SEBI registered financial advisor for your financial matters before investing And taking any decision. We are not responsible for any profit/loss you made.
Request your support and engagement by liking and commenting & follow to provide encouragement
HAPPY TRADING 👍

BANK NIFTY INTRADAY LEVELS FOR 23/04/2024BUY ABOVE - 48120
SL - 47950
TARGETS - 48260,48400,48510
SELL BELOW - 47840
SL - 47950
TARGETS - 47700,47560,47400
NO TRADE ZONE - 47840 to 48120
Previous Day High - 48120
Previous Day Low - 47700
Based on price action major support & resistance's are here, the red lines acts as resistances, the green lines acts as supports. If the price breaks the support/resistance, it will move to the next support/resistance line. White lines indicates previous day high & low, high acts as a resistance & low acts as a support for next day.
Trendlines are also significant to price action. If the price is above/below the trendlines, can expect an UP/DOWN with aggressive move.
Please NOTE: this levels are for intraday trading only.
Disclaimer - All information on this page is for educational purposes only,
we are not SEBI Registered, Please consult a SEBI registered financial advisor for your financial matters before investing And taking any decision. We are not responsible for any profit/loss you made.
Request your support and engagement by liking and commenting & follow to provide encouragement
HAPPY TRADING 👍

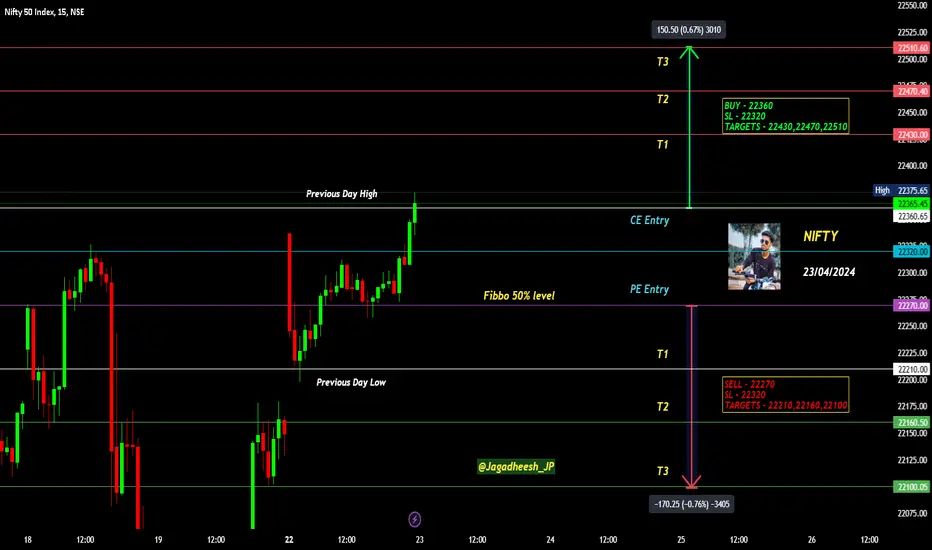
NIFTY INTRADAY LEVELS FOR 23/04/2024BUY ABOVE - 22360
SL - 22320
TARGETS - 22430,22470,22510
SELL BELOW - 22270
SL - 22320
TARGETS - 22210,22160,22100
NO TRADE ZONE - 22270 to 22360
Previous Day High - 22360
Previous Day Low - 22210
Based on price action major support & resistance's are here, the red lines acts as resistances, the green lines acts as supports. If the price breaks the support/resistance, it will move to the next support/resistance line. White lines indicates previous day high & low, high acts as a resistance & low acts as a support for next day.
Trendlines are also significant to price action. If the price is above/below the trendlines, can expect an UP/DOWN with aggressive move.
Please NOTE: this levels are for intraday trading only.
Disclaimer - All information on this page is for educational purposes only,
we are not SEBI Registered, Please consult a SEBI registered financial advisor for your financial matters before investing And taking any decision. We are not responsible for any profit/loss you made.
Request your support and engagement by liking and commenting & follow to provide encouragement
HAPPY TRADING 👍
NIFTY INTRADAY LEVELS FOR 22/04/2024BUY ABOVE - 22160
SL - 22100
TARGETS - 22210,22270,22320
SELL BELOW - 22100
SL - 22160
TARGETS - 22050,22000,21960
NO TRADE ZONE - 22100 to 22160
Previous Day High - 22160
Previous Day Low - 21800
Based on price action major support & resistance's are here, the red lines acts as resistances, the green lines acts as supports. If the price breaks the support/resistance, it will move to the next support/resistance line. White lines indicates previous day high & low, high acts as a resistance & low acts as a support for next day.
Trendlines are also significant to price action. If the price is above/below the trendlines, can expect an UP/DOWN with aggressive move.
Please NOTE: this levels are for intraday trading only.
Disclaimer - All information on this page is for educational purposes only,
we are not SEBI Registered, Please consult a SEBI registered financial advisor for your financial matters before investing And taking any decision. We are not responsible for any profit/loss you made.
Request your support and engagement by liking and commenting & follow to provide encouragement
HAPPY TRADING 👍
