ROSEUSDT wants to retest the 0.786 Fibonacci levelThe market created equal lows on 0.06$ and create double bottom on it.
Now the e price is testing the 0.5 Fibonacci level as resistance on 0.073 where the market created a 4h resistance as well.
How to approach it?
The price needs to create a new breakout from the 0.5Fibonacci level.
IF the price is going to satisfy our rules, we could see a retest on 0.786 Fibonacci level on 0.08$
–––––
Follow the Shrimp 🦐
Keep in mind.
🟣 Purple structure -> Monthly structure.
🔴 Red structure -> Weekly structure.
🔵 Blue structure -> Daily structure.
🟡 Yellow structure -> 4h structure.
Levels

SPY Channel Analysis with Levels (Week in Review)Last week, we provided a SPY Channel/Trend Analysis for the upcoming week. This weekend, we will break the week down into 2 segments: 1) the move to challenge the upper channel & 2) the $SPY channel/trendline break.
In doing this, we will keep the 2 basic Channels/Trendlines on the chart, and overlay them with our Intraday Levels from our algo. This provides a greater perspective into how our preparedness meets the market throughout the week and why our confidence and expectancy in trading are so high.
First, we have color-coded our INTRADAY LEVELS for speed in determining direction and postioning. This is our "Legend" if you will:
GREEN/RED Lines are BUY/SELL Triggers
WHITE Lines are SUPPLY/DEMAND (These are KEY R1/S1 levels with more significance than I will go into here)
GRAY Lines are Support/Resistance (R2-R5/S2-S5)
ORANGE Lines are BUY Targets (R1 goes to T1 / R2 to T2 / R3 to T3, etc...)
PURPLE Lines are SELL Targets (S1 goes to T1 / S2 to T2 / S3 to T3, etc...)
SPY INTRADAY- MON & TUES in Review
MON- GAP Open and retreated back to the GREEN BUY TRIGGER, then hit WHITE SUPPLY (R1) & ORANGE LINE (TGT1) upside; $SPY was unable to push much over Gray Line (R2), but remained POSITIVE for the day
TUES- GAP Down, SPY hit S4/T4 on Tues at 1045am, and put in a bottom...rallied all the way back up to WHITE DEMAND (S1) level and finish POSITIVE for the day

ZECUSDT 1D timeframe structureThis support and resistance structure forms the framework within which our trading timeframe price action will move. A breakout of the structural framework support or resistance will lead to price movement in the next area of the framework.

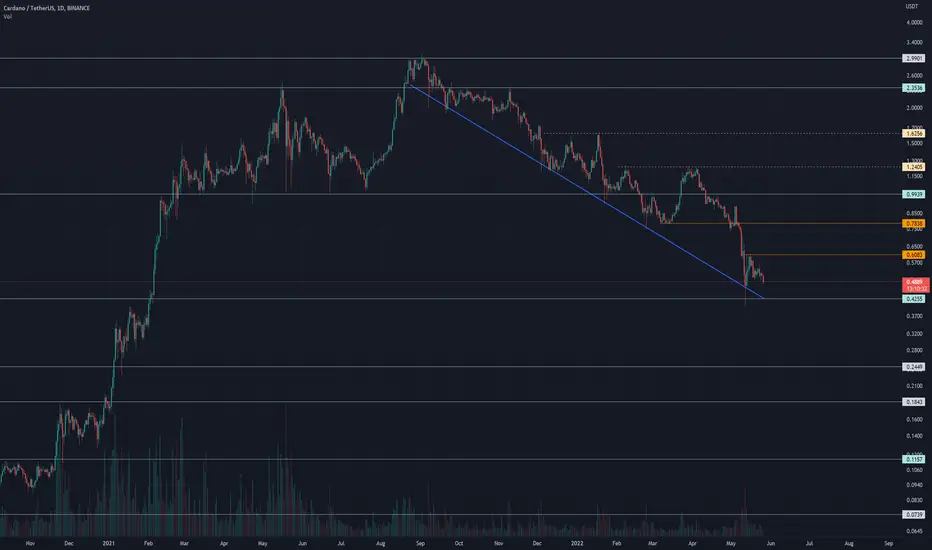
ADAUSDT higher timeframe structureHow far back in time should we go to find Support and Resistance levels?
Realize though, the further back you have to go, the more time has elapsed since price was last there. As Support or Resistance is a result of trader decisions and actions, more elapsed time usually means it will have less influence.
MATICUSDT market structureStrong levels represented by solid lines.
Less significant levels represented by dashed lines.
Trendlines represented by slanted lines.
More often than not, price action is choppy with much overlap between candles. Strictly following definitions for swing high/low could leave us with a market structure that is just unworkable. Our intent is simply to identify those key turning points which stand out on the chart as the most obvious levels, and therefore offer potential barriers to future price action.

ENJUSDT levels of support and resistanceDuring the conduct of your analysis it is imperative that you remain aware of the whole area, even though your chart may show support and resistance represented by a single line. Be aware that the price may turn before the line; and that a break of that line does NOT necessarily constitute a break of the support and resistance level.
*Notice, that the violet zone is the price level where the most amount of volume was traded.

AAPL 4h breakout predictionOn the chart there are major and minor levels marked. AAPL has moved within the pink 4h range since Jan with multiple attempts to break higher that failed. Smart traders buy the lows of these ranges. However the market is very bearish in general and it looks like a good opportunity to look for a lower level move. Good 15min trade setups can be cooking here for the open space move down to 151 area with lower targets below.. but don't get greedy if you get in this move. a break back up into the range is more likely than a complete breakdown. Keeping a small portion runner is ok though. Happy trading.

1INCHUSDT market structureSupport is an area in which demand overcomes supply, limiting downward price movement.
Resistance is an area in which supply overcomes demand, limiting upward price movement.

ETHBTC support and resistance areasSupport and resistance are created by the decision making of market participants, as they operate within an environment of uncertainty. Decisions to buy or sell are made through referencing current price against previous areas which caused significant emotional response, in particular those areas which led to regret of missing out on opportunity, or those areas which trapped traders in losing positions. There are other factors involved, not least of which is the simple self-fulfilling prophecy.

SPX Weekly RangesHere are the past 7 weeks of PVI Volatility Ranges for SPX . The Ranges are computed every weekend from a myriad of data points and ratios (Index, Volatility variations, SKEW, HV, IV, etc...)
We compute the ranges on the weekend, along with our roadmap & Game Plan for the week ahead. Some of us enter their first tranche on Sunday nights or early Monday (depending on confirmation from Futures ).
We do NOT sell fixed Deltas for our credit spreads, but rather utilize the data driven from our volatility algo for the specific Index (primarily SPX ).
The PVI Weekly SPX Credit Spread portfolio is up just over 47% YTD with 20 straight weeks of profits and zero drawdowns. The ranges have been breached 3 times since the start of 2021 (by an amount greater than 10 SPX points). The system is NOT designed or programed to be perfect, it is to provide us with the most competitive SPX weekly Range with the highest VALUE between Premium & Expectancy

SPY Channels in your Weekly Game Plan$SPY bottomed on FOMC week and established the immediate trend's lower channel. The bounce off the lows moved SPY to the upper channel & a continuation wedge formation (stair-stepping downward). Friday's bottom wick attacked the intermediate trend that was established near the Jan lows. We have an "impingement" upcoming in the SPY Wedge Formation this week...does the larger, intermediate channel dominate the April/May channel? If so, expect a move back over 395 and possibly a run at the 405 level which is the 20DMA & the weekly low set on May 1st. If the move up towards 395 fails, expect the intermediate channel to be re-tested (should be under 380 by then) and then continue the Wedge Formation down towards the 374 area which might spark high volume selling and take SPY under 370.
Dotted horizontal lines are key weekly lows since February and placed for your visual reference of potential Profit Taker areas.
Key SPY levels for the upcoming 2 weeks: 360/ 368 / 374 / 377 / 380 / 385.15 / 405 / 411 / 420

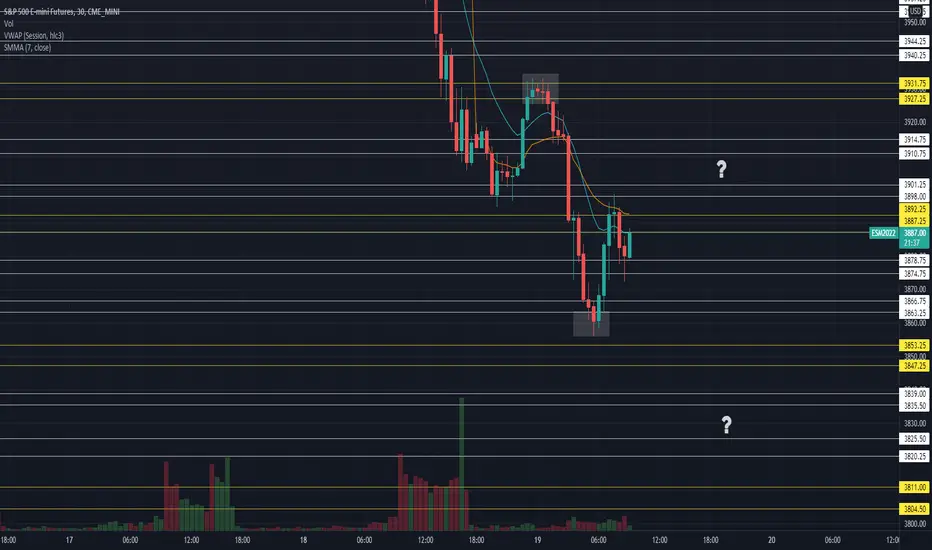
#ES Futures 5.19.22 Overview and Levels to WatchYesterday we had a big sell off, I had it market that we would visit our Key Support at 3976.50-3971.50 and if selling is strong then can see lower levels as well, did not expect to that much but we got what we got. Today we are set to open on a gap down and below T+2 low of Tuesday. Currently inventory is short and we found some buyers before our swing low and Key Support of 3853.25-3847.25, at the open I want to see if we get any correction and maybe try to fill the gap at around 3905 area, if we cant fill the gap and stay above our Key Resistance of 3892.25-3887.25 then on the downside my targets are 3878.75-3874.75, 3866.75-3863.25, Support at 3853.25-3847.25 if that breaks and then we have room to visit lower levels of 3839-3835.50, 3825.50-3820.25 and next support at 3811-3804.50, if the selling is strong as yday I expect us to test the bottom of this daily range we are in since we are currently at half point, those levels would be 3791.50-3787.75, 3780.50-3776.75 and KEY support at 3764.75-3758.25. On the upside holding above Key Support of 3892.25-3887.25 we can see a push to test 3901-3898, 3914.75-3910.75 and next Key Resistance at 3931.75-3927.25. Careful with longs today because we do expect margin call selling, will only be looking for longs if key levels hold and show support, other than that looking to short from Key levels down.
Support and resistance levels for Bitcoin 17 May 2022
BYBIT:BTCUSD These are the most Current Daily, Weekly and Monthly Levels for Bitcoin .
**feel free to copy this chart for your own use**
Support and resistance Definition (quoted from Investopedia.com)
The concepts of trading level support and resistance are undoubtedly two of the most highly discussed attributes of technical analysis . Part of analyzing chart patterns, these terms are used by traders to refer to price levels on charts that tend to act as barriers, preventing the price of an asset from getting pushed in a certain direction.
At first, the explanation and idea behind identifying these levels seem easy, but as you'll find out, support and resistance can come in various forms, and the concept is more difficult to master than it first appears.
Key Takeaways
Technical analysts use support and resistance levels to identify price points on a chart where the probabilities favor a pause or reversal of a prevailing trend.
Support occurs where a downtrend is expected to pause due to a concentration of demand.
Resistance occurs where an uptrend is expected to pause temporarily, due to a concentration of supply.
Market psychology plays a major role as traders and investors remember the past and react to changing conditions to anticipate future market movement.
Support and resistance areas can be identified on charts using trendlines and moving averages.
(end of quote)
Trading based on these levels, I would suggest entering trades based on a sign of strength (Long) or weakness (short) at these levels.
Never use Levels on their own, but enter trades based on confluence - i.e. Chart patterns, order flow, indicators, market structure

ES1! - "Ranges" 05/16/2022Expecting something like this to play out to clear some of the weak handed bears - We are still in a obvious down trend.
We've had 5 rejections of the 4043 level, allot of sellers have been absorbed and I expect a break through to occur. I'm looking for the Feb 24 lows rejection. If we break the trend line drawn on the chart, I'll re-evaluate my plan with my short positions.
I don't have a crystal ball and cannot predict future prices, but will be actively looking for a bottom to occur around the 2021 open / 2021 lows , if we break these levels I'll be looking at the 3230 - 3400 levels.

#ES Futures 5.16.22 OverviewToday we have inventory balancing our out 3971.50-4030.75 Range, we are above T+2 high which is 3961.75 which means we can see buy ins at levels above which is holding us up here and we were not able to extend over 4030.75 so far. Will we make a move out of this range today or will we spend time in this range for now until we are ready for next move? On the upside we have Key Resistance at 4025.25-4030.75 which we would need to break over and hold to see the upper levels of 4046-4042.25, 4061.50-4056.50 and next Key Resistance at 4084.50-4077.25. On the downside failure to get above 4030.75-4025.25 we can see lower levels get tested at 4012.50-4008.75, 3994.50-3988.75 and our Key Support at 3976.50-7371.50, as mentioned we should see buyers at lower levels as we have trapped shorts from T+2(Thursday) but if we do take out Key Support we must take out 3957.25-3953.25 to see any continuation lower, otherwise we will rotate back up. I expect a balanced day unless I see clear signs of us moving out of this balance.

#ES_F 5.13.22 OverviewYesterday we tested midpoint of the current range we are in on the daily, so far was a look below and fail. End of the day rally buyers were able to bring the price towards the T+2 low for today. All the sellers were taken out lower and in Globex be broke into the T+2 range and over out 3931.75-3927.25 Key Resistance, this morning we hit our next Key Resistance level of 3976.50-4971.50 and T+2 half back. So far it was look above and come back in so at the open will be watching for us to test lower levels down to 3957.25-3953.25, and 394.25-3940.25 where we should start seeing buying response, if we break under that we can test our Key support T+2 low area down to 3931.75-3927.25 but ideally we should see buyers step in before that if we will go higher today. If Key support holds and we can see a trip back over 3976.50-3971.50 and test the upper levels of that value zone, which are 3994.50-3988.75, 4012.50-4008.75 where we should see sellers because there is supply above, if we get through that then can test next Key Resistance of 4030.75-4025.25 and also the T+2 high area. Have to be patience we are in a market with supply, have to let things set up and show the way around important levels and not get caught up in the chop.

BTCUSDT High Time Frame Oder Block In this section we will discuss what a price action order block is and how it is currently relevant to Bitcoin’s price action.
An Order Block is a trade location that has a cluster of price action, creating a liquidity pool. Once price action expands from the region, it automatically becomes support or resistance – hence a block,
This area once penetrated will act as a range, causing a period of price action oscillation. The Order Block can be dissected into three sections, the high (resistance), the low (support) and the middle (equilibrium). Whichever region price action breaks from will lead to a continuation or a reversal in the overall trend.
In essence, Bitcoin can remain trading in the Order Block before until decisive bottoming or continuation structures are developed.
Hope this educational peace helps!

TSLA Chart ideaJust a few levels on TSLA I am watching.
Has been playing level to level very nicely.
Price now approaching previous support zone, will be watching to see if it breaks of gets another rejection

#CCJ is setting up for a bounce to the top sideAs you can all see from the daily chart CCJ pulled back on the Fib levels to that .50 area we wicked and are now potentially heading back up to potentially make new highs, me personally i would of much rather liked a pull back to .786 area before we got to see a new run to the top but either way i'm ready, looking at the options chain flow the 35 call for May 20 expiry looks to be primed as well as 34 and 32 call has a ton of oi on them as well waiting for numbers to update on the volume from yesterday to see how much is rolling into the oi or if we get a reduction in the oi levels we know people may be rolling out of those trades either way we should get an opportunity to make some nice gains off this play.

NASDAQ, uptrend Target Midpoint R2,R3Hi traders, the market is going higher.
Pls take a note about this, first of all, we might have a Fib 78%, retracement until 12980, keep checking the trend and the retracement level.
R3 14,656.83
R2 13,984.13
R1 13,740.27
PP 13,311.43
S1 13,067.57
S2 12,638.73
S3 11,966.03

FIL looks bullishVery technical asset. I think it will still come in the 19-20 zone. Then I see only one way. He may have sprains. I don't expect him to fly up from the current ones, the correction looks incomplete.
I am waiting for your response. It's interesting to hear your thoughts in the comments.
P.s. By the way, this is an interesting entry point for a medium-long time. The asset has fallen heavily (now x11 to the peak price). The coin is held by major players and funds.

🔵 DXY weekly TimeframeDollar index reach the "Covid19" region at 102 -103 range.
watch closely this area as we will soon see the upcoming FED rate on the 4th of May.
Break above or Reverse? Write your thought in the comment, Lets discuss💡

