#LEVER/USDT #LEVER#LEVER
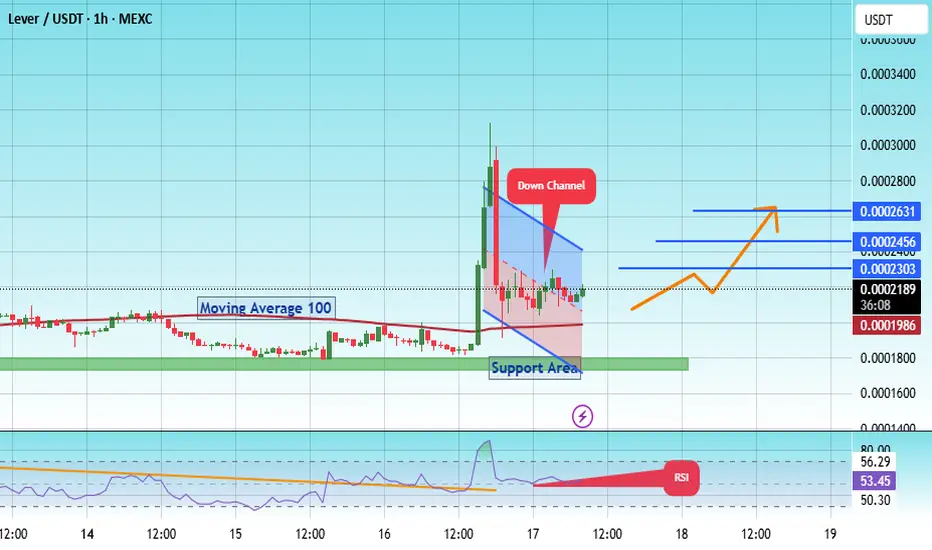
The price is moving within a descending channel on the 1-hour frame, adhering well to it, and is on its way to breaking it strongly upwards and retesting it.
We have support from the lower boundary of the descending channel, at 0.0001650.
We have a downtrend on the RSI indicator that is about to break and retest, supporting the upward trend.
There is a key support area (in green) at 0.0001764, which represents a strong basis for the upward trend.
Don't forget one simple thing: ease and capital.
When you reach the first target, save some money and then change your stop-loss order to an entry order.
For inquiries, please leave a comment.
We have a trend of stability above the Moving Average 100.
Entry price: 0.0002196
First target: 0.0002303
Second target: 0.0002456
Third target: 0.0002630
Don't forget one simple thing: ease and capital.
When you reach the first target, save some money and then change your stop-loss order to an entry order.
For inquiries, please leave a comment.
Thank you.
Leverusdtperp
#LEVER/USDT Forming Strong Falling Wedge#LEVER
The price is moving within a descending channel on the 1-hour frame and is expected to break and continue upward.
We have a trend to stabilize above the 100 moving average once again.
We have a downtrend on the RSI indicator that supports the upward move with a breakout.
We have a support area at the lower boundary of the channel at 0.0001915, acting as a strong support from which the price can rebound.
We have a major support area in green that pushed the price upward at 0.0001672.
Entry price: 0.0001955.
First target: 0.0002087.
Second target: 0.0002283.
Third target: 0.0002472.
To manage risk, don't forget stop loss and capital management.
When you reach the first target, save some profits and then change the stop order to an entry order.
For inquiries, please comment.
Thank you.

#LEVER/USDT#LEVER
The price is moving within a descending channel on the 1-hour frame, adhering well to it, and is on its way to breaking it strongly upwards and retesting it.
We have a bounce from the lower boundary of the descending channel. This support is at 0.00016000.
We have a downtrend on the RSI indicator that is about to break and retest, supporting the upward trend.
There is a key support area in green at 0.0001500, which represents a strong basis for the upward trend.
Don't forget one simple thing: ease and capital.
When you reach the first target, save some money and then change your stop-loss order to an entry order.
For inquiries, please leave a comment.
We have a trend of stability above the Moving Average 100.
Entry price: 0.0001750
First target: 0.0001880
Second target: 0.0002163
Third target: 0.0002427
Don't forget one simple thing: ease and capital.
When you reach the first target, save some money and then change your stop-loss order to an entry order.
For inquiries, please leave a comment.
Thank you.

#LEVER/USDT#LEVER
The price is moving within a descending channel on the 1-hour frame and is expected to break and continue upward.
We have a trend to stabilize above the 100 moving average once again.
We have a downtrend on the RSI indicator that supports the upward break.
We have a support area at the lower boundary of the channel at 0.0001404, acting as strong support from which the price can rebound.
Entry price: 0.0001529
First target: 0.0001795
Second target: 0.0002040
Third target: 0.0002333
To manage risk, don't forget stop loss and capital management.
When you reach the first target, save some profits and then change the stop order to an entry order.
For inquiries, please comment.
Thank you.

#LEVER/USDT Bullish ?#LEVER
The price is moving within a descending channel on the 1-hour frame and is expected to break and continue upward.
We have a trend to stabilize above the 100 moving average once again.
We have a downtrend on the RSI indicator that supports the upward break.
We have a support area at the lower boundary of the channel at 0.000270, acting as a strong support from which the price can rebound.
We have a major support area in green that pushed the price upward at 0.000268.
Entry price: 0.000276.
First target: 0.000295.
Second target: 0.000315.
Third target: 0.000336.
To manage risk, don't forget stop loss and capital management.
When you reach the first target, save some profits and then change the stop order to an entry order.
For inquiries, please comment.
Thank you.

LEVERUSDT 1D AnalysisLEVER ~ 1D Analysis
#LEVER This trade is very risky. Buy if you still have confidence in this coin with a short term target of at least 15%+ from this support.

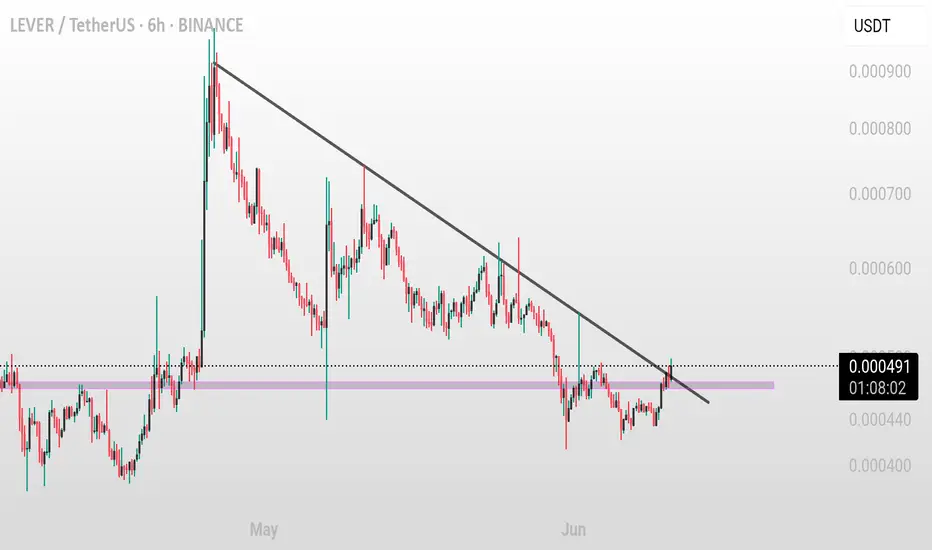
LEVER/USDT (6H) – Trendline Breakout in Progress LEVER/USDT (6H) – Trendline Breakout in Progress
Pattern: Descending Trendline Breakout
Timeframe: 6-Hour ⏱️
Pair: LEVER/USDT 💱
Published: June 10, 2025 📅
Technical Overview:
LEVER/USDT has been trading under a consistent downward trendline, making lower highs over several weeks. Price is now attempting a breakout above this resistance, showing signs of reversal and bullish momentum 📈
Potential Trade Setup:
Bullish Scenario ✅
Entry: On breakout and 6H candle close above 0.000520–0.000530
Targets:
* TP1: 0.000650–0.000680 🎯
* TP2: 0.000750–0.000800 🎯
Stop-loss: Below 0.000450–0.000460 🛑
Risk Management ⚠️
Wait for confirmation with strong candle close and volume to avoid fakeouts. If rejected, price may resume its downtrend or consolidate further.
Conclusion:
LEVER is testing a key resistance zone. Break and hold above trendline may confirm a trend reversal with upside potential 📊🔍
LEVERUSDT 5DLEVER ~ 5D Analysis
#LEVER Buy gradually from here with a short -term target of at least 20%+.

LEVERUSDT 5DLEVER ~ 5D
#LEVER if you still have Conviction on this coin,. Buy in stages from here with a minimum target of 20%++

LEVERUSDT Analysis: Strong Demand Zone IdentifiedThe blue box on the chart marks a significant demand zone , presenting a favorable opportunity for buyers.
Key Insights:
Demand Zone Potential: The blue box is a carefully chosen area with high potential for a market reaction, identified using techniques like volume footprint, liquidity heatmaps, and cumulative delta volume.
Entry Strategy: This zone aligns well for a potential buy setup if confirmation signals appear.
Market Context: Current market conditions demand patience and precise entries.
Confirmation Checklist:
Before taking a position, I will confirm using:
Cumulative Delta Volume (CDV)
Liquidity Heatmap
Volume Profile
Volume Footprint
Upward Market Structure Breaks on Lower Time Frames
Learn Trading Techniques:
Interested in learning how to identify and trade demand zones effectively? DM me for training on using CDV, liquidity heatmaps, volume profiles, and other professional tools.
Final Words:
Discipline and risk management are crucial in this volatile market. Stick to the plan and trade wisely. Best of luck!
If you think this analysis helps you, please don't forget to boost and comment on this. These motivate me to share more insights with you!
I keep my charts clean and simple because I believe clarity leads to better decisions.
My approach is built on years of experience and a solid track record. I don’t claim to know it all, but I’m confident in my ability to spot high-probability setups.
If you would like to learn how to use the heatmap, cumulative volume delta and volume footprint techniques that I use below to determine very accurate demand regions, you can send me a private message. I help anyone who wants it completely free of charge.
My Previous Analysis (the list is long but I think it's kinda good : )
🎯 ZENUSDT.P: Patience & Profitability | %230 Reaction from the Sniper Entry
🐶 DOGEUSDT.P: Next Move
🎨 RENDERUSDT.P: Opportunity of the Month
💎 ETHUSDT.P: Where to Retrace
🟢 BNBUSDT.P: Potential Surge
📊 BTC Dominance: Reaction Zone
🌊 WAVESUSDT.P: Demand Zone Potential
🟣 UNIUSDT.P: Long-Term Trade
🔵 XRPUSDT.P: Entry Zones
🔗 LINKUSDT.P: Follow The River
📈 BTCUSDT.P: Two Key Demand Zones
🟩 POLUSDT: Bullish Momentum
🌟 PENDLEUSDT.P: Where Opportunity Meets Precision
🔥 BTCUSDT.P: Liquidation of Highly Leveraged Longs
🌊 SOLUSDT.P: SOL's Dip - Your Opportunity
🐸 1000PEPEUSDT.P: Prime Bounce Zone Unlocked
🚀 ETHUSDT.P: Set to Explode - Don't Miss This Game Changer
🤖 IQUSDT: Smart Plan
⚡️ PONDUSDT: A Trade Not Taken Is Better Than a Losing One
💼 STMXUSDT: 2 Buying Areas
🐢 TURBOUSDT: Buy Zones and Buyer Presence
🌍 ICPUSDT.P: Massive Upside Potential | Check the Trade Update For Seeing Results
🟠 IDEXUSDT: Spot Buy Area | %26 Profit if You Trade with MSB
📌 USUALUSDT: Buyers Are Active + %70 Profit in Total
🌟 FORTHUSDT: Sniper Entry +%26 Reaction
🐳 QKCUSDT: Sniper Entry +%57 Reaction
📊 BTC.D: Retest of Key Area Highly Likely
I stopped adding to the list because it's kinda tiring to add 5-10 charts in every move but you can check my profile and see that it goes on..

LEVERUSDTLEVER ~ 1W
#LEVER If this Support block is retested again. Don't hesitate to buy. So far this support block continues to maintain prices.
minimum target 20%++

LEVERUSDTLEVER ~ 1W ✅
#LEVER If this Key Support is retested again. Don't hesitate to buy. So far this support block continues to maintain prices.

LEVER ANALYSIS🚀#LEVER Analysis :
🔮#LEVER is trading in a symmetrical triangle pattern on the daily timeframe Also there is an instant support zone💁♂️
We could expect a breakout of the symmetrical triangle pattern and could expect a potential bullish move📈
Expect a bullish wave of around 25% in the coming weeks
🔰Current Price: $0.001865
🎯 Target Price: $0.002310
⚡️What to do ?
👀Keep an eye on #LEVER price action. We can trade according to the chart and make some profits⚡️⚡️
#LEVER #Cryptocurrency #TechnicalAnalysis #DYOR

Lever/Usdt Plan The Lever/USDT pair shows promise for a breakout. With increased volume, it may significantly rise. Keep an eye on it as I anticipate a strong breakout in the coming days. Please note that this is not financial advice; do your own research before making any decisions.

LEVERUSD 1WLEVER ~ 1W
#LEVER This is the Buy zone Since this Chart was created. It is very interesting to re-accumulate in this zone, with a long-term target of at least 20%+. Make purchases gradually.

LEVERUSD 1WLEVER ~ 1W 📈
#LEVER Looks like the accumulation has been completed. Make purchases gradually from here, with a minimum target of 20%++

Lever Still Good For Mid-term Leverusdt
Higher time-frame
Breakout
already confirmed as expected
Expecting big bullish rally soon
100-150% expected
It's not financial advice

LEVER/USDT A successful breakout, Possible to make New ATH!💎 LEVER has recently undergone significant market dynamics. Currently, LEVER is attempting to backtest the Bearish OB area after facing hard rejections twice before.
💎 If LEVER successfully breaks out from this area, it could probability lead to a new all-time high and potentially reach our target area.
💎 However, if LEVER fails to break above the supply area again, there's a possibility that the price will retreat downwards towards the demand area around 0.002 to establish new momentum.
💎 In the demand area, LEVER must bounce upwards to resume its upward trajectory. However, if LEVER breaks below the demand area, it could indicate continued downward movement, potentially revisiting the bottom support level.

Lever/USDT Big Breakout Lever/USDT
🔍 Breakout Confirmed as seen on the chart. Expecting a significant bullish rally incase of succesful retest 🐂
Anticipating a 100-150%% bullish move in the mid-term 📈🚀
Disclaimer: This is not financial advice. Do Your Own Research

LEVER/USDT Break is confirmed! Could the price back more upward?💎 LEVER has recently shown significant market dynamics. Currently, LEVER has broken out of the symmetrical triangle pattern and is now in the process of retesting before potentially continuing its upward movement.
💎 If this retesting phase holds, we could see a significant upward movement, probability leading to a retest of our target bearish OB area.
💎 However, if LEVER fails to bounce during the retesting phase and falls back below the trendline, a false breakout scenario is confirmed. In such a case, LEVER may return to a downward trajectory, testing the support trendline once again.
💎 The support trendline is a critical area to watch. If LEVER fails to hold above this level and breaks below the support trendline, it would signal a shift to a downward trend, potentially leading to further declines.

LEVER COIN PRICE ANALYSIS AND NEXT POSSIBLE MOVE !!LEVER Coin Short Term Possible Moves Near Me !!
• Support & Resistance Clear on a Chart.
• On All timeframe charts Short term Almost Look Overbought...Sell spot bags if you are Holding.
Take Trades only if setups meat your strategy ....
We just share our thought Not Confirm trades...🐳
FOLLOW US FOR MORE FREE ANALYSIS !!

LEVERUSDTLEVERUSDT is in strong bullish trend.
As the market is consistently printing new HHs and HLs.
currently the market has given the breakout from previous high, if the market sustains this breakout the next target could be 0.001680

Lever detailed analysis #Lever on Big daily chart formed a falling wedge, broke it and retested it successfully which makes it Bullish for long term
But in 4hr chart, It's forming a triangle with red and green trendlines. It's not broken yet. If it breaks the green trendline then it will pump huge.
Also it's forming a head n shoulder pattern , it's breakout will happen when same green trendline will break.
Monday is usually red, means prices go down. So, for lever trade, timing is very important. For complete signals contact for VIP.
