Linear Finance (LINA) formed Gartley for upto 20.50% pumpHi dear friends, hope you are well and welcome to the new trade setup of Linear Finance (LINA) with US Dollar pair.
Previously we caught more than 190% rally of LINA as below:
Now on a 4-hour time frame, LINA has formed a bullish Gartley for the next price reversal
Note: Above idea is for educational purpose only. It is advised to diversify and strictly follow the stop loss, and don't get stuck with trade.
Lina

LINAUSDT Formed Triangle Pattern.LINAUSDT Technical analysis update
Buy zone : Below $0.0146
Stop loss : $0.0139
Take Profit 1 : $0.0153
Take Profit 2 : $0.0166
Take Profit et 3 : $0.0186
Thanks
Hexa

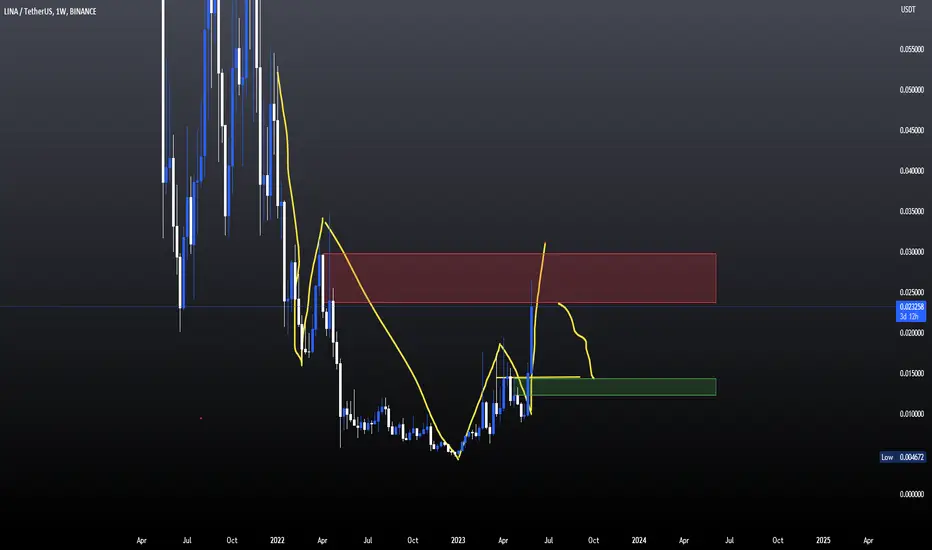
From Down to Uptrend: Assessing the LINAUSDT Long-Term Potential💎 #LINAUSDT has recently showcased remarkable technical strength, establishing a robust support level at $0.0125. This notable support zone is characterized by the convergence of two key trendlines. The transformation of the previous downtrend trendline into a support line indicates the potential continuation of the long-term uptrend for #LINA.
💎 Today, #LINA experienced a decisive rebound from the 61.8% Fibonacci support level, further solidifying the bullish case. Additionally, the Volume Profile level serves as a prominent demand zone, further reinforcing the positive price dynamics. As long as #LINA avoids creating new lower lows, there is a high probability of witnessing an impressive 80% price surge, with a target set at the double Fibonacci resistance level of $0.0252.
💎 In the event that the bullish trend is confirmed, it is essential for Paradisers to remain attentive to minor resistance levels depicted in the chart. These levels may introduce temporary hurdles along the upward trajectory. This presents a compelling long-term buying opportunity for CRYPTOCAP:LINA , and we are committed to keeping you well-informed about any significant price developments. Stay tuned for updates as we closely monitor the exciting price dynamics surrounding #LINA.

Lina shall we??? Bullsssss!!!I look at lina and i see a W pattern here
now i wait for a retracement to 0.01425 and then we can have a long to 0.017
Tske this trade and see massive profits
follow me for more ideas
check out my previous trades and ideas and see how well they are going

LINA new volume and new ascending channel 🚀💣🚀Hello 🐋
based on the chart
the price is in the ascending channel and become close to the round number and the channel resistance, and after a long time range and correction to the downside again we can see new volume for the price 📖
if
the price breaks the channel resistance to the upside, we can see even more gain for the price in log term targets 🚀💣
Please, feel free to share your point of view, write it in the comments below, thanks 🐋

Lina's current statusAfter a correction to the previous accumulation area. Lina's price found support when the price stopped falling in this zone, accumulated briefly, and rallied again after breaking the downtrend line.
Currently, Lina's price has increased by ~50% since the break. There is a very large volume bar, so we can consider this as an important level for an uptrend.

Lina's Bullish Stride: A Technical AnalysisThe token LINA, paired with USDT, reveals an interesting picture on both its 1-hour and 4-hour charts. At the time of analysis, the price is at $0.014283, a significant 16% increase over the last 24 hours.
On the 1-hour chart, the Fibonacci retracement levels are drawn from the swing low to the swing high, indicating the zero level at $0.0143, a half level at $0.01193, and the first level at $0.009560. Currently, the price is oscillating around the zero Fibonacci level after testing and bouncing from the first level a couple of days ago.
The Bollinger Bands, a tool that measures price volatility, reveals an upper band at $0.014772, a middle one at $0.013445, and a lower band at $0.012117. The RSI is at 72, bordering the overbought territory, which could potentially signal a retracement or consolidation in the near term.
In terms of volume, the oscillator stands at -3.77%, indicating a decrease in recent trading volume, while the On-Balance-Volume (OBV), an indicator used to predict price movements based on volume flow, is at 25 billion. The Stochastic Oscillator, a momentum indicator, shows a reading of 76, further echoing the sentiment of a slightly overbought market condition.
An important level to watch is the 50-period Exponential Moving Average (EMA), which currently stands at $0.012615. This line often acts as a dynamic support or resistance level, and the price remaining above it can be a bullish sign.
Moving on to the 4-hour chart, we see different Fibonacci levels, with the zero level being $0.009560, the half at $0.0195, and the first at $0.029440. The 4-hour timeframe can provide a broader view of the market trend, which can be crucial for decision-making.
To sum up, Lina shows promising bullish signals, with the price maintaining above key Fibonacci and EMA levels. However, the potential overbought signals suggest caution. As always, individual traders should consider these indicators alongside their personal risk tolerance and strategy.

LINA Linear Finance Upside PotentialThe recent price action on LINA Linear Finance suggests a potential reversal in the making. The 200-day Moving Average has played a significant role as a strong support level since the golden cross reversal occurred. This bullish signal indicates a shift in momentum and a potential upward trend for LINA.
Considering this technical setup, my price target for LINA is set at the $0.0195 resistance level. If the current bullish momentum continues, breaking through this resistance could open the doors for further upside potential.
Overall, the recent price action and the support from the 200-day Moving Average indicate a potential reversal on LINA Linear Finance, with a price target of $0.0195 as a key resistance level to watch in the coming days.
Looking forward to read your opinion about it.

we are preparing for an attempt to reverse the monthThis week, as the middle of the month passes, you can prepare for an attempt to reverse not only the altos but also the tops. In particular, the broadcast with the opening of the new month went according to a negative scenario for a retest of 1750-1600 under the pressure of a cue ball. But at the moment, the sales period is coming to an end and from tomorrow we can expect an increase in buyer activity. In an optimistic scenario, the goal will be to close the half-year above the strong levels of 2100-2250. That would ensure growth in the second half of the year.
I still expect the continuation of growth in the eth/btc pair to the area of 0.1. After the currently drawn lower shadow on the monthly candle, there is also a high probability of the candle turning bullish with trend consolidation. That is, according to the general picture, I expect a new wave of falling bitcoin dominance.
As part of the upcoming growth wave, it is possible to make top-ups on the most oversold coins such as uft vib pros for cvp wtc ooki dock perl pnt asr atm torn. Oax epx fida amb snm fio pivx burger, which are well suited for scalping, also came to powerful supports with the potential of rollbacks up to 50-70%+.

LINA new volume and more gain 📖🚀Hello 🐋
based on the chart
again we can see new volume for the price 📖
we
expect to see more gain for the price in log term targets 🚀💣
Please, feel free to share your point of view, write it in the comments below, thanks 🐋

LINABUSD possible target 0,070 USDLINABUSD target is 0,070 by the end of this year.
I'm fully in....

$LINA looks bullish for another leg higherDon't fade this strength. Bull flag on the 4h, measured move, gets us right up the logarithmic golden pocket. Funding is also quite negative, so a lot of shorts to provide liquidity to whales to fill their shorts from higher up. This is following similar price action to ARPA.

lina coin update ! lina coin bearish ?lina Coin Next Possible scenerio near me!!
Once its already touch now its resistance. If again lina coin price reachbunder this range then we look for oportunity to open trade in short on lina coin.
High manipulation expected So Don't invest upto 2% ( with leverage 10x)
follow for more

Keep an eye on $LINA/USDTKeep an eye on $LINA/USDT
Making LL HH currently on LH region
Kindly wait for breakout of the structure and target region marked
Did you find this crypto market analysis helpful? Stay updated about the latest crypto market update.
Please continue to follow my analysis and feel free to ask any queries, you may have. I am here to assist you.
TradingView: @FarmanBangashh
We passed the sluggish middle of the block. we are preparing forStarting tomorrow, the last month of the current quarter opens, I think it's worth summarizing the interim results and assessing the prospects. This month was extremely sluggish, because it is central in the quarter and there was a struggle for the direction for the second half of the quarter. After passing through the middle of the quarter, we saw a significant breakthrough in the dominance of the altos and an attempt to move to growth on the air. In the medium term, the dynamics are quite good, because the current monthly candle shows the predominance of purchases on the ether, which with a high probability can become a signal for purchases until the end of the quarter and, accordingly, the first half of the year with the opening of a new semi-annual candle with growth.
In an optimistic scenario, a new monthly will open above 1850, which will lead to an increase in the area of 2500 within a month or two. When opening below 1850 in the new month, there is a possibility of a deeper pullback on the quarterly and semi-annual schedule with test attempts of 1750 and 1600, which will significantly complicate the situation, but so far the probability of this is significantly inferior.
So far, I continue to closely monitor uft vib pros for cvp wtc ooki dock perl pnt asr atm, where the largest number of unprocessed targets remain. Transferring some coins to the innovation zone, as I assumed, is a common speculation, immediately followed by a buy-off on drep with the development of goals and significant activity of buyers on perl and pnt. After trading, I think perl will show no less interesting dynamics than drep with an attempt to test the 0.06-75 range, as soon as the ground appears against the background of the growth of the dominance of altos or ether. The transfer from the launchpad zone to the innovative one, in my opinion, is an increase in the status for the token. According to torn, there is also a series of speculations in my opinion, in order to throw off the crowd and hold the violas at the bottom, which requires negative rumors and examples. While technical goals remain up to $ 17-21, I continue to hold positions on it.
They are inferior in potential, but they have come to powerful epx front gft amb supports that can show an increase of up to 70-100%. They are also approaching supports with possible rebounds up to 40-60% wing akro srm farm snm fis om vite hard voxel df.
In the new month, I expect the growth of the eth/btc pair to continue in the area of 0.100-125. That is, attempts to increase the ether even in the case of a cue ball going to retest 21-22.5K. But it is still difficult to say whether the growth of the ether will help the violas break away from the cue ball.

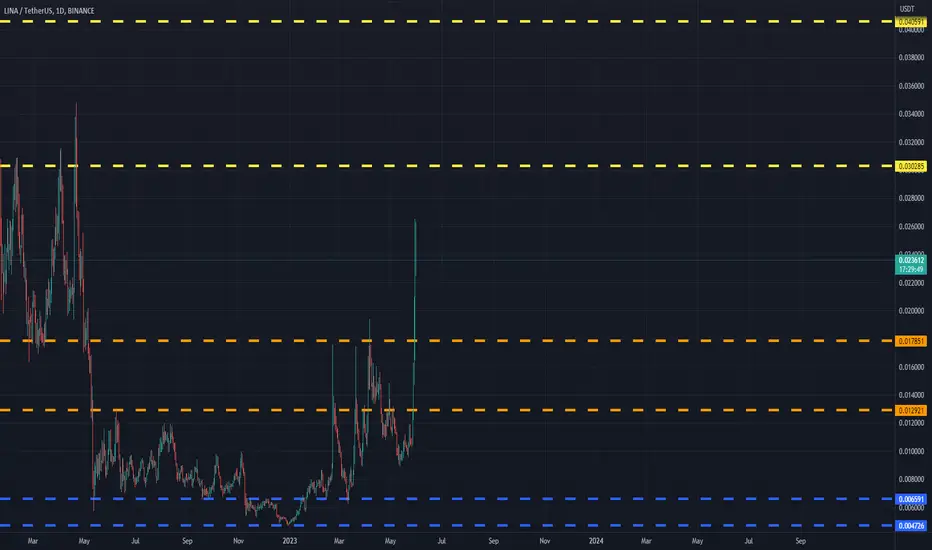
LINAUSDT(Linear Finance) Daily tf Range Updated till 31-05-23LINAUSDT(Linear Finance) Daily timeframe range. over 190%+ retraced within some days thats actually some insane gains right there. it got some good volume here. not far away from its #0.030285 level resistance. only possible for it to reach there! need to keep the same volume as of now.
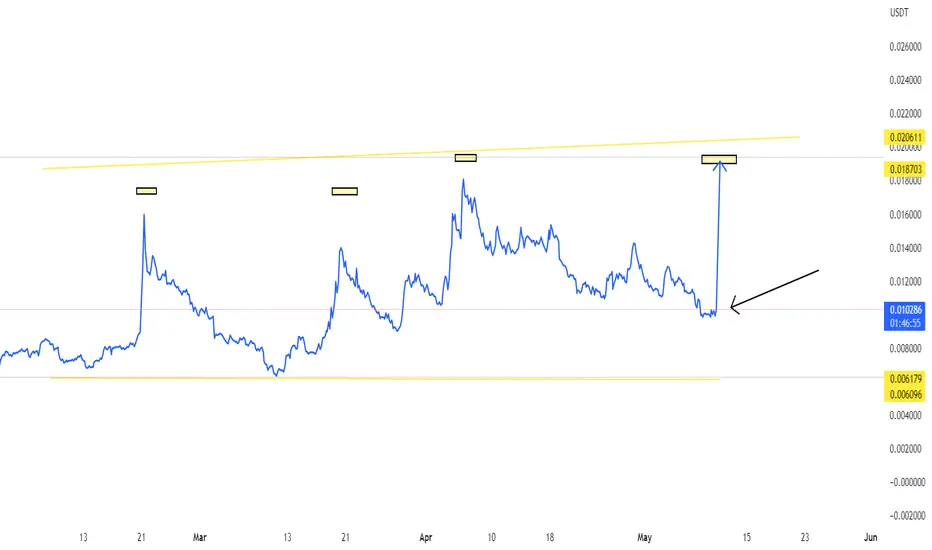
Crypto Lina (Gonna pull back?)
View On LINA USDT (31 May 2023)
LINA is in
* Very Bullish in short term (Intraweek)
* Very Bullish term (1 to 3 months)
* Bullish in Long term (3 months onward)
LINA is a crypto market darlin recently but I am expect some sort of pull back as the buying has dried off.
I am expecting it will pull back 0.0224 and 0.0206 soon.
DYODD, all the best and read the disclaimer too.
Feel Free to "Follow", press "LIKE" "Comment".
Thank You!
Legal Risk Disclosure:
Trading crypto, foreign exchange or CFD on margin carries a high level of risk, and may not be suitable for all investors.
The high degree of leverage can work against you as well as for you.
Before deciding to trade foreign exchange you should carefully consider your investment objectives, level of experience and risk appetite.
The possibility exists that you could sustain a loss of some or all of your initial investment and therefore you should not invest money that you cannot afford to lose. You should be aware of all the risks associated with foreign exchange trading, and seek advice from an independent financial advisor.

LINA COIN PRICE PREDICTION✅ LINA COIN PRICE PREDICTION✅
🔥 Price on the daily chart has broken the important Resistance at around $0.02🔥
If the Price Comes Down to $0.02 you can BUY..
🚀🎯You can target around $0.03 that's around 50% Gains🎯🚀
👉 Follow me for more opportunities.

LINA COIN PRICE PREDICTION✅ LINA COIN PRICE PREDICTION✅
🔥 Price on the daily chart is at a good confluence level of Resistance🔥
If it Goes Down..
🚀🎯You can Target around $0.0120 that's around 35% Gains🎯🚀
👉 Follow me for more opportunities.

LINA: Tracking New DevelopmentsGreetings Traders,
Our spotlight today returns to LINA, a key participant in the crypto sphere. At present, LINA's market price is 0.018002.
Significant Technical Observations
Upon examining the updated data for LINA, several significant insights emerge:
Relative Strength Index (RSI) and Stochastic: With an RSI of 81 and stochastic of 69, LINA is demonstrating strong bullish momentum. However, the high RSI could indicate overbought conditions, suggesting potential price correction.
Bollinger Bands: Currently, LINA's price is near the upper Bollinger Band at 0.018982, with the middle and lower bands at 0.013668 and 0.008354, respectively. This indicates strong upward price movement but also a potential overbought situation.
Volume Oscillator: The volume oscillator sits at 6%, indicating a slightly bullish volume.
MACD: The MACD value of 0.001837 signals potential bullish momentum, aligning with other positive indicators.
Fibonacci Levels: The Fibonacci levels for the 4-hour timeframe have evolved to 0.01119, 0.012904, 0.014528, 0.016152, and 0.017155. These levels should be watched closely as potential support or resistance.
EMA 100: The 100-period Exponential Moving Average (EMA) currently stands at 0.011674, serving as potential support.
Resistance Levels: Two notable resistance levels are found around 0.018599 and 0.024154. These should be monitored closely for price reactions.
Closing Remarks
Given these updated indicators, traders should maintain a vigilant watch over LINA for emerging trading opportunities. The interplay between price movements and these technical indicators may offer insights into future market trends.
Remember, trading carries inherent risk. Do your own research and consider your risk tolerance before engaging in any trading decisions.
Stay tuned for further updates on LINA and other digital currencies. Here's to successful trading!

Lina finally breaks Crucial Trendline Seems Like Already bottomed Out Descending trendline breakout Has Already with Strong Momentum + Good Volume Expecting Massive Bullish Wave In Midterm Expecting 300 to 320% bullish Wave

Expecting 45 to 50% bullish wave In Lina Seems Like Ready For Massive Bullish impulse Descending Channel breakout Has already Confirmed Retesting In Process Incase Of successful Retest expecting 45 to 50% bullish Wave
