LINKUSD LINK USD CRYPTO CFD on PEPPERSTONE
Higher local rejections aren't marked because they appear to be tested, if you're doubtful, mark them yourself.
Initial lows, supports, untested spots marked with hotpurple box. Testing support currently, also a local low has been created, either we regain it and hold to continue with the move up.. or more likely, break below and push on to retest initial lows that created this whole trend up.
Always refreshing charting a different ticker, removes imprinted biases, lets you acknowledge key spots, and removes all the bs.
Anyways, i'll be watching this ticker over the next week or two. Once again LINKUSD LINK USD CRYPTO CFD on PEPPERSTONE
gravy
LINKBTC

LINK ROADMAP (1D)Hi, dear traders. how are you ? Today we have a viewpoint to SELL/SHORT the LINK symbol.
It seems that we are in a large diametric that we are at the beginning of wave E of falling. We have two targets in front of us that I specified
For risk management, please don't forget stop loss and capital management
When we reach the first target, save some profit and then change the stop to entry
Comment if you have any questions
Thank You

LINK Chainlink Oversold at its last support | Growth thesis !Chainlink (LINK) presents a promising investment opportunity, especially in light of recent market developments. With BlackRock's filing for a Bitcoin trust rather than an ETF and the SPX reaching a 52-week high, the market sentiment appears to be bullish. Despite being oversold and finding support at its last line, Chainlink's technical indicators suggest the potential for a rebound.
Considering the oversold conditions, investors could see an attractive entry point for Chainlink. The price target of $8.70 adds to the positive outlook, indicating the potential for substantial growth. A technical rebound, supported by market dynamics, could further bolster Chainlink's upward trajectory.
Chainlink's unique value proposition as a decentralized oracle network, facilitating secure and reliable data integration for smart contracts, positions it well for continued growth. Its technology plays a crucial role in the advancement of blockchain applications across various industries, offering real-world solutions and bridging the gap between blockchains and external data sources.
Chainlink's strong partnerships with industry-leading organizations and its expanding network adoption provide a solid foundation for its future success. These collaborations reinforce Chainlink's credibility and market position, potentially attracting more investors and users to the platform.
Looking forward to read your opinion about it!

LINK breaking down for a 5th waveVery clean count on LINK, we just broke down from massive support range, if LINK continues to hold below without a quick move back up into the range we should expect a full 5th wave down to finalise the correction.
Target $2.5

LINK TO THE PASTHistorically Link has been brilliant to trade from a technicals perspective.
You can see the prior consolidation channel and the 2 x Head and Shoulder patterns that played out beautifully. You can also see how the green circles were great entry levels
At present we appear to be in a consolidation box awaiting breakout.
I am leaning Long Term Long for the following reasons:
- On Balance Volume is increasing
- Break above 50 week MA
- RSI pressing upwards
- 90% correction in price since May 2021 (when we broke RSI resistance line, important to watch for this and exit trade if it occurs).
- LINK/BTC is also in a downward channel and looks ready to break out
- You will see from my recent BTC Dominance chart i believe we will have a slight pull back in dominance over coming weeks offering ETH and Alts an opportunity to make some gains
- The prior patterns, the H&S, Parallel channel and subsequent H&S top, these all lasted between 52 and 72 weeks. We are in this current consolidation pattern almost 50 weeks. It is probable that we get a break out within 2 - 22 weeks.
Trade Management (swing trade)
- A retest of the 50 MA would be a reasonable entry. Bottom of the box event better.
- Break below box, exit trade.
- Trade timeline 2 - 22 weeks (explained above)
- If already in the trade I would be keen to exit the trade once in oversold territory on the weekly RSI (We can always reenter it later).
PUKA

LINK on its final short leg down before the upthrust!
Get ready to DCA folks. LINK is about to fakeout and shakeout. My TP for DCA'ing will start below $5 all the way down to 4.x. Accumulate, accumulate, accumulate!
THIS IS NOT FINANCIAL ADVICE!
Cheers

LINKBTC short to 0.000273 weekly closed bearish
I am canceling my long now, strong signal for changing the shoes
First target is black line, breaking of it will send us to white one

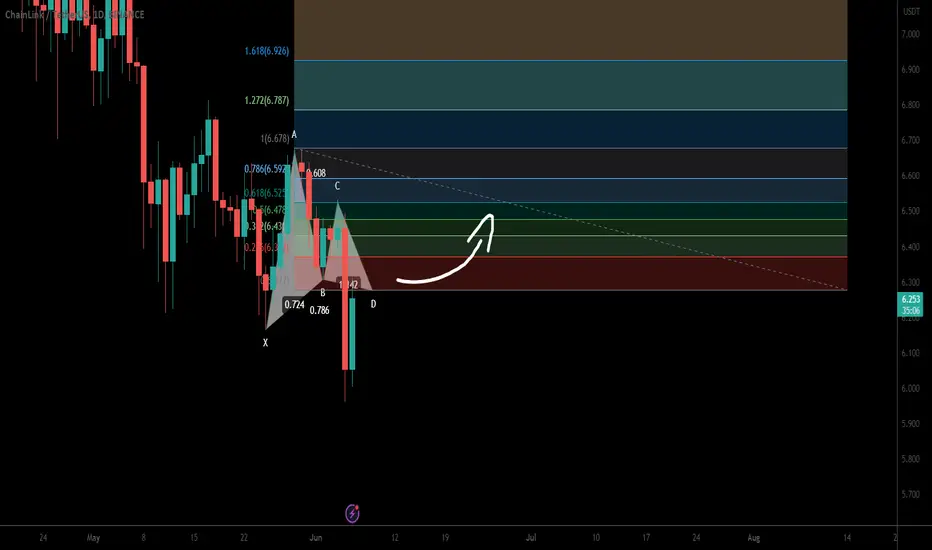
Chainlink (Link) formed Gartley for another price reversal moveHi dear friends, hope you are well and welcome to the new trade setup of Chainlink (Link) with US Dollar pair.
Previously we caught almost 30% pump of LINK as below :
Now on a daily time frame, LINK has formed a bullish Gartely move for a massive bullish reversal move.
Note: Above idea is for educational purpose only. It is advised to diversify and strictly follow the stop loss, and don't get stuck with trade.
LINK - It is timeLink has been consolidating in the same tight zone for 330 days. After that long period of accumulation, I predict the move up will probably be large and sustained for at least 2-3 big legs up.
The problem is that we've had 3 fake-outs where price closed above $8.5 and then dumped hard right after. With that in mind, I plan on buying the next time LINK closes above 8.5 and cutting my losses if I see it close back below the support/resistance (S/R) zone highlighted in red, meaning below $8.
If the breakout is real, a I think and hope it is, then I intend to take profits between $19-20, and keeping the rest for the possibility that LINK becomes a beartime runner again, like last time.

Linkusdt Big Drop Loading Linkusdt
Linkusdt not looking good link needs to hold this support and breakout the upper resistance incase of rejection from 6.85-7 I am exoecting big drop
Dyor

Quick look at LINKHere's a quick look at the LINK daily chart. As we can see, the price is trying to hold above the resistance zone, and if the price manages to sustain its position above the resistance zone, then a move to the red trendline is likely to happen! Therefore it is recommended to monitor the resistance zone in case it does sustain its position above it!
-------------------------------------------
Recent Altcoin trades:
ARB / USDT: 30% profit!
ROSE / USDT: 5% profit!
-------------------------------------------
About our trades:
Our success rate is notably high, with 10 out of 11 posted trade setups achieving at least their first target upon a breakout price breach (The most on TW!) . Our TradingView page serves as a testament to this claim, and we invite you to verify it!
-------------------------------------------
If you like the content, then make sure to comment and like the post :D
Follow me for daily profitable trading setups.
BTC dictates the market. If BTC falls, then Alts will drop as well. Trade safe!

LINK BUY SETUPHi, dear traders. how are you ? Today we have a viewpoint to BUY/LONG the LINK symbol.
For risk management, please don't forget stop loss and capital management
When we reach the first target, save some profit and then change the stop to entry
Comment if you have any questions
Thank You

LINK above the Daily EMA200LINK has managed to rise above the 200-day moving average in the daily time frame. This movement is expected to be accompanied by a long-term bullish wave to the price of HKEX:12 and $18. Try to make your purchases step by step in the current area with low risk and hold until you reach the specified targets. Consider below the support area as a stop loss.

✳️ Chainlink vs Bitcoin Long-Term Higher Low | Trade or Learn?You need multiple signals to reach a conclusion...
Should I just go straight to the numbers, the chart with its potential or explain the signals?
Because one way is like teaching/learning, the other one is like showing an opportunity/trading.
12-April ends in a Doji with a perfect (-9), that's the TD Sequential indicator:
This is followed by three green candles, rising volume, bullish divergence with the RSI as the RSI moves above 50.
New low yet above 50 that's a very strong signal.
Also, we have multiple bullish signals and that's all we need.
Finally, the long-term higher low on the main chart.
That's it!
LINKBTC goes bullish.
Enjoy your weekend.
Namaste.

LINK/BTC - Chainlink: BBand_Breakout◳◱ A Bollinger Band breakout has been identified on the BIST:LINK / CRYPTOCAP:BTC chart. The price has moved outside of the upper Bollinger Band, indicating a potential bullish trend. The next resistance key levels are located at 0.0002629 | 0.0002714 | 0.0002847, and the major support zones can be found at 0.0002496 | 0.0002448 | 0.0002315. Consider buying at the current price zone of 0.0002577 and targeting higher levels.BBand_Squeeze
◰◲ General info :
▣ Name: Chainlink
▣ Rank: 21
▣ Exchanges: Binance, Kucoin, Huobipro, Poloniex, Bittrex, Kraken
▣ Category/Sector: Services - Data Management
▣ Overview: Chainlink is a decentralized oracle network. It aims to serve as a middleware between smart contracts on smart contracting platforms and external data sources, allowing smart contracts to securely access off-chain data feeds.
◰◲ Technical Metrics :
▣ Mrkt Price: 0.0002577 ₿
▣ 24HVol: 151.488 ₿
▣ 24H Chng: 2.588%
▣ 7-Days Chng: 9.90%
▣ 1-Month Chng: 17.55%
▣ 3-Months Chng: 17.09%
◲◰ Pivot Points - Levels :
◥ Resistance: 0.0002629 | 0.0002714 | 0.0002847
◢ Support: 0.0002496 | 0.0002448 | 0.0002315
◱◳ Indicators recommendation :
▣ Oscillators: BUY
▣ Moving Averages: STRONG_BUY
◰◲ Technical Indicators Summary : BUY
◲◰ Sharpe Ratios :
▣ Last 30D: 1.58
▣ Last 90D: 1.09
▣ Last 1-Y: -0.25
▣ Last 3-Y: 0.78
◲◰ Volatility :
▣ Last 30D: 0.67
▣ Last 90D: 0.68
▣ Last 1-Y: 0.93
▣ Last 3-Y: 1.17
◳◰ Market Sentiment Index :
▣ News sentiment score is N/A
▣ Twitter sentiment score is 0.59 - Bullish
▣ Reddit sentiment score is 0.87 - V. Bullish
▣ In-depth LINKBTC technical analysis on Tradingview TA page
▣ What do you think of this analysis? Share your insights and let's discuss in the comments below. Your like, follow and support would be greatly appreciated!
◲ Disclaimer
Please note that the information and publications provided are for informational purposes only and should not be construed as financial, investment, trading, or any other type of advice or recommendation. We encourage you to conduct your own research and consult with a qualified professional before making any financial decisions. The use of the information provided is solely at your own risk.
▣ Welcome to the home of charting big: TradingView
Benefit from a ton of financial analysis features, instruments and data. Have a look around, and if you do choose to go with an upgraded plan, you'll get up to $30.
Discover it here - affiliate link -

LINKUSDT ready to 🚀🚀#LINKUSDT
we are in over sold area in daily chart time-frame and we are in very important and strong support zone i expect the price will fly to the target at the chart MACD is showing bullish RSI showing bullish EMAs is neutral ZELMA is showing uptrend-move Ichimoku cloud is bullish Fib retracement is neutral Accumulation distribution is bullish i expect there will be a correction move

LINK LONG SETUPHi, dear traders. how are you ? Today we have a viewpoint to BUY/LONG the LINK symbol.
For risk management, please don't forget stop loss and capital management
When we reach the first target, save some profit and then change the stop to entry
Comment if you have any questions
Thank You

Inverse Chart: Cup n' Handle - Short LinkThere's an inverted cup/handle on the weekly link/btc chart. I've inverted the chart. Short link vs. bitcoin if we breach and hold beyond the neckline. Measured 1x and 1.5x targets are shown on the chart. Dashed line is 0.5x.

LINKBTC - Falling Wedges Within Down ChannelLINKBTC is showing a falling wedge within a down channel
Once the bottom of the wedge is reached it is possible that price will break out of the channel
Bearish within channel, bullish out of channel

LINK CAN MAKE A CORRECTIONHi, dear traders. how are you ? Today we have a viewpoint to BUY/LONG the LINK symbol.
For risk management, please don't forget stop loss and capital management
When we reach the first target, save some profit and then change the stop to entry
Comment if you have any questions
Thank You

The judement is your'sThe observed trend indicates a decline. Therefore, a short position is recommended.

To finish long sideways and ascend...Hello?
Traders, welcome.
If you "Follow", you can always get new information quickly.
Please also click "Boost".
Have a good day.
-------------------------------------
(LINKBTC 1W Chart)
-------------------------------------------------- --
(LINKUSDT chart)
------------------------------------------
(LINKUSDT 1W Chart)
It has been showing sideways movements around the HA-Low indicator for quite some time.
Accordingly, it is expected to show an upward trend in the near future.
(1D chart)
If price holds above 7.601-7.820, I would expect a move towards 9.869.
If not, you should check for support around 6.698.
Therefore, it is important not to fall below the downtrend line or 6.698.
-------------------------------------------------- -------------------------------------------
** All descriptions are for reference only and do not guarantee profit or loss in investment.
** Even if you know other people's know-how, it takes a considerable period of time to make it your own.
** This is a chart created with my know-how.
---------------------------------

CHAINLINK: $LINK Accumulation✅My biggest 2023 position is $LINK long, bought multiple times in this range since weeks. Anything below $6 is a good-buy IMO. A breakout is incoming once economic data shows soft-landing signs while FED starts to cut interest rates.
Chainlink allows blockchains to securely interact with external data feeds, events and payment methods, providing the critical off-chain information needed by complex smart contracts to become the dominant form of digital agreement.
This is valid unless the price breaks below this accumulation range! My SL is 5% below this box's support.
I will keep updating this trade here, make sur you follow me to get alerts!
