Linklong

LINKUSDT On The Edge!! BreakOut ?Dear Friends ,
I would love to share what I found in my charts for LINK . I see a far too familiar trend on TA where we are near edge of breakout for ChainLink at this point. If I am wrong we break downwards, and I will admit it!
Higher-Highs on 1H, 4H charts.
Late March LINK had been in the mud, which it recovered and began steady journey.
We are at the Squeeze stage , since couple days. Tightening price action!
First target to overcome resistance near $35-$36 . My final target at $39 range . I am bullish on LINKUSDT TA.
All my EMA targets hit during last downward corrections completed.
What more can I say, 🤷♀️ DYOR !
Follow 🚶
Like 👍
Share your thoughts !


LINKUSDT - REACCUMULATION PHASE FOR #LINK #LINKUSDT $52 TARGET!THE REACCUMULATION PHASE FOR LINK - ( Link Marines Assemblle)
4 Hour Chart Analysis
After Making New Highs, we can see think has had a nice pullback and is now being Reaccumulated.
Link is Currently in the LPS stages of reaccumulating After a Fake Breakout, and over extending back into the accumulation range.
After 40 days of being accumulated again, link is in its final stages of this phase.
It also retested the 0.618% Fib and over extended.
I have a target of $52 for this next push for link.
Stop Losses Below $28.50 the current swing low for anyone leveraging.

Link is on his last resistance! Waiting for confirmed breakout!Link is hot right now. There is a lot buzzing on twitter and telegram and a lot of buyers and holders are waiting for a pump.
Let's see how it goes. Overall the most people are watching at 50$ it seems. So that will be a price where i look to take profits.
Have a nice day :)

LINK/USDT : Breaking above bearish trendline BINANCE:LINKUSDT
Hello everyone 😃
LINK is breaking bearish trendline but it's not confirmed yet.
We expect a retest on support line at 30$ then we can see a continuation for LINK.
How ever Volatility is bullish now !
🔴 There is a possible chance for fake-out here ! Don't any position without confirmation..
Attention: this isn't financial advice we are just trying to help people on their own vision.
Have a good day!
@Helical_Trades

$LINK Cup & Handle FormationChainlink is printing a textbook cup & handle pattern, I expect a breakout from handle area soon.
Please like and follow if you found this idea helpful, thanks! 🤑
*** Not Finacial Advice! ***

Link looking for a key daily close!Currently we are sitting above our 0.3 FIB level and i'm watching for a daily close above it. We are looking very bullish In my opinion, the stoch rsi is looking great we flipped bullish and are coming out of oversold areas! RSI aswell coming up and im looking for a cross of the 50 mark indicating a uptrend! The market for the most part is following BTC and that is very key right now also. Not financial advice just my opinion

Link price action Not much to say bullish or bearish currently, but watching closely as BTC trends towards the upside again.

LINK big moves coming soonLink has been consolidating for some time now but has a habit of having huge breakouts even when the market is shaky, we are approaching the apex to our ascending wedge. Currently trading below our ascending channel after breaking through the 0.5 FIB level. the bollinger bands are really coming together and squeezing the candles hinting at a big move in the near future. I think tomorrow we could see a little more downside but i believe we are going to bounce off the bottom of our ascending wedge also the 0.3 FIB and come back up into the ascending channel. I say this also because the Stoch RSI is getting close to the oversold zone. I see us after that then going to break the top of the wedge and continue on the path of our channel. NFA just my opinion, also keep in mind BTC is a big factor for everything right now.

LINK further bull actionIchimoku indicators further bullish moves
Inverse H&S is also present
I entered last night into a position in LINK

LINK/USDT - potential 35% setupHello, Traders!
After entering a bullish trend and the subsequent correction, LINK continues to consolidate in the trading range of $25.46 - $30.10
Buy entry can be sought in the $27.00 - $28.26 range
Stop-loss can be placed under $24.60
Correctional Fibonacci levels would be the following:
$30,78
$33,54
$37,05
Watch out for the market and good luck!
P.S. This is an educational material that cannot be considered as a financial advice

LINKUSDT Next Target?LINKUSDT (1H CHART) Technical Analysis Update
Flag pttern
LINK/USDT currently trading at $29.36
Buy-level: Only buy after flag pattern breakout ( Above $29.75 )
Stop loss: below $28.00
Target 1: $30.90
Target 2: $32.00
Target 3: $35.00
Max Leverage: 2X
ALWAYS KEEP STOP LOSS...
Follow Our Tradingview Account for More Technical Analysis Updates, | Like, Share and Comment Your thoughts.

looking for Chainlink to push back up to the 31$ resistanceBullish overall on link, little dip today after rejecting off resistance at 31$(usd) as I said in my last TA for Link we may see a rejection but i believe we would see another couple tries and ultimately a break of the 31$ resistance. we are still getting support from Ichimoku cloud and EMA ribbons! Stoch RSI is coming down from overbought back into neutral zone, i expect this dip to get bought back up and for us to return to the 31$ resistance and hopefully breakthrough!
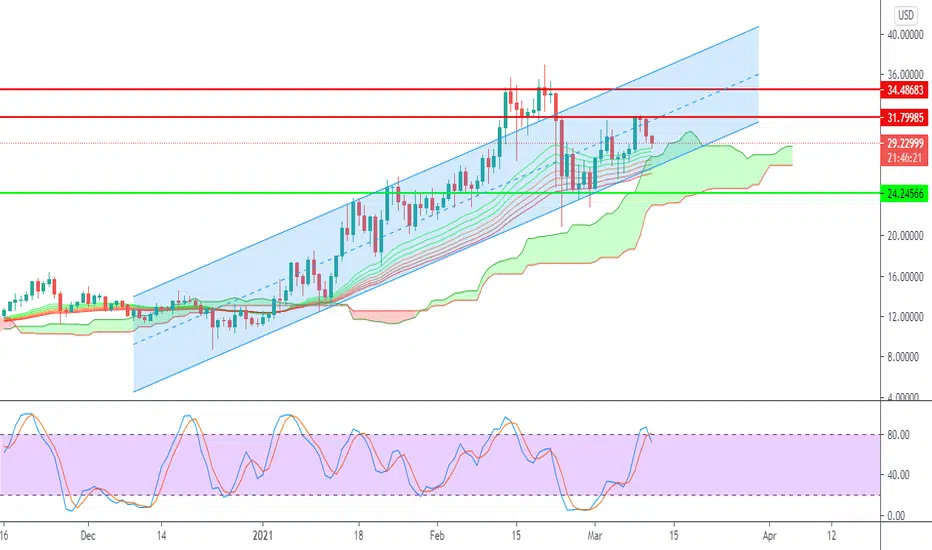

Link pushing to break resistanceLink is on the push to break overhead resistance level, i think we will if not the first try maybe 2nd or 3rd consecutive try. We got the EMA ribbons pointing up with bullish momentum and ichimoku cloud ahead is big support and the Stoch RSI still has a little to go before being Over Bought, also we are trading above our middle line in the ascending channel as of right now. We will need to flip both overhead resistance levels to support to reach our ATH levels and beyond

Link ascending channelWe have been moving slightly up and down but mostly sideways with lots of accumulation going on, looks like Link is charging up for that next leg up. Ichimoku cloud printing support going upwards and Stoch Rsi was recently in oversold areas, we want to see link continue to follow our ascending channel which would eventually bring us upto ATH levels where we would need to break through to continue going up. We will want to watch out for a break down out of the ascending channel, if that happens i believe we would fall to our closest support (marked in green) NFA just my personal opinion!!

LINK Bullish View - ContinuationThis recent wick extension has made LINK look appealing to me (within rectangle)
This rising Megaphone will likely continue, ( orange line of resistance will stay intact)
Continuation will result; bullish
A smart man once told me "don't invest in projects you don't understand"
Hence I am going to sit out of this opportunity
TA regardless looks bullish


LINK Head N Shoulders?Two periods of tight accumulation can be seen within the rising (expanding) broadening wedge, followed by a move upwards.
At a glance you cant really see the H&S, but on an angle it is evident
Following this possible move down, an entry would be amazing. I possible will enter myself.
We will see how it plays out.
USD pair


