LINKUSD ❕ between zonesA bullish divergence was formed on the 4H Timeframe.
Price has broken through 200EMA (30m TF)
Chainlink continues to trade between two strong levels.
I expect the current news background to continue to flow in favor of DeFi projects, so once it fixes above the support level, I expect the asset to rise.
LINKUSD

CHAINLINK (LINK)Do we have a double bottom on here? Or are we going to head lower. From the chart I think we still need more time to see if this is the bottom or we have another wave lower in 5.

LINK: recovery will be slowDuring the previous period, LINK was gaining back investors' confidence and was strongly moving to the upside, managing to reach a $9.0 long term resistance line. However, any sort of higher optimism now must be postponed for a week or two, as the general crypto market is in a state of shock after FTX collapsed. In line with general market sentiment, LINK reverted to the downside during the previous week, reaching minimum level at $6.0 support line. On one occasion the price reached $5.85, however, it was not a significant move for LINK. The price then reverted a bit to the $7.0 resistance line, but still, the coin is finishing the week with more selling orders, around level of $6.2.
During the week RSI reached level of 37. It is still above the oversold market line, leaving some space for the price to go lower, in order for a clear oversold side to be reached. Moving averages of 50 and 200 days continue slowly to converge toward each other, indicating high potential for a golden cross to occur in the near future.
Markets will need a week or two to digest current negative developments. In this sense, it is possible for the price of all coins on the market to move with higher volatility. For LINK there is probability for the $6.0 support line to be tested in the coming days. There is also an equal probability for the $7.0 resistance line to be tested also.

50%+ gains incoming for Chainlink According to chart patterns only. Do your own research . Chanlink seems to be looking to push above previous $9 area. With a temporary retracement to $8 before topping off at/or around $10.90, where there still seems to be minor resistance. Expect a deep pullback at this point.

Link update Link now in clear down trend , after breaking the descending triangle , i believe its going to 2$ area .
70% down from the top of triangle .
GOOD LUCK

LINKUSD ❕ under the POCThe rebound happened on declining trading volumes.
The price continues to be under liquidity.
On the 1H Timeframe, the asset is overbought on the BB indicator and is testing 50EMA as resistance.
I expect a fall after fixing under the resistance level.

20% for LINK possibleSimilar setup like LIT before jumped up. Quite strong PA. I like it. Red MA as a next target - this can give us 20% profit. But be careful if FED ruin the party with the news of increasing interest rates today - this can shake with markets. GL
MANAGE YOUR RISK,
NOT A FINANCIAL ADVICE

LINKUSD 2D: 40%+ CORRECTION WARNING(SL/TP)(NEW)Why get subbed to me on Tradingview?
-TOP author on TradingView
-2000+ ideas published
-15+ years experience in markets
-Professional chart break downs
-Supply/Demand Zones
-TD9 counts / combo review
-Key S/R levels
-No junk on my charts
-Frequent updates
-Covering FX/crypto/US stocks
-before/after analysis
-24/7 uptime so constant updates
🎁Please hit the like button and
🎁Leave a comment to support our team!
LINKUSD 2D: 40%+ CORRECTION WARNING(SL/TP)(NEW)
IMPORTANT NOTE: speculative setup. do your own
due dill. use STOP LOSS. don't overleverage.
🔸 Summary and potential trade setup
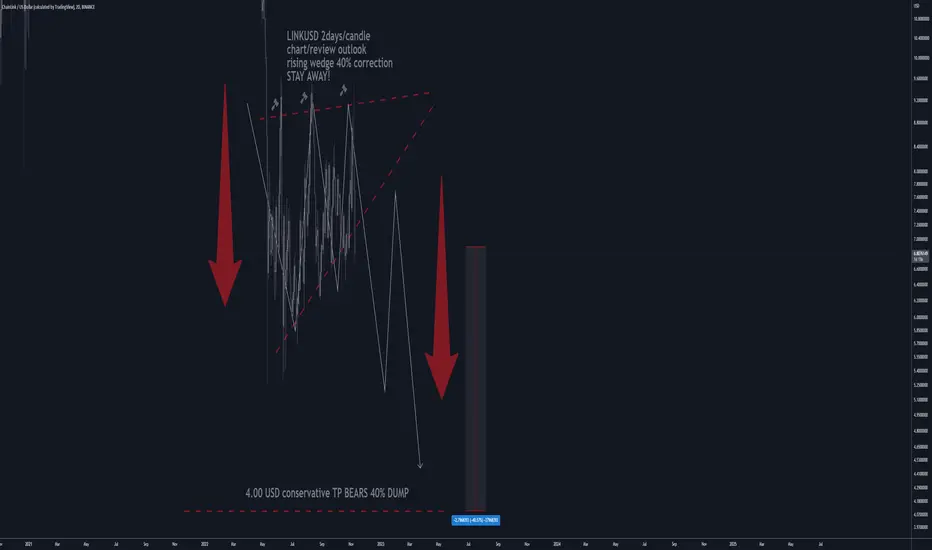
::: LINKUSD 2days/candle chart review
::: 40% CORRECTION WARNING
::: updated/revised outlook
::: distribution in range / weak chart
::: limited upside / expect dump from HIGHS
::: weakness will last for 4-8 weeks
::: LOG SCALE chart
::: not a great looking chart
::: RISING WEDGE BEARS taking over
::: FTX/FTT bankruptcy will pull crypto down
::: CLEAN REJECTION AT recent highs
::: S/R was re-tested produced WEAK bounces
::: final BOUNCE possible now before DUMP
::: also noteworthy sequence of lower highs
::: recommended strat: MARKET SHORT IT
::: final TP BEARS is 4.00/4.20 usd
::: 40-45% correction possible next
::: 4-8 weeks in November/December 2022
::: right now no upside in this market
::: position traders should wait for
::: better entry prices later after
::: no upside in this market it's game over
::: recommended strategy: SHORT SELL AT MARKET
::: TP BEARS is +40% gains - near 4.00 USD
::: BULLS stay out until correction is over
::: SWING TRADE: SHORT/HOLD IT
::: correction run not over yet
::: good luck traders!
::: BUY and get paid. period.
🔸 Supply/Demand Zones
::: N/A
::: N/A
🔸 Other noteworthy technicals/fundies
::: TD9 /Combo update: N/A
::: Sentiment mid-term: BEARS/CORRECTION/40%
::: Sentiment short-term: DUMP/GAMEOVER
RISK DISCLAIMER:
Trading Crypto, Futures , Forex, CFDs and Stocks involves a risk of loss.
Please consider carefully if such trading is appropriate for you.
Past performance is not indicative of future results.
Always limit your leverage and use tight stop loss.
Chainlink: Partial Decline Supply Line Breakout Update #2This is an Update to this currenly still active previous setup from several weeks ago:
As of rigth now LINK has Confirmed it's Pivot from the 0.618 and has now broken through a serious Supply Line; If it continues up to $9.51 we will have confirmed a Partial Decline which at that point should lead to a Breakout of the Range that could take it to the next Resistance at $27.80

ChainLink - Looking StrongI like this chart of LINK to be honest, nice ranging for some time of consolidation - looks primed for a decent move up.
Breaking the mid-range now to the upside - want this to hold.
Nothing to get too crazy excited about yet, but breaking above this macro (larger) range would be huge, that is what I'm anticipating.
I've watched this same chart for some time and it is respecting levels nicely, grinding up and holding demand.
LINK Marines may just push this one higher.
V

$LINK with the Break-Out! - 12$ TARGET?$LINK
BREAK OF STRUCTURE?
Big Break of Red Trendlines.
Invalidation:
Green Support line break.
Bullish Right Now.
Link could be one of the big ones for the next bull-run with more than 1500+ Projects using their service.
#Link #CryptoTrading

Chainlink (LINK) - November 5Hello?
Welcome, traders.
By "following", you can always get new information quickly.
Please also click "Boost".
Have a good day.
-------------------------------------
(LINKUSDT 1W Chart)
Whether the price can rise above 11.064 and sustain is the key.
(1D chart)
If the price is maintained by rising above the 8.290-8.822 section, it is expected to rise above 9.869.
However, the key is whether it can move above 11.064, which is an important support and resistance point, so you need to think about how to respond.
The reason is that the trend-determining interval is formed over the 11.976-15.374 interval.
If it goes down, you should check to see if it finds support in the 6.7-7.411 zone.
If it doesn't, it is likely to drop to around 4.976.
------------------------------------------------------------ -------------------------------------------
** All descriptions are for reference only and do not guarantee a profit or loss in investment.
** If you share this chart, you can use the indicators normally.
** The MRHAB-T indicator contains indicators that indicate support and resistance points.
** HA SRRC indicators are expressed as StochRSI(line), RSI(columns), CCI(bgcolor).
** CCI indicator is expressed as overbought range (CCI > +100) and oversold range (CCI < -100).
(Short-term Stop Loss can be said to be a point where profit and loss can be preserved or additional entry can be made through split trading. It is a short-term investment perspective.)
---------------------------------

LINK may be breaking up from triangle; nearing daily goldencrossLooking at the weekly chart here to get a better view of this pink triangle’s trendlines. We can’t see on this chart how close the daily charts golden cross is from happening but it appears to be less than a few daily candle closes away from occurring. If this symmetrical triangle confirms its bullish breakout the target is around $11.32- $11.47. Reaching this target would bring price action up out of a much larger triangle that its been in for far longer that has a much larger breakout target to go with it, however we can see the stoch rsi on the weekly chart has ventures into the overbought zone so it increases the odds that when price action first retests this yellow trendline on the way to the target it will encounter it as resistance, same with the descending white trendline as well. The stochrsi is also overextended on the 1 day chart too increasing the probability that price action will encounter resistance along the way to the breakout target that may result in some level of correction. Still always possible it finds a way to break through both of these resistance lines with ease just a lower probability with stoch rsi already in the overextended zone. If it can sustain the breakout and reach its full breakout target then I believe it will sustain the daily chart golden cross and in time trigger the breakout from the much larger triangle pattern as well. *not financial advice*

LINK/USD - Watch it burn and rise from the ashes- Last idea was spot on (Short at 27).
- Last idea was entirely based on the cycle being over.
- Current cycle is bearish
- Hope for $5ish to accumulate as much as I can.
- Watch LINK rise to become a 100B asset and top 5 mainstay by 2024.
My ideas do whatever you want to do.
✌️

LINKUSDT - ProbablyAn idea.
Link fundamentals are strong. Once the CCIP is released, these targets are easily achivable
Not financial advise!

LINK: Is $8 the next target?Although the previous week was a positive one for the crypto market, still the moves made could be perceived as incremental. LINK was also following that general market sentiment and managed to cross the resistance line at $7, by reaching its highest weekly level at $7,6. Next resistance line at $8 has not been tested on this occasion.
RSI was pushed from level of 45 up to 57, which indicates that the market had turned its eye toward the overbought side. Moving average of 200 days is modestly approaching toward its MA50 counterpart, but the golden cross is still far away.
Current charts are suggesting an increased probability that the $8.0 resistance line might be tested in the coming days. At this moment there is no indication that this resistance line could be breached to the upside. On the opposite side, there is some probability for the $7.0 support line to be tested for one more time in the week ahead.

LINKUSDT ANALYSIS , 1 DAYYou can see the currency analysis of the link
We are in a symmetric triangle and the volume is decreasing
and the fundamental news also promises us that the price will break down due to the interest rate that is going to be announced by the Federal Reserve.

LINK AnalysisHello Dear, as we can see in the chart, Link kind of broke the daily down trend line but it's not moving toward upper resistance yet.
instead formed another dynamic downtrend in which is clearly visible in 4h timeframe.
If it breaks that up and give us confirmation, we can go long. otherwise we are short now.


LINKUSD ❕ reached a lower boundary of channelTrading volumes show interest in price growth.
The 1H Timeframe shows that on the RSI chart the buyers are taking the initiative.
Price has broken up 50EMA (30m TF)
I think the LINK may rise if it holds above resistance.

Chainlink (LINK) - October 19Hello?
Welcome, traders.
By "following", you can always get new information quickly.
Please also click "Boost".
Have a good day.
-------------------------------------
(LINKUSDT 1W Chart)
The key is whether you can climb to the 11.976-15.374 section.
To do this, it is necessary to check whether it can be supported near 6.7.
(1D chart)
Resistance: 8.290-8.822
Support: 6.7-7.411
The key is whether it can find support at 6.7-7.411 and move above 7.605.
To do that, we need to make sure we are breaking out of the downtrend line.
Otherwise, it is expected to drop to around 4.976.
------------------------------------------------------------ -------------------------------------------
** All descriptions are for reference only and do not guarantee a profit or loss in investment.
** If you share this chart, you can use the indicators normally.
** The MRHAB-T indicator contains indicators that indicate support and resistance points.
** SR_R_C indicators are displayed as StochRSI(line), RSI(columns), CCI(bgcolor).
** CCI indicator is expressed as overbought range (CCI > +100) and oversold range (CCI < -100).
(Short-term Stop Loss can be said to be a point where profit and loss can be preserved or additional entry can be made through split trading. It is a short-term investment perspective.)
---------------------------------

LINK - Buying SignalBYBIT:LINKUSDT
1D time frame
-
LINK forms an ascending triangle here, the resistance zone is around 9.2, and an uptrend supports price continuously.
Now the price retests uptrend again, so we can open long here.
-
Entry: 6.93
Add: 6.82
TP: 7.7
SL: 6.5

LINK/USDT :: Under $8 .LINK/USDT :::
The price is in the lower part of the middle line and will slowly move towards the middle line and then towards the ceiling of the channel. Long position is a good choice .
