LINKAccording to the bullish divergence on daily time frame looks like LINK can go 50% upside atleast
LINKUSD

LINK chart close to whales...in link chart you see some zones which is very important for link to hold...
if you want to take any position in link then must to see my chart this zone is very help full for you...
the most important zone is 13.500 to 14.700 must hold... if market not hold this area then we are going down toward 7.700 to 8.700.....
if you want to buy link then buy in sport because future trading is very risky if you mange your risk management then you can do trade in future...
NOTE : I'm not a financial adviser...do you own research....

Double bottom LINK incoming? With all the bad news around the corner and BTC still looking for another leg down I see LINK is maybe going for a double bottom around the $13,- range.
I have my orders set! Lets see guys.
Good luck trading!
Kind regards
Cryptodjens

ChainLink (LINK) Buy ZoneChainLink (LINK) Buy Zone
--------------------
BIAS
Mid-Term : Bullish
Long-Term : Bullish
Risk : Medium
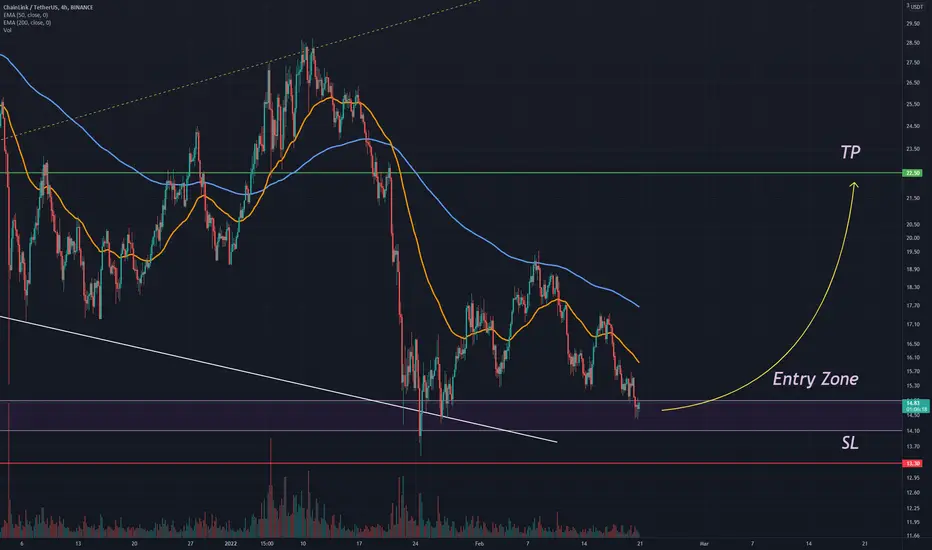
Overall Market Structure for ChainLink remains mid-term bullish and long-term bullish, and currently rejecting from the long-term support.
--------------------
$LINK/USDT LONG SETUP
Leverage : x3 - x5
Entry Price : 14.1 - 14.9
TP 1 : 15.3
TP 2 : 15.8
TP 3 : 16.55
TP 4 : 17.5
TP 5 : 18.6
TP 6 : 19.4
TP 7 : 20.7
TP 8 : 22.5
Stop Loss : 13.3
*Maximum 3% of Portfolio.
*Unload 12.5% at each TP. Whenever TP 2 hits, Move stop loss to entry.
--------------------
LINK (ChainLink) Weekly Trade Follow Up. BINANCE:LINKBTC has lost the gains it has made on the first half of January. We are now retesting the 4-year long trendline that has held as strong support after reversing off of the 0.236 Fib line above. We did anticipate such a move in preparation for higher highs. However, we haven't yet gotten confirmation that LINK will not break below the strong support. The current weekly candle is only one day old. Zooming in to the daily, we don't see signs of reversal either. It is crucial to see a bullish pin bar (hammer candle) before setting up for re-entry. The stop loss will be just below the 3600 Satoshi support line. Breaking that line signals that LINK is too weak to surpass the recent high of 0.236 Fib.
Current market volatility makes this trade risker than usual. Therefore, lower capital should be allocated on it. The reason is that I would not be surprised if during this week, price breaks below 3600 Satoshi and rebounds back to 4500 Satoshi above the rising trendline.
Summary:
If you're not holding a position in LINK, then wait for reversal signal.
If you are holding a position, then set a generous stop loss below 3600 Satoshi and reduce your position such that the loss is manageable. You can always re-enter this trade after we see reversal. Remember that our target is at 16k Satoshi in May or July. It's better to enter with more confidence even if you waste the perfect entry.
Good luck

Chain where are you gonna Link to - Possibility 1 or 2Chain where are you gonna Link to - Possibility 1 or 2?
With Bull Divergence on 4H,
Which is more Probable?
NAF DYOR

LINK/USDhey Guys
check this chart
link explode is near...
link is dumped 74% so it need to explode, indicators telling this
(targets on the chart)
just buying spot and waiting about 1 or 2 month for min. 120%
also i will take future position with long
low leverage and should take cross...
don't miss like my last trade - avax/usd
wish u luck

Play with technicalForm a triangle with precise collisions. I think it can be a good growth. Support for bitcoin also strengthens this possibility
What do you think, can this analysis become a reality?

LINKUSD 15 minute 2/16/22 - Waiting for the Old GuardIt is probably the most fascinating moment in my experience of economical history. very telling of our worlds Governments. Are they for us or against us. Canada once a place deemed "more free" than USA, is now trying to figure out how to control its people by limiting their money. The forced a project of fundraising to return money as opposed to supporting people who do not want vaccine. our government pulled XRP and at least for me, stole my money and potential to make money. I Have no idea what they did with my XRP. Im sure others who refused to sell also just had their account wiped. Weird. Especially when you look at Governments and their players making deals with banks. if they accept change and pivot they must see how developments like chainlink can add to oversight and offer trust for the people. The fact that we elect someone does not mean that someone has the ability of self control. A smart contract offers Mutual trust. Preset terms. and a better democracy. In my opinion this is the carrot. Democracy has not been achieved and the people in control see it rising and are afraid of the unknown. This is why they add to the unknown with confusion and distrust. We are all so fortunate to witness this point in history. Where our ancestors were used by power we may finally get the chance to wield the power and dilute its extremes to a balance.

REJECTEDLINK has been rejected by 1.5 years of strong resistance line. Next is to observe if the 50W EMA will act as a support. But the obvious thing is: Nothing can go down forever. The time will come for the Link.

LINKUSDT CAHINLINK wait for breakoutlinkusdt price will be decided on what side it is going to break. break on up side will take its price 20 and then to 28 so wait for breakout for now

$LINK Chainlink 1D lines to watchupdate since 20s post
pink and blue lines ww
EMAs could be fun scalping on ltfs

Chainlink (LINK) Analysis | Weekly TimeframeChainlink (LINKUSD) is also one of the TOP/major altcoins within the market by capitalization and it doesn't look like it is going to go up.
There can be a bounce right away at support... Hold on, let's start from the beginning.
We are looking at the weekly timeframe/long-term chart for Chainlink vs the Dollar.
Prices are trading below EMA100/50/10.
A new high was hit back in May 2021 followed by lower highs.
The MACD is strongly bearish below zero and also below support.
Last weeks candle closed bearish after a rejection at EMA100.
This can lead to a test of the next important support level at around $12.38.
This is the Fib. retracement level 0.786 of the full bullish wave from March 2020 until May 2021.
If this level holds as prices drop, we can see a bounce (blue arrow).
After this bounce we can examine the chart again.
If the Fib. retracement level does not hold, we will see a strong crash... Maybe we will just see a long wick down and then prices start to grow, who knows...
But this is also part of the big ones, it is looking bearish like all the other ones.
Either something changes or we are getting closer and closer to the final flush.
The markets can always change.
I hope you are enjoying the content but keep in mind that I am only reading the chart.
Namaste.

Chainlink LINKUSD - 24 hour chart patternsChainlink is being reported as at the bottom of its safe zone. I have a little bit lower but its already below it's strength line. I do like Link. i have made a great amount off of it's huge wave lengths. It like the rest of the market seems to be sitting on the edge and the fed meeting tomorrow seems to be the resistance right now. Interesting.

ChainLink - Perfect Bounce!In our previous analysis we mentioned that we were looking for a reversal at the $14 level where we had the completion of the ABC correction.
Price came down to test that level perfectly and bounced! Sometimes when there's a trend reversal, there's a particular price action that takes place such as double bottoms, reversal wedges etc. We may see a double bottom from ChainLink before moving higher - so if you haven't got in already, this may be your chance!
Trade Idea:
- Watch for price to come back to the $14 level
- Enter once double bottom appears
- Stops below the bounce
- Target the recent highs as first target and HODL the rest as we may see the next big bull run
See our post on reversal patterns below:
Goodluck!

Breakout + or - for Chainlink Here's a simple idea on chainlinks Breakout ( red circle ) keep an eye on support and resistance marked in this graph. If it drops it could go to $10.

$LINK in medium termThis is my points of view about the medium term for $LINK
We need to consider about
1/ the breakout zone to get over the downtrend (21)
2/ the resistance zone to confirm the uptrend (26-28)
3/ Very strong support if the accumulation is still going on (12-13)
NFA

Chainlink (LINK) - February 9Hello?
Traders, welcome.
If you "follow", you can always get new information quickly.
Please also click "Like".
Have a nice day.
-------------------------------------
(LINKUSD 1W Chart)
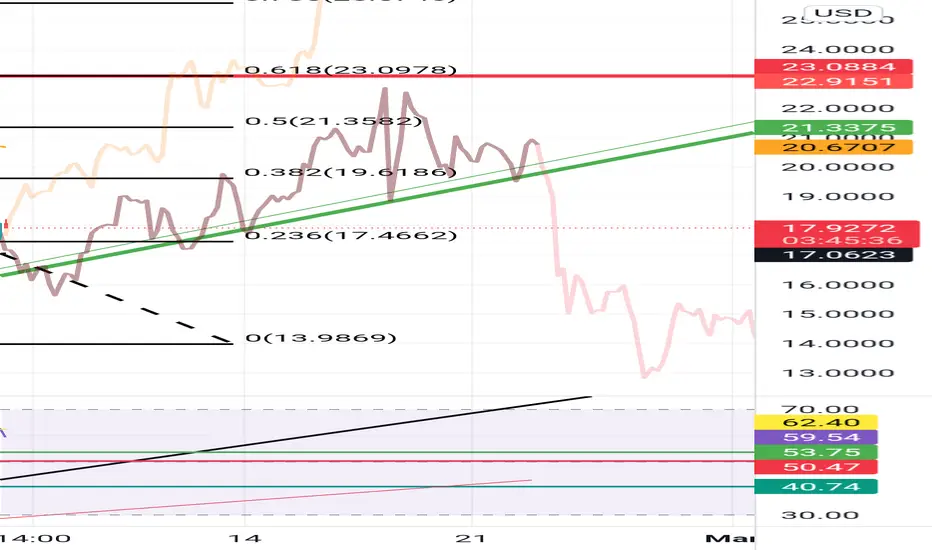
Above the 9.8711250 point: the uptrend expected to continue.
Above 14.9592563 point: Expected to create a new wave.
It needs to rise at least 20.7294 159 points to turn into an uptrend.
However, in order to continue the uptrend, it must break out of the downtrend line.
In the CCI-RC indicator, it is expected that the upward trend will accelerate when the CCI line rises above the +100 point and above the EMA line.
-------------------------------------
(LINKBTC 1W Chart)
Above 0.0002 195-0.0002 757 section: expected to continue upward trend
0.0003 Above 950 points: Expected to create a new wave.
It must rise above the 0.0004 674 point to turn into an uptrend.
------------------------------------------
We recommend that you trade with your average unit price.
This is because, if the price is below your average unit price, whether the price trend is in an upward trend or a downward trend, there is a high possibility that you will not be able to get a big profit due to the psychological burden.
The center of all trading starts with the average unit price at which you start trading.
If you ignore this, you may be trading in the wrong direction.
Therefore, it is important to find a way to lower the average unit price and adjust the proportion of the investment, ultimately allowing the funds corresponding to the profits to be able to regenerate themselves.
------------------------------------------------------------ -----------------------------------------------------
** All indicators are lagging indicators.
Therefore, it is important to be aware that the indicator moves accordingly with the movement of price and volume.
However, for the sake of convenience, we are talking in reverse for the interpretation of the indicator.
** The MRHAB-O and MRHAB-B indicators used in the chart are indicators of our channel that have not been released yet.
(Since it was not disclosed, you can use this chart without any restrictions by sharing this chart and copying and pasting the indicators.)
** The wRSI_SR indicator is an indicator created by adding settings and options to the existing Stochastic RSI indicator.
Therefore, the interpretation is the same as the traditional Stochastic RSI indicator. (K, D line -> R, S line)
** The OBV indicator was re-created by applying a formula to the DepthHouse Trading indicator, an indicator disclosed by oh92. (Thanks for this.)
** Support or resistance is based on the closing price of the 1D chart.
** All descriptions are for reference only and do not guarantee a profit or loss in investment.
(Short-term Stop Loss can be said to be a point where profit and loss can be preserved or additional entry can be made through split trading. It is a short-term investment perspective.)
---------------------------------

Link is Bullish and ready to see previous heights There is quite a bit of resistance between $23-32 area. After breaking this resistance box we will see higher levels. My first TP will be around $42,-
Feel free to comment on my chart while I am still learning.
Kind regards,
Cryptodjens

AN IMPORTANT GOAL OF $23 INCOMING FOR CHAINLINK Currently sitting at the very bottom of an under-sold status on the,monthly RSI chart. Chainlink is getting ready to peak out above the negative trendline. Looking back at the daily chart, we may have found our support for further momentum upward at or near $17. This is showing our next hurdle on the 4 hr chart is going to be $22-$23 for link to assume new support at this level. I honestly see Chainlink moving further upward and this may be the last time we will see its $14-$16 price tag. Good luck and happy trading

LINK : UPDATEDLINK the most loved coin.
when I observed others analysis I was wondering why theirs still on track
LINK was one of my analysis error below ...
.
usually my mistakes are
1. Wrong angle projection
2. Emotion during trade that leads to hesitation
(effected to status update--- that turn the correct plan to fail)
.
So here's the updated one and hope it's helpful for u.
Thx, Trade safe n fun,
don't forget to place the stop lost at ur acceptable risk.
.
.
SET INDEX and some random additional analysis please follow ---> @GloomyBoar

API3 Fractal Hinting a Breakout!Hello Traders!
As you can see on the Weekly Candles of API3, the number of impulses and levels compared to early Chainlink price action looks similar! API3 additionally is a Decentralized Blockchain API like Chainlink. I think there is a great chance this fractal plays out and that we moon.
-Pulkanator

Chainlinks future performance This will chart chainlinks performance on a 4 hour chart
The orange line represents the highs 200 days ago today and the black line represents the highs 100 days ago today.
I placed them along the current highs as of 1500 hours today. This is just done out of morbid curiosity.