#LINK/USDT targeting 17.77 $ ?#LINK
The price is moving within a descending channel on the 1-hour frame and is expected to break and continue upward.
We have a trend to stabilize above the 100 moving average once again.
We have a downtrend on the RSI indicator that supports the upward break.
We have a support area at the lower boundary of the channel at 15.60, acting as strong support from which the price can rebound.
We have a major support area in green that pushed the price higher at 15.30.
Entry price: 15.84
First target: 16.47
Second target: 17.00
Third target: 17.77
To manage risk, don't forget stop loss and capital management.
When you reach the first target, save some profits and then change the stop order to an entry order.
For inquiries, please comment.
Thank you.
Linkusdsignals

LINK - The sleeping Giant ready to wake!Don't forget to add LINK to your watchlist — it's a solid project with long-term investment potential.
The weekly chart shows that LINK is currently retesting the downtrend line it recently broke — a textbook bullish retest.
The lower trendline now acts as a key support level, and as long as price holds above it, the structure remains healthy.
Currently trading around $17.6, the price hasn’t moved significantly yet —
You’ve got:
✅ A strong fundamental project
✅ A bullish technical setup
✅ Large market cap
✅ Still early entry
What more do you need to enter?
Accumulate now... and thank me later.
Best Regards:
Ceciliones🎯

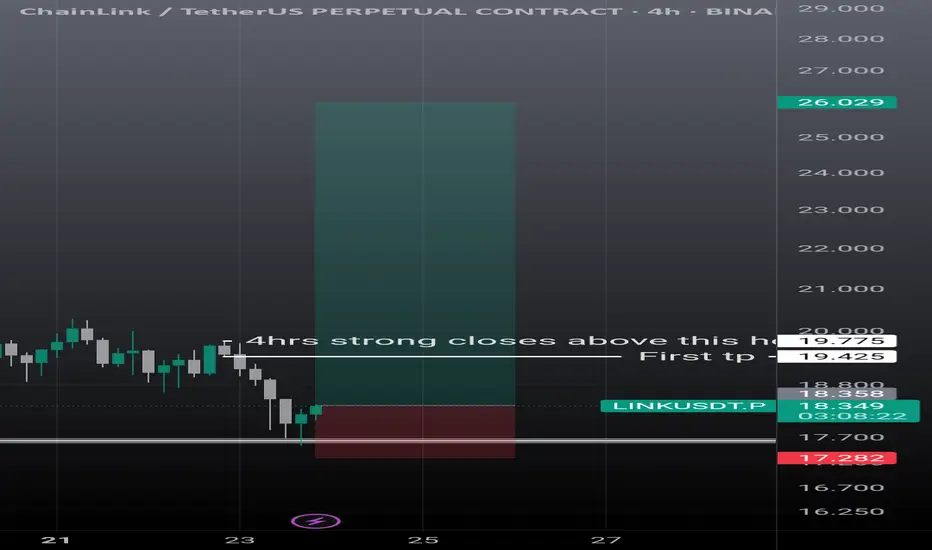
Linkusdt scalp n swing setupLink showing some strong momentum. On 4hrs it can go easily 19.30, then if it breaks strong and closes above the mentioned candle it's next stop is 26$. Must use sl as it can take further correction is it failed to break the mentioned level.
Chainlink (LINK) Trapped Between $18–$20: Explosion Soon?Chainlink (LINK) has been in a strong uptrend for most of July, rallying from under $13 to a recent high of $20.28. This level acted as a clear resistance where a "Sell" signal has been triggered, suggesting a temporary exhaustion of bullish momentum. After this peak, price has pulled back slightly and is now trading near $19.08, hovering between key levels — with $20.28 acting as resistance and $17.98 as nearby support. This positioning confirms that LINK is currently rangebound and consolidating.
Structurally, the price made a series of higher highs and higher lows, with a steep bullish leg between July 14 and July 21. However, recent candles show signs of hesitation. There's less conviction in the current move, indicating that traders are likely waiting for either a breakout above resistance or a breakdown below support to commit to the next move.
The range between $17.98 and $20.28 is now the battlefield. A clean break above $20.28 would signal bullish continuation, with the next logical upside target being around $22 or higher. But if price fails to hold $17.98, it may retrace deeper — first toward $15.66 (the breakout base), and then possibly down to $14.08 or $13.39 where previous accumulation occurred.
Volume appears to have faded slightly during the recent leg up, which adds weight to the idea that LINK needs a consolidation phase before resuming any meaningful trend. There's also a previous "Buy" signal near $15.66 that aligns with the last breakout zone, making this a key level to watch if bears regain short-term control.
Right now, it's a no-trade zone unless the market shows clear direction. Traders with a neutral stance should wait for confirmation — either a strong breakout above $20.28 with a decisive candle and follow-through, or a breakdown below $17.98 which opens up downside opportunity. Until then, LINK is best treated as being in a mid-cycle pause, building up energy for its next major move.

The Oracle Singularity: CHAINLINK is Inevitable or Cooked?How many marines are tracking this ascending channel?
How many are watching this Fibonacci time sequence unfold?
How many are following the mirrored bar fractal that might just be a crystal ball into the future?
Today you get all three in one TA. The value here is absurdly high . Even though I offloaded most of my LINK a while back it continues to act like a compass for future macro crypto moves.
You really need to look at the TA to understand what I mean
Now look at this
The deviation in the LINK bar pattern seems to be reaching its conclusion around mid October 2025 and if you’ve seen my last Bitcoin TA you know I’ve been targeting that same mid October 2025 window for a potential BTC top. That’s a serious timeline confluence.
But here's the twist
The main chart projects a $200 LINK by April 2026. If that plays out then I have to entertain the possibility that this cycle extends past my original thesis and that my Bitcoin top call may come in earlier than Chainlink's final move.
If Bitcoin does in fact top in mid October then LINK likely won’t have the legs to hit those upper targets.
Back in 2021 when LINK was trading at a similar price it only took 119 days to reach $50 that would put us at November 2025 for a repeat. Something doesn’t quite add up
Now check the main chart again
This Fibonacci time sequence is liquid gold. It’s nailed major tops and bottoms for years (see the blue circles). Every major move has hit right on time except for the 3.618 in October 2022 which was a rare miss.
But here's the kicker
There’s no Fib time event between October and December 2025. The next ones are in August 2025 and then April 2026
So is LINK trying to tell us the cycle extends into 2026?
Maybe. All I’ll say is this
If the cycle doesn’t extend into 2026 then LINK IS COOKED

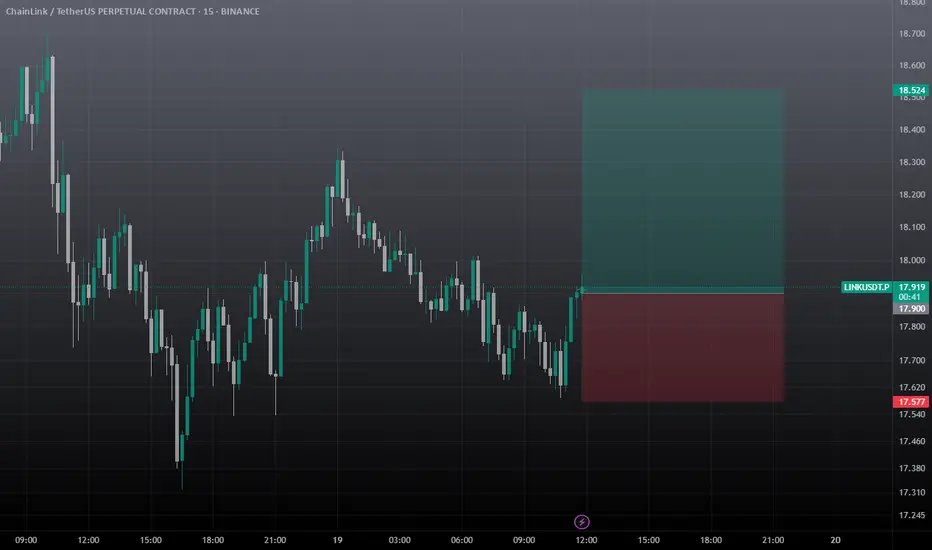
Link Scalp Trade IDEA / Long Scalp Setuplink looking to take out 18.5 area. can take at cmp 17.91, must use sl, it's a scalp trade so don't hold it for long time.
LINKUSDTThis is chart ready for pump but wait for break 14$. BINANCE:LINKUSDT
I in below say best supports and resistance's.
Support:
12.66
11.50
10.50
resistance's:
14
16.68
17.70
⚠️Contorl Risk management for trades.

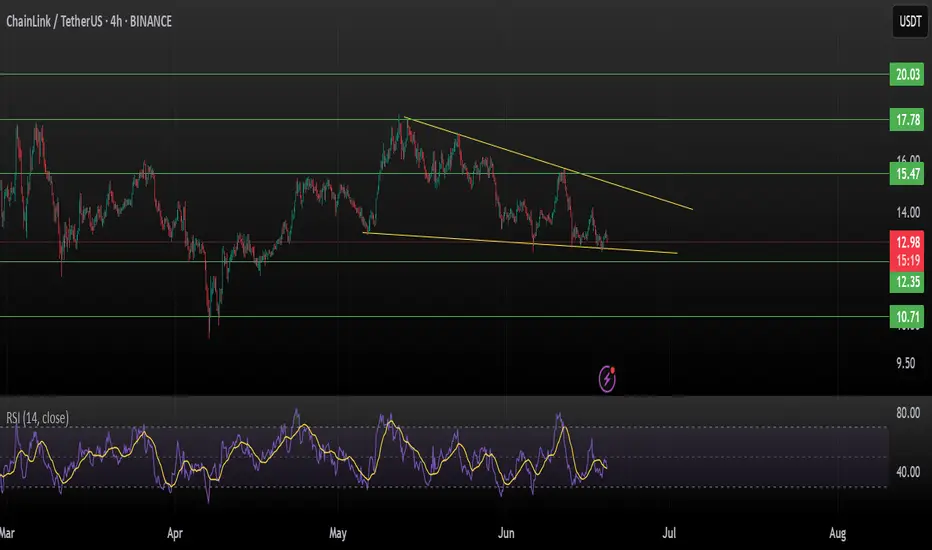
Chainlink (LINKUSDT) | Falling Wedge at Critical SupportChainlink is trading within a well-defined falling wedge pattern on the 4H chart, a typically bullish reversal setup. Price action indicates the coin is hovering just above key horizontal support around $12.35, making this a critical zone to watch.
Technical Breakdown:
Pattern: Falling Wedge (Bullish Bias)
Current Price: $12.98
Immediate Support: $12.35
Major Support: $10.71
Resistance 1: $13.80 (wedge upper trendline)
Breakout Targets:
$17.78 (major resistance)
$20.03 (macro level supply zone)
Indicators:
RSI (14) at ~42 → Weak but stabilizing, potential for reversal
Volume has been compressing — watch for a breakout with rising volume for confirmation
Strategy:
A 4H close above the wedge trendline with volume could trigger a breakout rally toward $17.78 or even $20.03.
Failure to hold $12.35 could send LINK back toward $10.71 support, caution below this level.
Setup Summary:
Long entry on breakout above $13.50 (trendline)
Stop-loss: Below $12.35
Target 1: $17.78
Target 2: $20.03
Risk: Reward Ratio: ~1:3+
Not financial advice. DYOR before entering trades.
If this analysis helps, like & comment your view.
LINKUSDT 1D AnalysisLINK ~ 1D Analysis
#LINK Buy in stages from here with a short term target of at least 10%+ and a long term target of $31

ChainLink (LINK) Bulls Eye $18 as Supertrend Flips Green📈 Market Structure & Trend Overview
• Price is holding a clear ascending trendline, acting as dynamic support.
• The recent bounce from Support 1 at $14.93 indicates that bulls are defending this level aggressively.
• Price is now approaching the mid-zone between support and resistance with bullish momentum resuming.
🧠 Supertrend Indicator Analysis
• The Supertrend is flipping bullish, or recently has, placing the green band below the current price, which confirms the initiation of a buy signal.
• The last bearish wave was rejected near Support 1, and since the Supertrend held as support, it further validates a long bias.
• Supertrend aligning with the trendline and support level adds multi-layered confirmation to this setup.
✅ Trade Setup (Long)
• Entry: $15.96 (current market price at time of analysis)
• Stop Loss: $14.80 (just below Support 1 and trendline structure)
• Take Profit: $18.00 (previous swing high and resistance zone)
• Risk-to-Reward Ratio (RRR): ~1:1.54
• Time Horizon: 2 to 7 days for target to be achieved
📌 Key Technical Highlights
• Support 1 ($14.93): Tested and held multiple times, confirmed by Supertrend flip.
• Support 2 ($13.24): Deeper fallback zone; breach would invalidate bullish bias.
• Resistance ($18.00): Swing high and Fibonacci alignment, making it a strong TP zone.
• Supertrend: Currently bullish; enhances trade confidence with trend-following confirmation.

LINKUSDT: Inverse Head & Shoulders Breakout! The Reversal BeginsBINANCE:LINKUSDT has broken out of a classic inverse head and shoulders pattern — a well-known bullish reversal formation. After the breakout, price action showed strength by coming back to retest the neckline support and holding it successfully. This confirms the pattern and signals a potential shift in trend.
From a technical perspective, this setup is highly promising. The market structure indicates a likely reversal after an extended downtrend, and the breakout could be the start of a strong bullish phase. With solid fundamentals backing BIST:LINK , the rally could gain serious momentum once it gets going.
This pattern isn’t just any breakout — it’s a reversal of the reversal, a major turning point in trend. If bulls take control, this move has the potential to accelerate rapidly. However, it’s crucial to always manage risk, use a well-placed stop-loss, and avoid overexposure.
Get ready — once the rally starts, it might be unstoppable!
BINANCE:LINKUSDT Currently trading at $15.5
Buy level : Above $15
Stop loss : Below $13
Target 1: $17
Target 2: $1.4
Target 3: $2.1
Max leverage 3x
Always keep stop loss
Follow Our Tradingview Account for More Technical Analysis Updates, | Like, Share and Comment Your thoughts

LINKUSDT 1D AnalysisLINK ~ 1D Analysis
#LINK Buy after successfully breaking through this resistance line with a short-term target of at least 10%++

#LINK/USDT#LINK
The price is moving within a descending channel on the 1-hour frame, adhering well to it, and is heading for a strong breakout and retest.
We are experiencing a rebound from the lower boundary of the descending channel, which is support at 14.50.
We are experiencing a downtrend on the RSI indicator that is about to be broken and retested, supporting the upward trend.
We are looking for stability above the 100 Moving Average.
Entry price: 15.80
First target: 16.45
Second target: 16.90
Third target: 17.56

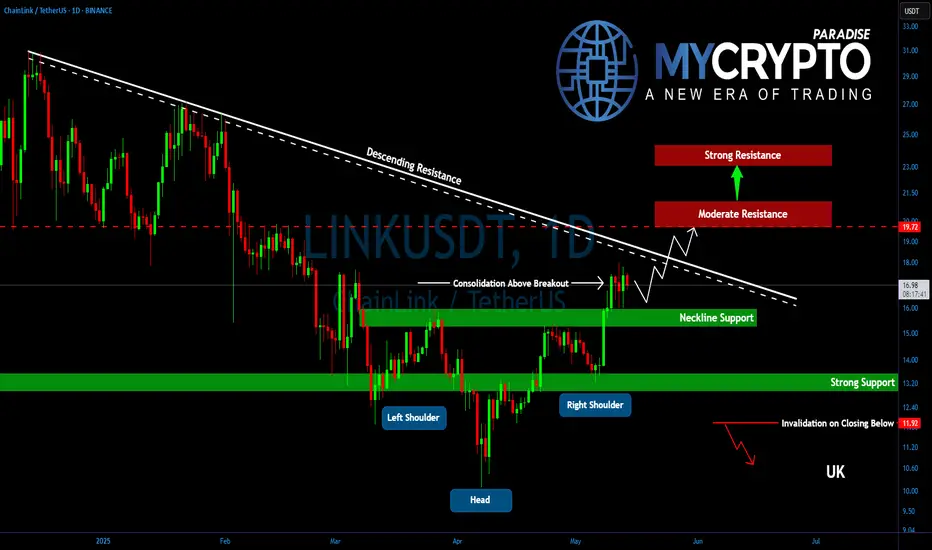
Is LINK Preparing for a Parabolic Rally? Key Levels to WatchYello, Paradisers! After completing its ABC correction, #LINK slipped into a sideways phase — but something significant is brewing beneath the surface. The recent formation of an inverse head and shoulders might be signaling the start of something much bigger.
💎LINK has now confirmed a breakout above the key neckline at $16.00, a critical level that had been capping price action. Following this breakout, the price is holding its ground well and entering a post-breakout consolidation that often acts as the launchpad for the next explosive leg.
💎#LINKUSDT now faces a decisive resistance at $18.50, a trendline rejection point that has held strong since December 2024. A clean break above this level could ignite strong bullish momentum. If bulls succeed, we could see LINK pushing quickly toward the $19.70–$20.30 range, a moderate resistance area, where partial profit-taking is likely from experienced hands.
💎Should momentum persist, the next major upside lies between $23.25–$24.00, the measured target of the inverse head and shoulders breakout. This zone is not just technically significant due to the pattern, it also aligns with the 61.8% Fibonacci retracement, making it a high-confluence resistance.
💎On the downside, LINK has strong support between $16.00–$15.50. This is not only the breakout neckline but also closely aligned with the 50 EMA and 200 EMA, reinforcing this range as a robust demand zone.
Paradisers, strive for consistency, not quick profits. Treat the market as a businessman, not as a gambler.
MyCryptoParadise
iFeel the success🌴
LINKUSDT 1D Analysis LINK ~ 1D Analysis
#LINK Successfully retested this support block. This would be a very good buy for now, with a short term target of at least 10%+.

LINK/USDT Setup: Structure Break + Fibonacci Confluence🚨 Market Watch: LINK/USDT Analysis 🚨
I'm currently keeping a close eye on LINK/USDT. 🧠 On the daily chart, we've observed a clear break in market structure 📉—and dropping down to the 4H timeframe, we see further confirmation of that shift.
At this point, price is looking a bit overextended 🏃♂️💨, and I’m anticipating a retracement back into equilibrium based on the current price swing 📊. This could set up a high-probability short opportunity 🎯.
📹 In the video, I dive into:
Overall trend direction 🔁
Market structure shifts 📐
Price action breakdown 🕵️♂️
And key support/resistance levels to monitor for target zones 🧱
My stop loss would be positioned just above entry, using around 2x ATR for smart risk control
🛡️. As for targets, we could see moves as wide as 6x ATR—but it's crucial to reference the left side of the chart for confluence 📅📈.
I’m aligning this setup with my Fibonacci retracement strategy, which we also covered in the video 🔢📏.
This is not financial advice. Always trade your own plan. ⚠️📉💼

#LINK/USDT#LINK
The price is moving within a descending channel on the 1-hour frame, adhering well to it, and is heading towards a strong breakout and retest.
We are seeing a bounce from the lower boundary of the descending channel, which is support at 14.30.
We have a downtrend on the RSI indicator that is about to be broken and retested, supporting the upward trend.
We are looking for stability above the 100 moving average.
Entry price: 15.00
First target: 15.30
Second target: 15.61
Third target: 15.94

#LINK/USDT
#LINK
The price is moving within a descending channel on the 1-hour frame, adhering well to it, and is heading for a strong breakout and retest.
We are seeing a bounce from the lower boundary of the descending channel, which is support at 12.84.
We have a downtrend on the RSI indicator that is about to break and retest, supporting the upward trend.
We are looking for stability above the 100 Moving Average.
Entry price: 13.33
First target: 13.58
Second target: 13.83
Third target: 14.20

LINKUSDT 1D AnalysisLINK ~ 1D Analysis
#LINK Buy after successfully penetrating this resistant line with a short -term target of at least 10%+.


Chainlink $LINK to 17$?⚠️ RISK TRADE ⚠️
👑 #LINK/USDT BUY 👑
Entry price:
13.76 - 14.17 🟩
Targets:
1️⃣14.62🎯
2️⃣15.24🎯
3️⃣16.04🎯
4️⃣17.05🎯

LINKLINK
March 26, 2025
8:02 AM
CRYPTOCAP:LINK just had a clean bounce off the +W OB (not a full-on impulsive move, but definitely a solid reaction)
Also, the MA100 and MA200 are forming a golden cross on both weekly and 4H TF — pretty bullish signal overall.
Looks like we’re setting up for W3. Right now, we’re in W2 and potentially about to enter W3 of W3, which is usually the strongest leg.

Link: Possible buying opportunity Link find support at 78.60% fib level. We can find similar pattern in previous impulse move. There is highly likely that Link will take off from here all the way to $30.
