LINKUSDT

Chain Link BullishBased on the previous analysis, we were waiting for the coin to break out of the ranging market so that we can have a good entry position.
I do anticipate that the price will continue with the bullish momentum, considering that it has retested the upper trendline.
My entry position will be at 15.00, SL at 12 and target at 22

ChainLink Pattern FormationThis coin has been a rising flag for the past few weeks, and I do anticipate that the coin might continue with the bullish momentum considering that it broke out of the structure.
Currently, it is retesting the upper trendline and we have to wait for an entry position. I anticipate that the price might retest the previous fib level based on the ATL and ATH.
An analysis using the lower time frame will follow when we enter the trade.

Analyzing the Long Link: 200-Day Moving Average and Bullish MomeChainlink (LINK) has been making waves in the cryptocurrency market, particularly after its recent price action. The token, which facilitates secure and reliable data exchange between smart contracts and real-world data sources, has shown promising signs of a bullish trend.
LINK's interaction with the 200-day Moving Average (MA) is a key indicator of this bullish momentum. This long-term moving average often is a significant support or resistance level for cryptocurrencies. When a cryptocurrency bounces back from this level after a correction, it can signal a strong bullish reversal.
In the case of LINK, the token experienced a notable correction earlier this year. However, it has since rebounded and successfully reclaimed the 200-day MA. This bullish signal has ignited optimism among traders and analysts alike.
Several factors contribute to the bullish sentiment surrounding LINK:
1. Strong Fundamentals: Chainlink's underlying technology and growing adoption within the DeFi ecosystem continue to drive its value. The platform's ability to provide reliable and tamper-proof data is essential for developing decentralized applications.
2. Institutional Interest: Institutional investors are increasingly recognizing the potential of blockchain technology, and Chainlink is emerging as a key player in this space. This growing institutional interest can lead to increased demand for LINK tokens.
3. Technical Analysis: Technical indicators suggest that LINK is poised for further upside. The Relative Strength Index (RSI) is currently in oversold territory, indicating potential buying opportunities. Additionally, the Moving Average Convergence Divergence (MACD) is crossing above its signal line, which is a bullish signal.
4. Market Sentiment: The overall market sentiment for cryptocurrencies has been positive recently, with Bitcoin and Ethereum leading the charge. This positive sentiment can spill over into other altcoins, including LINK.
While the bullish outlook for LINK is promising, it's important to remember that the cryptocurrency market is highly volatile. Traders should exercise caution and consider risk management strategies when investing in LINK or any other cryptocurrency.
Potential Upward Targets:
If LINK continues its bullish momentum and breaks above key resistance levels, it could potentially target the following price levels:
• Short-term target: $10
• Medium-term target: $15
• Long-term target: $20
Key Support Levels:
Traders should keep an eye on the following support levels:
• Immediate support: $7
• Strong support: $5
Conclusion:
LINK's recent bounce back from the 200-day MA, coupled with strong fundamentals and positive technical indicators, suggests a strong bullish trend. While the cryptocurrency market is inherently volatile, LINK's potential for growth makes it an attractive investment for both short-term traders and long-term investors.
Disclaimer:
This article is for informational purposes only and should not be construed as financial advice. It's essential to conduct thorough research and consider consulting with a financial advisor before making any investment decisions.

Chainlink 2024-25 bullrun TP targetsLINK could easily catch all 4 of these targets by mid 2025. Utility matters, but when will it kick in? These targets are conservative for this cycle, so 4 profit takes by Summer 2025 would be the perfect scenario. Let's get it!

LINK SWING LONG OPPORTUNITY - ALTSEASON - Altcoin MarketLINK is one of the key blue-chip assets in the crypto market. It is a well-established and reliable project compared to many newer networks and assets, which is why I prefer trading LINK.
Technical Analysis:
The price reached the monthly demand during the August 4th dump, got rejected, and began climbing. Following this, it broke the daily and weekly bearish structure, shifting into bullish momentum. Finally, the price broke the bearish trendline responsible for the downtrend since March 2024.
The price now appears to be retracing into the weekly demand and potentially retesting the flipped bearish trendline. The weekly demand also aligns with the optimal trade entry (OTE) zone, adding extra confirmation for me.
I will look for LTF confirmations to initiate a trade within the marked entry zone.
SL: $9.2
TP1: $19.2
TP2: $22.8

LINK Targets 75% Gain – Can It Hold Support?This chart shows that ChainLink (LINK) might be shifting from a downtrend to an uptrend. The price recently broke above a red descending trend line that had been holding it back for months, which could signal a positive change. LINK is now trading above a strong support zone in Green between $12.52 and $13.03, which suggests that buyers are stepping in to hold the price up. This support level is important; if LINK can stay above it, there’s a chance it could rise to higher levels, starting with the first resistance level around $15.21.
If LINK continues its upward movement, it could reach resistance levels at $17.28, $19.23, and even as high as $22.87, which is the chart’s potential target. This target would mean a 75% gain from the current price if the uptrend holds. However, if the price drops below $12.52, it may retest lower levels, and the bullish outlook would be at risk. Overall, LINK shows signs of strength, but it needs to stay above support to keep the upward momentum going.

LinkusdtHi guys
Do you think we should wait for the $10.6 support area to be consumed and the upward trend line to break down?
Or considering maintaining the upward trend line, provided the previous floor of the price is maintained, can we expect a failure from above and see higher price areas?

Link Breaking out on the WeeklyLink is currently breaking out of weekly structure and retesting it at time of publishing. RSI is nuetral at 52. Price action is caught between the 50 sma and the old resistance. If the PA holds at this level, we could have some major moves.
NFA, do your own DD.
Thanks for looking at the idea.

Chainlink - Bullish Q4 2024! 🚀LINK: Expect a pullback to retest the are zone of= $12.93 shorly. Due to the bulls being overpressure with momentum. Chainlink in the past week has broken out of a major resistance zone dating back since: August 2024.
🌟Target= $23
‼️DISCLAIMER PLEASE READ CAREFULLY‼️
*(THIS NOT FINANCIAL ADVICE, ALWAYS DO YOUR OWN RESEARCH! I AM NOT RESPONSIBLE FOR ANY LOSS OF EARNINGS FROM ANY INVESTMENTS THAT YOU MAY MAKE BASED OFF ANY OF MY IDEAS. ONLY INVEST WHAT YOU CAN RISK TO AFFORD TO LOSE IF YOU MAKE THE DECISION TO DO SO. DO NOT INVEST, UNLESS YOU'RE PREPARED TO LOSE MONEY, IF NOT ALL.)
(CRYPTOCURRENCY CAN BE HIGH-RISK INVESTMENTS DUE TO THE VOLATILLITY OF IT'S NATURE, AND YOU SHOULD NOT EXPECT TO BE PROTECTED IF SOMETHING GOES IN THE WRONG DIRECTION. SEEK PROFESSIONAL ADVICE FROM A CERTIFIED FINANCIAL ADVISOR.)

Link , where to keep your eyes on Gave you link in the accumulation box . Actually if there’s a top five coins i hold till 10 years , one of the would be the link deffo . We go to ath in the coming months so i drew some tp levels so you can decide whether keeping for higher of start taking some juicy profits gradually in the way . Anyway I'm stick to it for now lets see how it goes.
Stay safe fam and don’t forget to DYOR .

#LINK/USDT#LINK
The price is moving in an ascending channel on the 4-hour frame upwards and is expected to continue.
We have a trend to stabilize above the moving average 100 again.
We have a downtrend on the RSI indicator that supports the rise by breaking it upwards.
We have a support area at the lower limit of the channel at a price of 10.84.
Entry price 11.33.
First target 12.00.
Second target 12.47.
Third target 12.95.

Professional Analysis of Chainlink (LINK) on the Weekly TimeframOn the weekly timeframe, Chainlink has completed its 4th wave correction and is now forming the 5th wave of its bullish trend. Based on Elliott Wave analysis, the price is in the support zone between $12 and $16, and once it stabilizes above $16, a strong upward movement is expected.
🔑 Entry and Exit Points:
Entry Point: After price stabilizes above $16 and a bullish candlestick is confirmed on the weekly timeframe.
Price Targets:
Target 1: $80 (400% gain) – You can take partial profits here and move your stop loss to the entry point.
Target 2: $180 (1000% gain) – Ideal for final exit or reducing position size.

Is the LINKBTC chart projecting more #DEFI & #ALTCOIN pain?Since topping out nearly 4 years ago
the #LINK versus #BTC ratio has been down and to the right, with relief rallies being sold into.
Clear trend of lower high's and lower low's.
The trend has not been friendly to the Link Marines!
Are we repeating the tale of #XRP and their faithful army?
Both get dumped on by the their respective foundation or founding company.
Both claim Banks will use their products / software ...
Link does have #CCIP usage but it is not the only #interoperability solution.
We already have #RWA on the blockchain.. they are called #stablecoins.
Either this ratio is in danger of breaking down.
Which maybe signalling a broader #Altcoin market demand destroying period....
Could #geopolitical tensions explode this summer to cause a massive #RISKOFF event and the #Dollar to spike?

Chainlink LINK price: ready, steady.... go !)As soon as the CRYPTOCAP:LINK price on the OKX:LINKUSDT chart stacking in consolidation above the blue trend line, a powerful upward trend begins
This was the case with the price of the #Chainlink token in 2019, in 2023/24, will it happen again in 2024/25?)
Yes 👍 No 👎
_____________________
Did you like our analysis? Leave a comment, like, and follow to get more

LINK/USDT Breakout SetupLINK/USDT Breakout Setup 🚀
LINK/USDT is gearing up near a major resistance level, with potential for a breakout 📈. If the price breaks above this level and confirms it with a retest as new support, we could see a strong bullish movement follow 💥.
🔍 Key aspects to monitor:
1. Breakout confirmation: A solid close above the resistance level.
2. Retest: Look for the breakout level to hold as support.
3. Volume surge: Increased volume during the breakout can strengthen the momentum.
⚠️ Keep a close eye on this pair, but remember, this is not financial advice. Always DYOR (Do Your Own Research) before making any moves. 📊

Chainlink Set to Surge As Chart Shows Bullish Breakout Incoming Chainlink ( BIST:LINK ), a prominent decentralized oracle network, is capturing attention with a substantial platform upgrade unveiled at the 2024 SmartCon event and a potential breakout from a powerful technical formation. Currently trading within a significant symmetrical triangle, Chainlink’s price trajectory could be set for a 50% surge, potentially reaching $15 to $20 if bullish sentiment continues to build.
Key Developments in Chainlink’s Platform: Introducing the Chainlink Runtime Environment (CRE)
At SmartCon 2024, Chainlink co-founder Sergey Nazarov introduced the Chainlink Runtime Environment (CRE), marking a significant milestone for the platform’s evolution. The new CRE aims to address the modularity and security demands of the rapidly evolving blockchain landscape. Through this upgrade, Chainlink ( BIST:LINK ) not only reinforces its place as a decentralized bridge connecting blockchains with real-world data but also enhances its flexibility and scalability for developers across diverse industries.
CRE's modular and extensible architecture is a leap forward in design, allowing developers to integrate essential functionalities like on-chain data access and API interactions with ease. This is made possible through decentralized oracle networks that maintain a high-security environment, ensuring that each operation remains isolated and independently secure. This structure is particularly beneficial for industries such as capital markets, where complex data processing workflows require both security and adaptability.
Additionally, the CRE upgrade supports a gradual, user-friendly transition for current users. This strategic rollout ensures that existing workflows are not disrupted while granting developers access to Chainlink’s advanced features and decentralized security measures. Through this innovative architecture, Chainlink ( BIST:LINK ) stands ready to scale interoperably across numerous blockchains, meeting the expanding demands of capital markets and Web3 applications alike.
Chainlink's Modular, Composable Architecture: A Future-Proof Solution
This latest Chainlink update introduced a modular, composable architecture across multiple chains. It allows developers to design solutions using standardized components and familiar programming languages, offering customization without the need to consider chain-specific constraints. This approach caters to the decentralized finance (DeFi) and capital markets sectors, where complex, cross-chain solutions are increasingly essential.
Chainlink’s vision for CRE aligns with the needs of large-scale enterprises that require adaptable, multi-functional blockchain applications. By connecting smart contracts to real-world data, APIs, and payment systems, Chainlink provides secure, trustless communication between blockchain networks and external sources. This key upgrade underscores Chainlink’s dedication to expanding its platform to accommodate a wider range of blockchains while ensuring scalability and usability for developers.
Technical Analysis
From a technical perspective, Chainlink’s current trading pattern presents a notable opportunity. As of the time of writing, BIST:LINK is trading up by 2.12%, continuing to consolidate within a large symmetrical triangle. This pattern, formed when price movements become progressively tighter, typically indicates a potential breakout, either up or down. Given the current momentum, a bullish breakout could trigger a significant rally, with BIST:LINK possibly reaching the $15 to $20 range, marking an approximate 50% increase.
Key indicators support this bullish outlook
With an RSI at 58, Chainlink ( BIST:LINK ) is currently positioned to break out of the symmetrical triangle. The RSI in this range suggests potential upward momentum without being overbought, aligning with a possible breakout scenario.
Additionally, the emergence of a three white crows pattern—a candlestick formation that signals a bullish continuation or reversal—reinforces the likelihood of a strong upward trend. Typically, this pattern appears after a downtrend or within a consolidation phase, signaling renewed buying interest and an optimistic market sentiment.
If BIST:LINK successfully breaks through the upper boundary of the symmetrical triangle, the cryptocurrency could rally substantially. This price action could attract further interest from investors, amplifying Chainlink’s momentum and broadening its appeal.
Conclusion
With the unveiling of the Chainlink Runtime Environment, Chainlink ( BIST:LINK ) continues to position itself as a fundamental player in the decentralized oracle sector. This upgrade, aimed at modularity, flexibility, and cross-chain operability, has the potential to expand Chainlink’s impact on blockchain ecosystems and attract a more extensive developer and enterprise base.
As Chainlink ( BIST:LINK ) hovers within its symmetrical triangle pattern, the market is eagerly awaiting a breakout. With supportive technical indicators and ongoing platform advancements, Chainlink holds the potential for significant appreciation in the near term, underscoring its evolving role in connecting blockchain applications with the outside world. Investors and developers alike will want to keep an eye on Chainlink ( BIST:LINK ) as it stands at the intersection of fundamental innovation and promising technical movement, positioning BIST:LINK for a potentially transformative future.

$LINKUSDT: Breakout Alert!BINANCE:LINKUSDT is currently forming a symmetrical triangle pattern on the chart, indicating a potential breakout. After an extended consolidation phase, the price action suggests that LINK may be on the verge of a significant move. Traders should monitor key resistance and support levels as the price approaches the apex of the triangle. A confirmed breakout above resistance could signal a strong upward trend, particularly if it is accompanied by increased volume.
This setup presents an exciting opportunity for traders, as a decisive break could ignite a substantial upward movement. With the potential for a powerful rally after a lengthy period of consolidation, now is the time to stay alert for breakout signals. Always conduct your own research and consider your risk tolerance before making trading decisions.
BINANCE:LINKUSDT Currently trading at $12
Buy level: Above $12
Stop loss: Below $10.5
TP1: $13
TP2: $15
TP3: $19
TP4: $22
Max Leverage 3x
Follow Our Tradingview Account for More Technical Analysis Updates, | Like, Share and Comment Your thoughts

LINK USDTLINK USDT is looking good after a long correction the price has been moving in a descending channel since March. After a confirmed breakout from the upper boundary of a descending channel and the resistance zone in Green at $12.52 - $13.03 the target will be the March height at $22.87.
All the targets are marked on the chart.
Everything is on the chart

LINK/USDT 1W chart reviewHello everyone, let's look at the current situation of LINK 1W interval. In this situation, we can see the price rebounding from the downtrend line.
Let's start by setting goals for the near future, which include:
T1 = $11.49
T2 = $13.66
T3 = $15.54
T4 = $17.27
Now let's move on to the stop-loss in case the market continues to decline:
SL1 = $9.27. SL2 = $7.35. SL3 = $5.53
Looking at the RSI indicator, we see
as the movement took place in the upper range, which could have influenced the change in the direction of movement, giving a price recovery.

#LINK/USDT#LINK
The price is moving within a descending channel pattern on the 4-hour frame and is expected to break upwards after it has adhered to it to a large extent
We have a downtrend on the RSI indicator that is expected to break upwards and we have a trend to stabilize above it
We have a major support level in green at a price of 8
We have a trend to stabilize above the moving average 100, which supports the rise
Entry price 9.40
First target 11.32
Second target 12.63
Third target 13.86

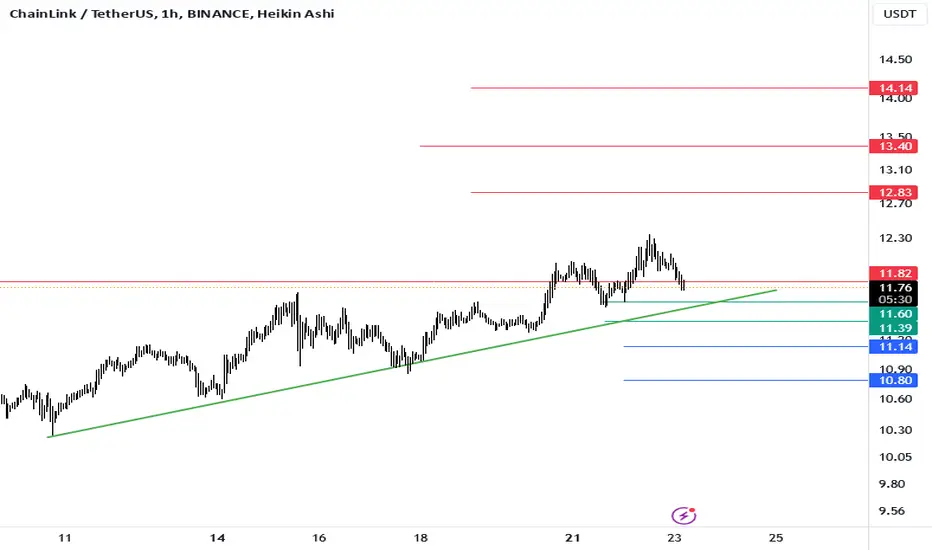
#LINK/USDT#LINK
The price is moving in a descending channel on the 1-hour frame
And it is sticking to it well
We have a bounce from the lower limit of the descending channel and we are now touching this support at a price of 10.60
We have a downtrend on the RSI indicator that is about to be broken, which supports the rise
We have a trend to stabilize above the moving average 100
Entry price 10.80
First target 11.11
Second target 11.36
Third target 11.70
