[UPD] BTC / ETH / XRP / SOL / HYPE and other alt and mem-coins A new video update with insights on the intermediate trend structure with key support and resistance zones to keep on radar in the coming sessions
Coins discussed in the video: CRYPTOCAP:BTC / CRYPTOCAP:ETH / CRYPTOCAP:XRP / GETTEX:HYPE / CRYPTOCAP:SOL / CRYPTOCAP:LINK / CRYPTOCAP:SUI / $BRETT / SEED_DONKEYDAN_MARKET_CAP:FLOKI and others
Hope this is helpful in guiding you through the crypto market. Thank you for your attention and I wish you successful trading decisions!
If you’d like to hear my take on any other coin you’re tracking - feel free to ask in the comments (just don’t forget to boost the idea first 😉).
LINKUSDT

LINK MAJOR MOVE AHEAD !!!CRYPTOCAP:LINK is about to break above major trendline. If it successfully breaks above it, we will see CRYPTOCAP:LINK hitting short term targets of 28, 26 & 44. And Major target for link is around 80-100$.
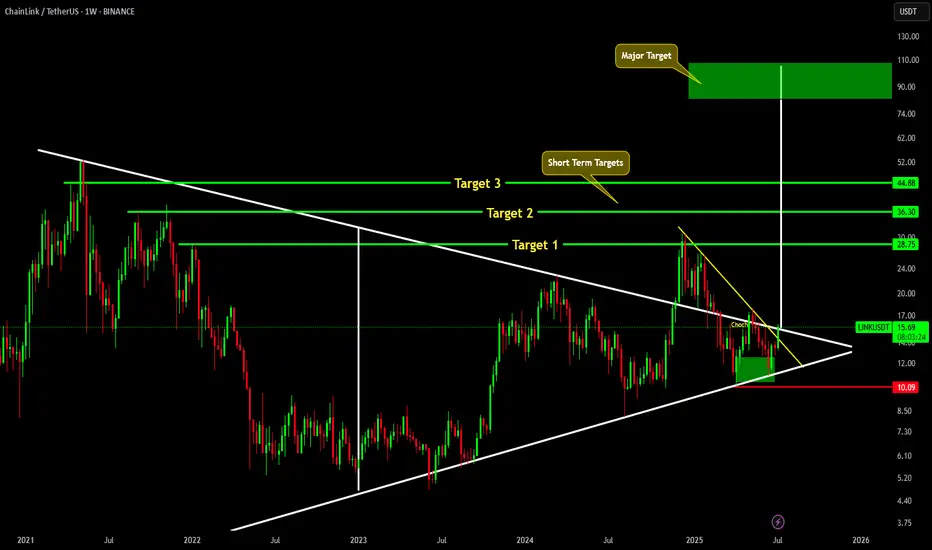
LINK/USDT - SHORT/LONGI expect the movement to be implemented in about a month.
(Not an investment recommendation).

#LINKUSDT: Distribution Phase Has Started! Will It Hit $45? The accumulation phase has just ended, and the distribution phase has just begun. Our current concern is whether the bullish volume holds on and the trend continues to remain bullish. Please do your own research before blindly following the analysis, as this is just our bias and does not guarantee that the price will exactly follow the chart.
Thank you for your support throughout. We wish you the best!
Team Setupsfx_

[UPD] Trend analysis: BTC / ETH / SOL / XRP and other Just recorded a new video overview of the crypto market and the current trend developments in major coins: CRYPTOCAP:BTC , CRYPTOCAP:ETH , CRYPTOCAP:SOL , CRYPTOCAP:XRP , CRYPTOCAP:LINK , GETTEX:HYPE , BSE:SUPER , $FLOKI.
Among the new assets on my radar I shared my view on the trend structure of $RENDER.
In my personal investment planning, I continue to treat any potential corrections into key support zones as opportunities to add or open new positions.
Thank you for your attention and I wish you successful trading decisions!
If you’d like to hear my take on any other coin you’re tracking — feel free to ask in the comments (just don’t forget to boost the idea first 😉).

LINK Breaks Out of Multi-Month Range – Is $17 Next?Chainlink (LINKUSDT) just broke above a key resistance near $15.30 on the 8H chart, shifting market structure from lower highs into potential uptrend. Momentum is strong, with Stoch RSI deeply overbought, signaling possible short-term cooling before continuation. If LINK holds above $15.30, upside targets include $16.50 and $17.20 based on prior highs.
📊 Watching for a retest and hold of the breakout zone.
#LINK #Chainlink #CryptoBreakout #Altcoins #QuantTradingPro #TradingView

Chainlink Grows Above MA200, The Path is Clear To $65 (333% PP)Yes LINKUSDT broke a minor consolidation pattern but that's not all. The action this week is happening right above MA200. This level being conquered last week.
Good evening my fellow Cryptocurrency trader, how are you feeling in this wonderful day?
Chainlink is bullish now and has been bullish for months. Bullish doesn't necessarily means rising prices but potential for growth. Bullish happens at the bottom, when prices are low. Chainlink is bullish now and ready to grow.
For some people it might still be too early. "Anything can happen." "The bull market is not confirmed." "Wait for confirmation." "How do you know?"
I know because of the signals coming from the charts. I know based on marketwide action, Bitcoin's halving, the broader cycle, related markets, intuition, experience, astrology and so on. There are so many signals that it is impossible to mention them all. All these signals and systems point to the exact same thing, the same conclusion; Crypto is bullish, Bitcoin is bullish and Chainlink is set to grow next, now.
Now is the time for growth, it cannot go in any other way. Nothing else is possible, we are going up. It is still early. Not early for confirmation or certainty, early because we will have really strong growth.
It is still early because LINKUSDT is set to hit $44 followed by $65 in the coming months.
Just imagine the energy, the feeling, the euphoria, the market sentiment, your portfolio... Just try and visualize the market six months into the future. What do you see?
Maybe it is hard to feel for sure what is going to be like, but you can be certain that prices will increase. If you are holding Crypto, you will be happy with the results.
You deserve everything that will come to you because you were in when others were gone.
You deserve success and profits because you earned it by making the right choice.
You trusted Crypto, you trusted the market and now you will reap the reward.
Thanks a lot for your continued support.
Namaste.

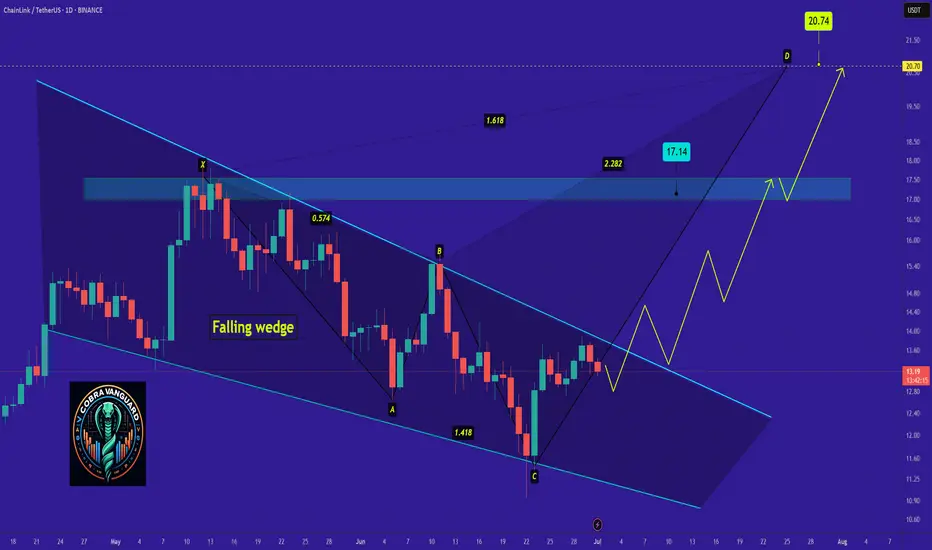
"LINK - Time to buy again!"So if you pay attention to the LINK chart you can see that the price has formed a Ascending wedge which means it is expected to price move as equal as the measured price movement.( AB=CD )
NOTE: wait for break of the WEDGE .
Best regards CobraVanguard.💚
LINK/USDT (Chainlink to Tether) from the 4H interval⚡️ Technical situation – quick overview
✅ Breakout from the descending channel (purple lines)
✅ Resistance zone 14.42 – currently being tested
✅ Target within the breakout range – around 17.73 USDT
⚠️ Stochastic RSI in the overbought zone – local correction possible
🟪 Descending channel – broken!
The descending channel that has been in place since mid-May has been broken upwards.
Such breakouts often signal a change in the local trend.
Theoretical range of movement = channel height (~3.30 USDT) added to the breakout point (around 14.42) = ~17.73 USDT – perfectly aligned with your resistance level.
🟢 Key Resistance Levels (green):
Level Meaning
14.42 USDT Current tested resistance – psychologically significant
15.65 USDT Local high + June price gap
17.73 USDT Potential target after a breakout – range from the formation
🔴 Support Levels (red):
Level Meaning
12.73 USDT Support from the pre-breakout consolidation
11.91 USDT Key defensive level of the uptrend
11.07 / 10.12 USDT Historical support with strong demand reactions
📉 Stochastic RSI (oscillator):
Currently deep in the overbought zone (above 80).
This may indicate local exhaustion of momentum and a short correction before further upward movement.
However: in strong trends, the RSI may remain high for an extended period – it does not automatically provide a sell signal.
📈 Bullish scenario:
Retest of the 14.42 level as support → confirmation of the breakout
Then a move towards:
15.65 – local stop
17.73 – final target from the channel breakout
🟩 Stop-loss: e.g., below 12.73 USDT (loss of key support)
📉 Bearish scenario:
False breakout and decline below 14.42
Loss of the 12.73 level → possible quick decline to 11.91–11.07
🔴 In this case, a new swing low could open the way to 10.12 USDT.
📌 Summary:
Element Rating
Technical Pattern ✅ Breakout from a descending channel (bullish signal)
Current Level ❗ Test of Key Resistance – Decision Point
RSI (Momentum) ⚠️ Overbought – Correction Possible
Upside Potential (Target) 📈 17.73 USDT
Threat ❌ False breakout and return to below 12.73 USDT
🧠 My suggestion (not investment advice):
Observe the price reaction at 14.42 – if it holds above and consolidation forms → a signal to continue.
If the 4H/1D candle closes below, consider caution, as this could be a bull trap.

Link, 1DAs BTC is Falling And BTC is given Breakout of Pattern in 4Hr , then Remaining coins will also fall drastically .
in 1D pattern of ADA USDT , it is Breaking Down as BTC is also given Break Down of Pattern
Follow for More Ideas like This

SCRUSDT UPDATE
Pattern: Falling Wedge Breakout
Current Price: \$0.268
Target Price: \$0.398
Target % Gain: 50.1%
Technical Analysis: SCR has broken out of a falling wedge pattern on the 12H chart with a clean close above resistance. The breakout is backed by bullish candles and increasing volume, suggesting a potential 50% move upward.
Time Frame: 12H

Link short setup tradeAS previous short setup hits the tp but actually first manipulation to hit the sl, now closely monitor the trade and manually close if 4hr candle closes above the mentioned point, overall I'm bearish on whole market, needs to take a correction before another leg up, until unless usdt.d breaks and closes below 4.59% on 4hrs tf market is bearish, you need to take short position intsead of long positions, when usdt.d reaches 4.63% open short on link, inj, eth and btc and hold till 4.80%-4.89%. I will open long if we break 4.59% and retest this, other scenario if we reaches 4.80-4.90% first no long positions for me from here.

LINK/USDT Chainlink Gearing Up for a Major Breakout?
🧠 Overview:
The LINK/USDT chart is showcasing a high-conviction technical setup — a well-defined Descending Triangle that has been forming for over 6 months. This pattern often acts as a pressure-cooker scenario, building up momentum before a major breakout.
The triangle is composed of consistent lower highs pressing against a strong horizontal support zone at $12.5 – $13.2, which has been tested and held multiple times since February 2025.
Currently, the price is approaching the apex of the triangle, signaling that a breakout is likely imminent.
📐 Pattern Details – Descending Triangle:
🔻 Descending Resistance Line: Connecting lower highs since the January 2025 peak.
🟨 Flat Support Zone: The $12.5 – $13.2 level has served as a strong demand zone.
⏳ Apex Nearing: Price action is compressing, and breakout pressure is building.
📉 Decreasing Volume: Volume is drying up — a classic precursor to a breakout move.
✅ Bullish Scenario (Breakout):
If LINK breaks above the descending trendline and reclaims resistance around $14.00 – $15.44, the chart could ignite a strong upside move.
🚀 Bullish Targets:
1. $15.44 (first key resistance & breakout validation)
2. $17.44 (prior structure resistance)
3. $19.38 (swing high from Q1)
4. $26.58 (major resistance zone)
5. $28.00 – $29.35 (long-term upside target)
📌 Breakout Confirmation: Look for high volume and a successful retest of the breakout level to confirm bullish momentum.
❌ Bearish Scenario (Breakdown):
If LINK fails to hold the $12.5 – $13.2 support zone and breaks below it with strong volume, downside risks increase significantly.
⚠️ Bearish Targets:
$11.00 (minor support)
$9.50 (next demand zone)
$8.00 (macro support from 2023)
A breakdown from this triangle would invalidate the bullish setup and could trigger a broader bearish continuation.
🧩 Conclusion & Strategy:
📊 Pattern: Descending Triangle
🕰️ Formation Duration: 6+ months (strong reliability)
🟨 Critical Zone: $12.5 – $13.2 = Key Support
📍 Breakout Trigger: Above $15.4
🔍 Breakdown Trigger: Below $12.5
📌 Trading Ideas:
🔼 Long Position: Upon breakout above $15.4 with confirmation
🔽 Short Position: Upon breakdown below $12.5 with increased volume
📚 Bonus Insight:
Chainlink remains one of the most widely adopted oracle solutions in DeFi and enterprise blockchain. A technical breakout from a long-term consolidation like this could attract both retail and institutional capital.
#LINKUSDT #Chainlink #CryptoBreakout #DescendingTriangle #Altseason #TechnicalAnalysis #BullishSetup #CryptoSignals #TradingView #AltcoinSetups

Will this breakout unlock 17% gains toward the $16 target?Hello, ✌
All previous targets were nailed ✅! Now, let’s dive into a full analysis of the upcoming price potential for Chain LINK 🔍📈.
BINANCE:LINKUSDT is currently testing the psychological daily resistance zone around the $14.00 level. A confirmed breakout above this area could open the way for a potential upside move of roughly 17%, with the next key target around $16.00. Price action near this zone should be watched closely for either rejection or continuation. 🚀📈
✨ Need a little love!
We put so much love and time into bringing you useful content & your support truly keeps us going. don’t be shy—drop a comment below. We’d love to hear from you! 💛
Big thanks, Mad Whale 🐋

Chainlink, The Fed, Vanguard, Crypto & Apple"Buy the rumor, sell the fact." The market tends to price-in an event before it happens. I am talking about the reduction in interest rates. The participants are aware that there will be a reduction in interest rates by the Fed and this is bullish and so buying starts to happen much sooner compared to the announcement of the actual event. By the time the event becomes a reality, it is already priced-in. Meaning...
Chainlink is bullish now and the chart is the same as HIVEUSDT, which I shared just now, and many other altcoins. This is good because we know what happens next. If there are other pairs with the same chart but moving up, moving ahead, then we know that these two and all those other staying behind will also follow, makes sense? Sure it does. We are all one. What one does, the rest follows.
Chainlink (LINKUSDT) is set to grow. Easy to see, higher highs and higher lows.
Will the market go up because of the Fed? We can say so before or after the event, right now the only important action is to buy-and-hold. It is important to be fully invested in Crypto, because Crypto is outperforming every other risk-asset in the entire world. You want be in in the market that is about to pay. You don't want to be holding bonds or index funds, that's a huge mistake. You buy these stuff to make money, you can make with Crypto in 6 months what an index fund (Vanguard SPX) will pay in a decade... Do the math, are you a young adult, are you smart? If you are, take action now before it is too late.
Your choice of course. Imagine the people in the 80s investing in Gold rather than Google, Microsoft and Apple... Big mistake.
Namaste.

Final $LINK in the corrective chain?If you find this information inspiring/helpful, please consider a boost and follow! Any questions or comments, please leave a comment!
LINK could be finishing a double zigzag correction. Recent reaction at the channel’s most likely target area shows promise. Watching for an internal retrace that holds above key support.
Key Levels:
11.81: Ideal retrace floor
11.00: Break kills impulse idea
13.25: First upside flip needed
15.00: Big level to break for bulls
Bulls have been tricked before with possible impulse starts. This one has the right look and confluence, but caution is warranted. Ideally, we get consolidation and push above 13.25 to build confidence in further upside.
As long as price holds above 11.81 and builds higher lows, potential remains for an impulsive move up. Break below 11 and bias flips back to bearish continuation.
Trade Safe!
Trade Clarity!

LINk/USDTFor the Link currency, I feel that this decline is continuing and it is continuing to decline step by step. The chart was not readable. Tell me your opinion.

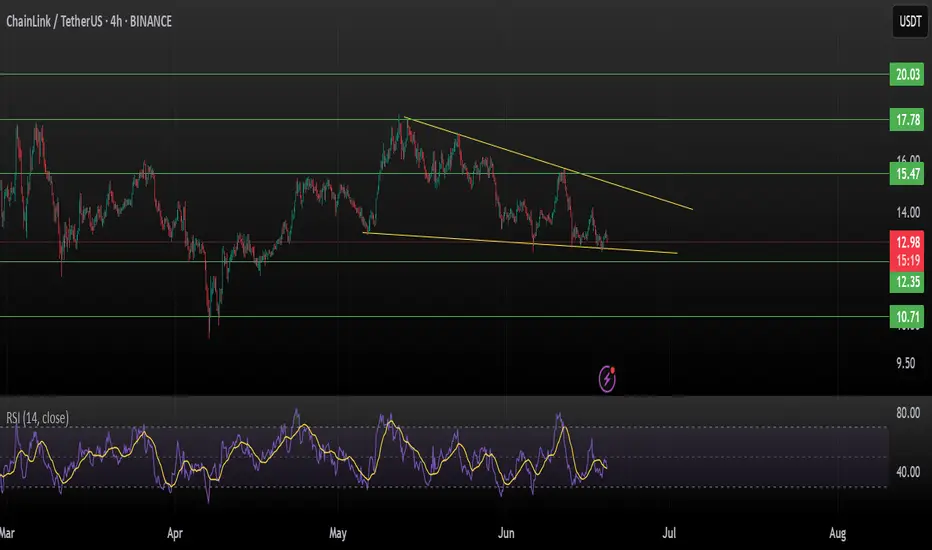
Chainlink (LINKUSDT) | Falling Wedge at Critical SupportChainlink is trading within a well-defined falling wedge pattern on the 4H chart, a typically bullish reversal setup. Price action indicates the coin is hovering just above key horizontal support around $12.35, making this a critical zone to watch.
Technical Breakdown:
Pattern: Falling Wedge (Bullish Bias)
Current Price: $12.98
Immediate Support: $12.35
Major Support: $10.71
Resistance 1: $13.80 (wedge upper trendline)
Breakout Targets:
$17.78 (major resistance)
$20.03 (macro level supply zone)
Indicators:
RSI (14) at ~42 → Weak but stabilizing, potential for reversal
Volume has been compressing — watch for a breakout with rising volume for confirmation
Strategy:
A 4H close above the wedge trendline with volume could trigger a breakout rally toward $17.78 or even $20.03.
Failure to hold $12.35 could send LINK back toward $10.71 support, caution below this level.
Setup Summary:
Long entry on breakout above $13.50 (trendline)
Stop-loss: Below $12.35
Target 1: $17.78
Target 2: $20.03
Risk: Reward Ratio: ~1:3+
Not financial advice. DYOR before entering trades.
If this analysis helps, like & comment your view.
LinkEntry price yellow line
Stop loss update from red line to yellow line
We hit first Take profit
I Close full now


LINK Structure Shaping Up for Potential BreakoutvChainlink is now approaching a key resistance trendline after showing a strong bounce from the recent demand zone.
Price is pushing into this trendline with good momentum. If we see a clear breakout and daily close above it, this could open the door for a continuation move toward the next target area around seventeen point seven dollars.
However, this is still an important level to watch. If the trendline holds and price gets rejected, a pullback toward the demand zone near fourteen dollars is possible.
At this stage, the chart is showing a constructive setup. It’s worth keeping an eye on how price behaves here in the coming sessions.
Thanks for reading

link updateentry price 15.48
stop loss 15.48
take profit
11.9
10.95
we hit first and second take profit

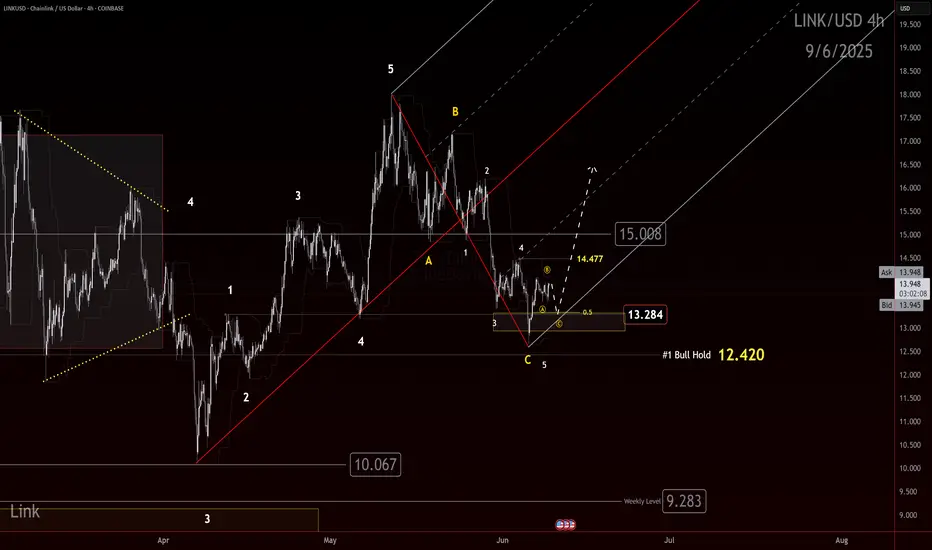
LINK Bulls Building Toward a Chain ReactionIf you find this information inspiring/helpful, please consider a boost and follow! Any questions or comments, please leave a comment!
LINK just gave us a clean reaction out of an identified box. Bulls may finally be gaining control and a trend shift up is on the table.
We had eyes on this box for a potential reaction. The market delivered. Now bulls need to prove they can build on it. The first key is to defend 13.284. As long as this level holds, the case for a higher trend remains alive.
Next, bulls need to clear 14.47. That is the first smaller degree LH that must be taken out to confirm that buyers are pushing through the structure.
The big step remains 15.00. This has acted as a major flipping level. A true test for the bulls will be whether they can reclaim and hold above it. If they do, the door opens for stronger upside follow through.
The path is clear:
💥 Hold 13.284
💥 Break 14.47
💥 Reclaim 15.00
We will continue to track this closely with the Elliott Scanner mindset. If momentum picks up through these levels, this could become an attractive higher-degree setup.
Watch these levels carefully. Bulls have work to do, but the ingredients for a shift are building.
Trade Safe!
Trade Clarity!