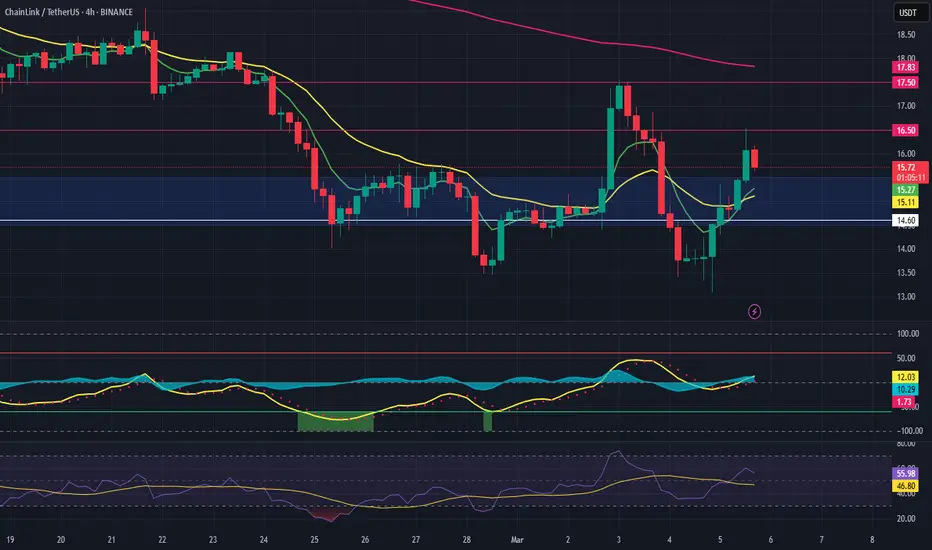
LINK Long OpportunityMarket Context:
LINK is currently testing the range's high support level at $15.30. A break and hold above this level could present a strong long opportunity for further upside.
Trade Details:
Entry Zone: $15.30
Take Profit Targets:
$16.50
$17.50
Stop Loss: Just below $14.60
This trade setup focuses on confirmation of strength at support, aiming for higher targets if the breakout sustains. 🔥
LINKUSDT
The Bull Market Is Just Starting For Chainlink LINKHello, Skyrexians!
During this bull run the best performance has been showed by the old high cap coins, BINANCE:LINKUSDT is not an exception. It had a textbook accumulation and then growth for 5x+ from the bottom. Is it enough or the main gains ahead.
Let's take a look at the weekly time frame. The first wave from the bull run start we can count as a wave 1. Then retracement has happened in the wave 2 and currently asset is forming wave 3. Looks like now price is finishing the wave 2 inside the larger wave 3. It would be better to see the green dot on the Bullish/Bearish Reversal Bar Indicator like we have seen previously, but the zone is already great to buy this asset. Target is located between 1 and 1.61 Fibonacci extensions which corresponds the price range between $40 and $50.
Best regards,
Skyrexio Team
___________________________________________________________
Please, boost this article and subscribe our page if you like analysis!

$LINK offers a great entry - Aiming for new ATHsNot the cleanest chart, but BIST:LINK offers a solid demand area here. The monthly and weekly RSI are currently resetting and also retesting the POC (Price of Control).
I'm willing to bid some here and place the rest of my buys closer to $15 in case we see a bit more of a retrace.
Target is closer to the previous ATHs.
BINANCE:LINKUSDT

COTIUSDT UPDATECOTIUSDT is a cryptocurrency trading at $0.08793. Its target price is $0.15000, indicating a potential 80%+ gain. The pattern is a Bullish Falling Wedge, a reversal pattern signaling a trend change. This pattern suggests the downward trend may be ending. A breakout from the wedge could lead to a strong upward move. The Bullish Falling Wedge is a positive signal, indicating a potential price surge. Investors are optimistic about COTIUSDT's future performance. The current price may be a buying opportunity. Reaching the target price would result in significant returns. COTIUSDT is poised for a potential breakout and substantial gains.

LINKUSDT 1WLINK ~ 1W Analysis
#LINK Buy gradually from here if you still have a Conviction on this coin with a short -term target of at least 20%+.

Chainlink Fractal Price Pattern Dynamics & Bullish Growth Pot...Right now I am going to describe the conditions for LINKUSDT and the same analysis that is true for this pair is also true for most of the Altcoins market. The market is one.
Chainlink (LINKUSDT) produced a rising-wave in late 2024 and later a correction. This is also true for the rest of the Altcoins market. The correction is coming to an end producing a higher low compared to August 2024.
In mid-2024 (left side of the chart), we can see how a down-wave leads to a sideways market. This is the main condition that is now sure to develop. The sideways market of course is the period of accumulation, where the bulls accumulate strong in order to produce a new series of bullish waves. We know the next move is bullish because of the long-term higher low. The low in early 2025 is higher than the low in mid-2024.
This can be described as a simple 1,2,3 steps pattern.
1) The decline. This decline can be strong, long or short, steep or soft. Allow for wide variations across the market.
2) Sideways. This is the period where buyers accumulate at low prices before the next cycle starts.
3) The bullish wave. In this case, the next bullish wave is actually the 2025 bull-market. So instead of a simple bullish wave we will see massive growth ending with a bull-run phase in late 2025.
Ok. Present day. We have the decline which started in mid-December 2024. This decline is leading to step #2 which is the sideways action. Out of this sideways (consolidation channel) we will see a new bull-market develop.
Simple? Buy and hold.
Good things will happen to those that decide to buy Crypto.
Great things coming for those who decide to follow.
Thanks a lot for your continued support.
Namaste.

LINK Long Opportunity Market Context:
LINK has retraced into a key support area, presenting a solid risk-to-reward opportunity for a potential move higher.
Trade Details:
Entry Zone: $14.50 - $15.50
Take Profit Targets:
$17.20
$19.50 - $21.50
$27.00 - $30.00
Stop Loss: Just below $13
This setup anticipates buyers stepping in at support, with the potential for upside continuation if momentum builds. 🔥

LINK is Bullish now & many Traders don't see it !!Because of politics and misleading news, we are now witnessing these prices, and this caused most of my analyses to be wrong and not go according to my thoughts. However, now the price has a strong support area that if it reacts to it, the price will go up to $19 and create a V pattern. Since this market is filled with some politicians and some Persons & their misleading promises, maybe the price will drop again and go down to $13 and then grow again.
Give me some energy !!
✨We spend hours finding potential opportunities and writing useful ideas, we would be happy if you support us.
Best regards CobraVanguard.💚
_ _ _ _ __ _ _ _ _ _ _ _ _ _ _ _ _ _ _ _ _ _ _ _ _ _ _ _ _ _ _ _
✅Thank you, and for more ideas, hit ❤️Like❤️ and 🌟Follow🌟!
❗Disclaimer
⚠️Things can change...
The markets are always changing and even with all these signals, the market changes tend to be strong and fast!!

Chainlink Under Pressure – Breakdown or Fakeout?LINK has broken below a key support level and is now retesting it as resistance, indicating a potential continuation of the downtrend.
The current setup suggests a bearish bias with a favorable risk-to-reward ratio.
DYOR, NFA

Can #LINK Bulls Make a Comeback or Not? Bears Still in ControlYello, Paradisers! Is #LINKUSDT About to Break Down, or Will Bulls Defend This Critical Support? Let's discuss the latest analysis setup of #Chainlink:
💎#LINK is at a critical decision point, trapped inside a descending channel that has dictated price action for months. The question is—will it finally break out, or are we heading for another major leg down?
💎#LINKUSD is testing a crucial support zone around $14.00-$14.50, a level that previously acted as resistance and has now flipped into support. Losing this area could send the price tumbling toward the next major support at $8.08 and give bears total control.
💎The descending resistance line has been rejecting every bullish attempt, keeping #LINK in a downtrend. For a trend reversal, #LINK must break above $19.63, which would invalidate the bearish setup and open the doors for a strong rally toward $24-$26.
💎Bullish divergence spotted on the MACD suggests that a short-term relief rally could occur. However, unless we see a confirmed breakout, any upside movement might be just a temporary bounce before further downside.
Stay focused, patient, and disciplined, Paradisers🥂
MyCryptoParadise
iFeel the success🌴

LINK Bounces Back over 14.44LINK Bounces Back over 14.44 – Textbook Setup Continues
🚀🔗 LINK Bounces Back to 14.44 – The Textbook Setup Continues! 📚
LINK has returned to the $14.44 mark, right where we left off from our previous textbook trading breakdown. This crucial level, once a target, now stands as new support—a testament to how LINK consistently respects classic technical structures. Let’s dive in:
What’s Happening?
Textbook Channel Patterns: LINK continues to move within well-defined channels, confirming breakouts that often flip into new support levels.
From Target to Support: Our earlier projection of $14.44 was spot on. Now that price has revisited this zone, we’re looking for confirmation to the upside.
Why the Optimism?
Strong Fundamentals: LINK’s oracles remain a cornerstone of DeFi infrastructure.
Consistent Technicals: Breakouts followed by support flips—classic and reliable.
2025 Bounce Potential: According to recent news, there are multiple catalysts lined up that could drive LINK higher.
Next Steps
Hold Above 14.44: If LINK consolidates and holds this level, it could pave the way toward $19.67 or higher.
Channel Continuation: Keep an eye on the rising channel. Any break below support might signal a short-term pullback, but the broader trend remains bullish.
Whether you’re new to LINK or a seasoned trader, this coin continues to offer excellent technical clarity—a dream scenario for anyone looking to hone their chart-reading skills.
One Love,
The FXPROFESSOR 💙

LINK Mid TermChainlink (LINK/USDT) Summary Analysis
• Support Zone: $16.00 - $12.64 USDT (strong demand area).
• Resistance Levels: $24.12 USDT (first target) and $35.40 USDT (main target).
• Channel Structure: Price is near the lower band of a descending parallel channel, indicating a potential reversal signal.
Scenarios:
✅ Bullish Scenario: If LINK bounces from $16.00 USDT, targets are $24.12 USDT and $35.40 USDT.
❌ Bearish Scenario: A close below $16.00 USDT could trigger a drop to $12.64 USDT.
Strategy:
🔹 Entry: Buy within the $16.00 - $18.00 USDT range, with a stop loss below $12.64 USDT.
🔹 Breakout: A breakout above $24.12 USDT presents a buying opportunity.
🔹 Sell: A close below $16.00 USDT may accelerate the downtrend.
If the channel breaks out, LINK has significant upside potential. 🚀

LINK/USDT 1H: Bearish Momentum – Short Setup Targeting $15.80?LINK/USDT 1H: Bearish Momentum – Short Setup Targeting $15.80?
🚀 Follow me on TradingView if you respect our charts! 📈 Daily updates!
Current Market Structure:
Price at $16.03 with strong bearish momentum, having broken multiple support levels.
Clear bearish structure with a bearish breaker formed at $17.20 and multiple BOS confirmations.
Market Maker Activity:
Distribution phase is in effect, with market makers likely targeting $15.80 support.
Technical Indicators:
RSI is oversold at 26.51, yet momentum remains bearish.
No hidden divergence visible on the current timeframe.
Key Levels:
Resistance: $16.80 (previous support turned resistance).
Support: $15.80 (next major support level).
Trade Setup (Confidence 8/10):
Entry:
Look for a relief bounce in the $16.20-$16.40 zone.
Targets:
T1: $15.80
T2: $15.40
Stop Loss: $16.85 (above the recent breaker).
Risk Score:
7/10 – High volatility environment but with a favorable risk-to-reward if key levels hold.
Recommendation:
Wait for confirmation of a bounce in the $16.20-$16.40 range before entering the short position.
Given the oversold conditions and distribution phase, avoid chasing the current move.
Monitor price action closely as the downtrend continues toward the $15.80 support.
🚀 Follow me on TradingView if you respect our charts! 📈 Daily updates!

TFUELUSDT UPDATETFUELUSDT is a cryptocurrency trading at $0.05370. Its target price is $0.09000, indicating a potential 50%+ gain. The pattern is a Bullish Falling Wedge, a reversal pattern signaling a trend change. This pattern suggests the downward trend may be ending. A breakout from the wedge could lead to a strong upward move. The Bullish Falling Wedge is a positive signal, indicating a potential price surge. Investors are optimistic about TFUELUSDT's future performance. The current price may be a buying opportunity. Reaching the target price would result in significant returns. TFUELUSDT is poised for a potential breakout and substantial gains.

LINK | Wyckoff Method | Phase 3 IMPULSE WAVELINK shows a very clear Wyckoff Method Cycle from the macro timeframe:
This is typically what a Wyckoff Method cycle looks like from a macro perspective:
When we look at Chainlink from the macro and compare it to the previous cycle, it seems likely that LINK goes up in "impulse waves". We now have Wave 3 to look forward to, which may likely play out over a few months - as did the previous cycle.
________________
COINBASE:LINKUSD

LINK road map (4h)Now it can be said that the price is in a wedge, and if a breakout occurs, we will see the price rise above $20 .
Give me some energy !!
✨We spend hours finding potential opportunities and writing useful ideas, we would be happy if you support us.
Best regards CobraVanguard.💚
_ _ _ _ __ _ _ _ _ _ _ _ _ _ _ _ _ _ _ _ _ _ _ _ _ _ _ _ _ _ _ _
✅Thank you, and for more ideas, hit ❤️Like❤️ and 🌟Follow🌟!
⚠️Things can change...
The markets are always changing and even with all these signals, the market changes tend to be strong and fast!!

DYDXUSDT UPDATEDYDXUSDT is a cryptocurrency trading at $0.8384. Its target price is $1.0000, indicating a potential 90%+ gain. The pattern is a Bullish Falling Wedge, a reversal pattern signaling a trend change. This pattern suggests the downward trend may be ending. A breakout from the wedge could lead to a strong upward move. The Bullish Falling Wedge is a positive signal, indicating a potential price surge. Investors are optimistic about DYDXUSDT's future performance. The current price may be a buying opportunity. Reaching the target price would result in significant returns. DYDXUSDT is poised for a potential breakout and substantial gains.

LINK/USDT 1W chart ReviewHello everyone, let's look at the 1W link to USDT, in this situation we can see how the price moves under the downward trend line, but we can see some price stabilization, which can affect the potential change of trend. However, let's start by defining goals for the near future the price must face:
T1 = 19.20 $
T2 = = $ 21.67
Т3 = $ 25
T4 = $ 27.65
Let's go to Stop-Loss now in case of further declines on the market:
SL1 = $ 16.82
SL2 = $ 14.90
SL3 = 12.73 $
Looking at the RSI indicator, we see the descent below the lower limit of the range, which may also indicate

LINK STARTEDhello friends
This potential coin finally started its trend.
Considering the sharp movement he has made, we expect that the specified targets will move.
The loss limit of this currency is the red line, if it falls below it, we will exit with a small loss.
Note that this coin has a lot of potential.
Don't forget capital management.
Be successful and profitable.

LINK/USDT 1H: Bearish Breakdown – Targeting $17.20 Support?"LINK/USDT 1H: Bearish Breakdown – Targeting $17.20 Support?
🚀 Follow me on TradingView if you respect our charts! 📈 Daily updates!
Current Market Structure:
Price is exhibiting a bearish trend after breaking key support at $18.40.
Current trading around $17.83 indicates further downside potential.
Market Maker Activity:
Distribution pattern is visible with lower highs and lower lows.
Market makers are likely targeting liquidity around $17.20.
Technical Indicators:
Hidden bearish divergence on RSI reinforces the downtrend.
Volume profile confirms ongoing distribution.
Trade Setup (Confidence 7.5/10):
Entry: Short entry on a retest in the $17.90-$18.00 zone.
Targets:
T1: $17.40
T2: $17.20
Stop Loss: Place above recent highs at $18.45.
Risk Score:
8/10 – High-risk environment with a favorable risk-to-reward, provided key levels hold.
Recommendation:
Short positions are recommended once a retest of the $18.00 resistance is confirmed.
Monitor volume closely and wait for confirmation before entering.
🚀 Follow me on TradingView if you respect our charts! 📈 Daily updates!


Be careful with LINK !!!The price has formed a Triangle on the 4h time frame, and if it breaks out, it can drive the price up to around $21.70 .
Give me some energy !!
✨We spend hours finding potential opportunities and writing useful ideas, we would be happy if you support us.
Best regards CobraVanguard.💚
_ _ _ _ __ _ _ _ _ _ _ _ _ _ _ _ _ _ _ _ _ _ _ _ _ _ _ _ _ _ _ _
✅Thank you, and for more ideas, hit ❤️Like❤️ and 🌟Follow🌟!
⚠️Things can change...
The markets are always changing and even with all these signals, the market changes tend to be strong and fast!!

LINKUSDT Ready to Explode or Fakeout Incoming? Don’t Get TrappedYello, Paradisers! Is LINKUSDT finally gearing up for a strong breakout, or is another shakeout coming? Let’s break it down.
💎LINKUSDT has been looking good after completing a double zigzag corrective pattern. The price has also formed a descending channel with a bullish divergence, signaling potential upward momentum. On the lower timeframes, we can spot a developing W pattern, but for a confirmed breakout, we need to see: A clean breakout above resistance & A candle closing above resistance with strong volume.
💎If the market sees further retracement or panic selling, a bounce from the key support zone is likely. However, to increase our probability of success, we’ll be watching for bullish I-CHoCH, a confirmed W pattern, or an inverse head and shoulders on lower timeframes.
💎If LINKUSDT breaks down and closes candle below support, the bullish setup will be invalidated. In that case, waiting for a better price action setup will be the smart move.
🎖 Patience and discipline are what separate pros from amateurs. Stick to high-probability setups and wait for confirmation. That’s how we win long-term!
MyCryptoParadise
iFeel the success🌴
