LINKUSDTLINK ~ 5D ✅
#LINK Last time Smart money accumulated in this support block area. if this happens again,. Maybe this area will be an excellent purchase. Please note, this area has a wide purchasing range. If you are interested,. Gradual purchasing is possible in this area.
Linkusdtlong

Long position on LINKUSDT 49Min/ Volume PredictionBINANCE:LINKUSDT
COINBASE:LINKUSD
High-risk status: 4x-5x Leverage
Mid-risk status: 3xLeverage
Low-risk status: 2x Leverage
⚡️TP:
13.72
13.85
13.95
14.09
14.23
14.34(In Optimistic Scenario)
➡️SL:
13.28
13.07
12.85
The Alternate scenario:
If the price stabilize below the trigger zone, the setup will be cancelled.

LINKUSDT undervaluedpotential long to see how the market reacts to the current key level. If bullish reaction traget at 20.729 / 21.922

#LINK/USDT#LINK
The price is moving in a bearish channel on the 12-hour frame and adheres to it well, and the price rebounded from the lower border of the channel at the green color at the price of $13.00.
We have a tendency to stabilize above the Moving Average 100
We have a downtrend on the RSI indicator that was broken to support the rise
Entry price is 14.30
The first target is 16.50
The second goal is 17.70
Third goal 19.56

Link bullish or bearish - A technical analysis
Support Levels:
$12.09: A key support level currently holding the price.
$11.06: Another potential support level below $12.09.
$8.40: Further support if the price breaks below $11.06.
$5.13: Major historical support level.
Resistance Levels:
$27.36: Immediate resistance.
$37.05: Next significant resistance level.
Trendlines:
-The chart shows an upward trending channel with support and resistance lines indicating a long-term bullish trend.
-The price recently bounced off the lower support trendline and is moving towards the resistance trendline.
The most recent monthly candlestick is bullish, indicating positive price movement and suggesting a potential continuation of the upward trend.
The Stochastic RSI at the bottom of the chart is in the overbought territory, which could suggest a potential short-term pullback or consolidation.
Bullish Scenario:
If the price maintains above the $12.09 support level, it is likely to retest the $27.36 resistance level.
A break above $27.36 could lead to further upside towards $37.05.
Bearish Scenario:
If the price fails to hold the $12.09 support level, it may find the next support around $11.06.
A break below $11.06 could lead to a drop towards $8.40 or even $5.13.

LINKUSDT Elliott Waves AnalysisHello friends.
Please support my work by clicking the LIKE button👍(If you liked). Also i will appreciate for ur activity. Thank you!
Everything on the chart.
The impulse have been completed, im waiting for correction and continuation of growth.
Entry zone: 13 - 10$
Good luck everyone!
Follow me on TRADINGView, if you don't want to miss my next analysis or signals.
It's not financial advice.
DYOR!

ChainLink long idea I believe that one of these two scenarios will come true and I still think it is bullish for the crypto market.

#LINK/USDT#LINK
The price is moving in a perfectly symmetrical descending triangle
It was broken higher and the moving average 100 broke
Current price 14.90
The first goal is 15.95
Second goal 16.28
Third goal 17.53

February Crab Repeat, Channel drop into TriangleLink went to the all time high 36$ range in Feb and channel A dropped into triangle A.
it broke the triangle into another channel upward to break a new previous high which was the 44$ range and we're seeing a similar triangle drop where we may range sideways for months after dropping from channel B into triangle B.
BEARISH

#LINK/USDT#LINK
It is moving in a bearish channel on a 4-hour frame, and the price has committed to the green area at the level of 19.50.
We have a higher stability moving average of 100
We have bullish momentum on the RSI
Entry price is 19.95
First goal 20.28
The second goal is 20.61
The third goal is 20.97

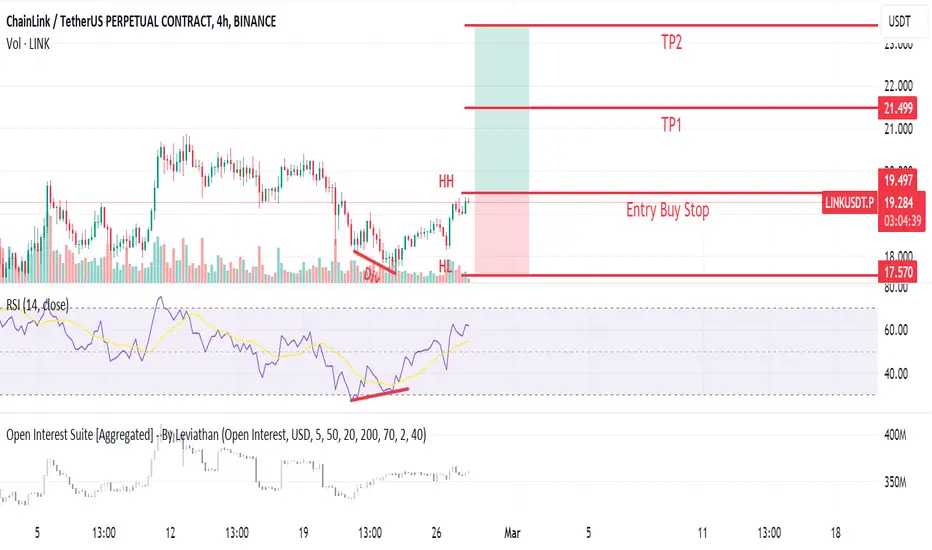
LINKUSDT Bullish (4H Div, DOW HHs)Instrument has started its bullish price direction based on making DOW HHs and HLs supported by 4H Divergence. A buy stop is placed at previous HH. What do you think, will it break the HH and go up?
Trade Plan
SL: Previous LL
Entry: Buy stop @ break of HH
TP1 and TP2 based on 1:1 and 1:2
Note: Break even after TP1 is hit.
LINK/USDT Looking BullishTRADE ALERT!LINK
Ticker: LINK/USDT
Entry: 17.5$ - 18.45$
Take Profit: 21-23$
Stop Loss: 16$
Risk to reward: 1:2
Technical Thesis: Link breaked the support of one day also took the retest and start pumping, we can expect a good Movement toward a the Next support

ChainLink The Great AccumulationHello dear traders! If you like my graphics, please use Like button 💙💛.
There exists a potential scenario wherein COINBASE:LINKUSD could undergo a substantial x4.6 surge between late 2023 and early 2024.
In the chart provided, you can observe the accumulation pattern, with the price action mirroring it remarkably accurately.
What strengthens this possibility is the ongoing robust accumulation phase that has been in progress since April 2022, spanning nearly 500 days.

LINKUSDT Elliott Waves AnalysisHello friends.
Please support my work by clicking the LIKE button👍(If you liked). Also i will appreciate for ur activity. Thank you!
Everything on the chart.
Waiting for last upward movement before correction.
Entry: Market and lower
Target zone: 18.5 - 21$
after first target reached move ur stop to breakeven
Stop: (depending of ur risk). ALWAYS follow ur RM .
risk is justified
Good luck everyone!
Follow me on TRADINGView, if you don't want to miss my next analysis or signals.
It's not financial advice.
Dont Forget, always make your own research before to trade my ideas!
Open to any questions and suggestions

LINK/USDT Tripple Top Pattern , Looking BearishThe coin has developed a promising "Triple Top Pattern" and is poised for a confirmed breakdown around the neckline area. Upon observing this breakdown, there is potential for considering a short position.

LINK/USDT - Chainlink: Falling Wedge◳◱ On the $LINK/ CRYPTOCAP:USDT chart, the Falling Wedge pattern suggests a pause in volatility, potentially gearing up for a breakout. Traders might observe resistance around 16.264 | 17.265 | 19.582 and support near 13.947 | 12.631 | 10.314. Entering trades at 15.259 could be strategic, aiming for the next resistance level.
◰◲ General info :
▣ Name: Chainlink
▣ Rank: 16
▣ Exchanges: Binance, Kucoin, Bybit, Huobipro, Gateio, Mexc
▣ Category/Sector: Services - Data Management
▣ Overview: Chainlink is a decentralized oracle network. It aims to serve as a middleware between smart contracts on smart contracting platforms and external data sources, allowing smart contracts to securely access off-chain data feeds.
◰◲ Technical Metrics :
▣ Mrkt Price: 15.259 ₮
▣ 24HVol: 75,890,616.439 ₮
▣ 24H Chng: -4.917%
▣ 7-Days Chng: -2.66%
▣ 1-Month Chng: 5.93%
▣ 3-Months Chng: 89.72%
◲◰ Pivot Points - Levels :
◥ Resistance: 16.264 | 17.265 | 19.582
◢ Support: 13.947 | 12.631 | 10.314
◱◳ Indicators recommendation :
▣ Oscillators: NEUTRAL
▣ Moving Averages: SELL
◰◲ Technical Indicators Summary : SELL
◲◰ Sharpe Ratios :
▣ Last 30D: 0.96
▣ Last 90D: 3.18
▣ Last 1-Y: 1.59
▣ Last 3-Y: 0.58
◲◰ Volatility :
▣ Last 30D: 0.85
▣ Last 90D: 0.93
▣ Last 1-Y: 0.75
▣ Last 3-Y: 1.09
◳◰ Market Sentiment Index :
▣ News sentiment score is 0.74 - Bullish
▣ Twitter sentiment score is 0.59 - Bullish
▣ Reddit sentiment score is 0.50 - Bullish
▣ In-depth LINKUSDT technical analysis on Tradingview TA page
▣ What do you think of this analysis? Share your insights and let's discuss in the comments below. Your like, follow and support would be greatly appreciated!
◲ Disclaimer
Please note that the information and publications provided are for informational purposes only and should not be construed as financial, investment, trading, or any other type of advice or recommendation. We encourage you to conduct your own research and consult with a qualified professional before making any financial decisions. The use of the information provided is solely at your own risk.
▣ Welcome to the home of charting big: TradingView
Benefit from a ton of financial analysis features, instruments and data. Have a look around, and if you do choose to go with an upgraded plan, you'll get up to $30.
Discover it here - affiliate link -

LINKUSDT Long PositionEverything Mentioned In The Chart
Use Proper Risk Management And Financial Advice

LINK - Gearing up for MASSIVE GainsHi Traders, Investors and Speculators of Charts📈📉
For a while now, LINK has been trading in a very clear accumulation phase. This is the zone we see after a bearish cycle and BEFORE a new bullish cycle.
Chainlink can be very "wicky", and often the price will go JUST UNDER/OVER the resistance zone, or JUST UNDER/OVER the support zone. This makes it hard to give precise entry points. Working within ranges and choosing the lower part of the range is the safest best to protect against those ugly wicks.
Here are some easy setups that guarantee profits during the next bullish cycle - but you will have to have packed-bags in order to bag-in on profits!
_______________________
📢Follow us here on TradingView for daily updates and trade ideas on crypto , stocks and commodities 💎Hit like & Follow 👍
We thank you for your support !
CryptoCheck
COINBASE:LINKUSD BINANCE:LINKUSDT

LINKUSDT at monthly resistanceLINKUSDT has hit the monthly resistance MR1 and the upward move has been blocked by the monthly resistance MR1. The price attempted this resistance a few weeks back and got rejected. However, it made another attempt last week only to result in being pushed down. The price is currently trading just below the monthly resistance. Once this resistance is cleared in coming days, the next target would be monthly resistance MR2 which is sitting around 27-30.6. Looking at the price action, it seems that the price will break this in coming days and head towards MR2.

LINK target 19.112h time frame
-
LINK is creating a triangle pattern, this might be a continuation structure for the pump from 10.5 to 16.6, which means LINK can reach higher price if break above this triangle pattern.
Also, LINK just retested 0.382 Fibonacci Projection and had support, enhancing the probability of continuation structure.
TP: 18.27~19.1
SL: 13.65

LINKUSDTTRADE ALERT! BIST:LINK
Ticker: LINK/USDT
Entry: $14.2-14.3
Take Profit: $15-16$
Stop Loss: $13.650 (Daily Close Below this)
Risk to Reward: 1:2
Technical: Link bull flag formation.
Price is retesting the trendline support.
If we see a jump in form of green candle.
We will see link moving upside.

Late but true...!If we consider the worst case for this currency, we can consider a position like this.
Although the possibility of such a fall for this currency is a bit far from expected, but if we assume the fall, then we can have an entry like this for this currency.

Nice breakout in Link, where we can enter?Hello Crypto Enthusiast,
LINK - CHAINLINK , a master in Oracle.
Facilitates secure communications between Ethereum projects and various off-chain data.
Holds 61% market share.
Technically, after a long term accumulation, it just broke out.
with that said, where we can buy again? I feel price will do a pullback to 8.5 to 9.5 zone before next rally or buy above the recent high at 11$
I would enter this in zone with a stoploss below the swing low around $7. Risk is 25% and target is 500%. Trade will run for a year or so to reach $50 , $100
Please DYOR before investing.
