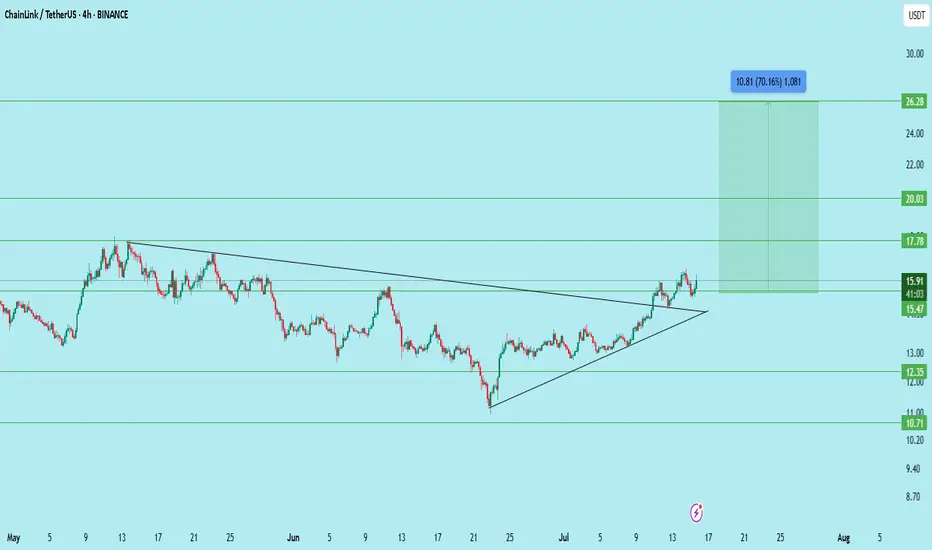
LINKUSDT – Breakout Retest | Ready for 70% Move?LINK has broken out of a long-term descending trendline on the 4H timeframe and retested the breakout zone. Price is holding well above the trendline and support levels, indicating strong momentum and a bullish structure.
Entry: 15.4–15.6
Support: 15.47
Resistance: 17.78
Targets: 17.78 / 20.03 / 26.28
Stoploss: Below 15.00
Structure: Triangle breakout
Potential: +70% upside if all targets are achieved
LINK is looking primed for a strong breakout continuation. Keep it on your radar.
DYOR | Not financial advice
Linkusdtrading
#LINKUSDT: Distribution Phase Has Started! Will It Hit $45? The accumulation phase has just ended, and the distribution phase has just begun. Our current concern is whether the bullish volume holds on and the trend continues to remain bullish. Please do your own research before blindly following the analysis, as this is just our bias and does not guarantee that the price will exactly follow the chart.
Thank you for your support throughout. We wish you the best!
Team Setupsfx_

LINKUSD: Expected to give +100% return.Chainlink has turned overbought on its 1D technical outlook (RSI = 70.291, MACD = 0.870, ADX = 19.937) and has validated the start of the new bullish wave of the Channel Up as it crossed above both the 1W MA200 and MA50. Both prior bullish waves rose by nearly +300%, the most recent by +275%. Technically it can repeat at least that and double in price (TP = 35.00) before the wave peaks at the top of the Channel Up.
## If you like our free content follow our profile to get more daily ideas. ##
## Comments and likes are greatly appreciated. ##

LINKUSD: forming a bottom on the 1W MA100.Chainlink is neutral on its 1D technical outlook (RSI = 47.039, MACD = -1.130, ADX = 24.859) as it posted a double rebound on its 1W MA100. The long term pattern is a Channel Up and its prior HL bottom was formed just under the 1W MA100. With the 1W RSI rebounding though from oversold levels, LINK is already a great buy opportunity in terms of Risk-Reward, even if the bottom takes the whole month of March to be completed. We expect a new bullish wave to take place around the same +300% range as the previous two. The trade is long, TP = 45.00.
## If you like our free content follow our profile to get more daily ideas. ##
## Comments and likes are greatly appreciated. ##

LINK - staart bull trend price made false break out a range
big news to come
-instrument formulated range of 406 days
if you like the idea, please "Like" it. This is the best "Thanks!" for the author 😊 P.S. Always do your own analysis before a trade. Put a stop loss. Fix profits in installments. Withdraw profits in fiat and please yourself and your friends.


LINK/USD "Chainlink vs US Dollar" Crypto Market Heist Plan🌟Hi! Hola! Ola! Bonjour! Hallo!🌟
Dear Money Makers & Robbers, 🤑💰🐱👤
Based on 🔥Thief Trading style technical and fundamental analysis🔥, here is our master plan to heist the LINK/USD "Chainlink vs US Dollar" Crypto market. Please adhere to the strategy I've outlined in the chart, which emphasizes long entry and short entry. 🏆💸Be wealthy and safe trade.💪🏆🎉
Entry 📈 :
"The loot's within reach! Wait for the breakout, then grab your share - whether you're a Bullish thief or a Bearish bandit!"
Buy entry - above 20.000 in Pullback
Sell Entry - can take in any price level
Stop Loss 🛑:
Thief SL placed at 18.000 (swing Trade Basis) for Bullish Trade
Thief SL placed at 20.000 (swing Trade Basis) for Bearish Trade
📌SL is based on your risk of the trade, lot size and how many multiple orders you have to take.
Target 🎯:
-Bullish Thieves TP 28.000 (or) Escape Before the Target
-Bearish Bandit TP 14.000 (or) Escape Before the Target
📰🗞️Fundamental, Macro, COT, Sentimental Outlook:
LINK/USD "Chainlink vs US Dollar" Crypto market is currently experiencing a Bearish trend in short term period (but there is a higher chance for Bullish)., driven by several key factors.
🔱 Fundamental Analysis:
The fundamentals of Chainlink (LINK) are strong, with a growing ecosystem and increasing adoption of its oracle services. This has led to an increase in demand for the token, which could drive up prices in the long term.
🔱 Macro Economics Analysis:
The current macroeconomic environment is favorable for cryptocurrencies, with low interest rates and high inflation. This could lead to an increase in demand for cryptocurrencies like LINK, driving up prices.
🔱 COT Report Analysis:
Unfortunately, I couldn't find the latest COT report for LINK/USD. However, based on historical data, commercial traders have been increasing their long positions in LINK, indicating a bullish sentiment.
🔱 Sentimental Analysis:
The market sentiment for LINK/USD is currently bullish, with 70% of investors expecting the price to increase in the next week. Social media sentiment is also bullish, with 65% of tweets and posts expressing a positive sentiment towards Chainlink.
🔱 Fear and Greed Index:
The fear and greed index for LINK/USD is currently at 60, indicating a greedy sentiment. This suggests that investors are optimistic about the future price of LINK.
🔱 Overall Outlook:
Based on the analysis, the overall outlook for LINK/USD is bullish, with a potential price increase of 10% in the next week. However, the market is subject to volatility, and investors should exercise caution when making investment decisions.
🔱 Positioning:
Institutional investors are increasing their long positions in LINK, indicating a bullish sentiment. Retail traders are also optimistic about LINK, with 75% expecting the price to increase in the next week.
🔱 Upcoming Future:
The future outlook for LINK/USD is bullish, with a potential price increase of 20% in the next month. The growing adoption of Chainlink's oracle services and the increasing demand for cryptocurrencies could drive up prices in the long term.
⚠️Trading Alert : News Releases and Position Management 📰 🗞️ 🚫🚏
As a reminder, news releases can have a significant impact on market prices and volatility. To minimize potential losses and protect your running positions,
we recommend the following:
Avoid taking new trades during news releases
Use trailing stop-loss orders to protect your running positions and lock in profits
📌Please note that this is a general analysis and not personalized investment advice. It's essential to consider your own risk tolerance and market analysis before making any investment decisions.
📌Keep in mind that these factors can change rapidly, and it's essential to stay up-to-date with market developments and adjust your analysis accordingly.
💖Supporting our robbery plan will enable us to effortlessly make and steal money 💰💵 Tell your friends, Colleagues and family to follow, like, and share. Boost the strength of our robbery team. Every day in this market make money with ease by using the Thief Trading Style.🏆💪🤝❤️🎉🚀
I'll see you soon with another heist plan, so stay tuned 🤑🐱👤🤗🤩

LINKUSD: One more drop is possible on this Channel Down.Chainlink is neutral on its 1D technical outlook (RSI = 47.590, MACD = 0.090, ADX = 17.477), trading around its 1D MA50 but on a technical bearish wave of the December Channel Down. This pattern draws many comparisons with the one in June-July 2024, having so far identical RSI fractals. This suggests that the current rejection can test the 1D MA200 at the bottom of the Channel Down. Our target is a bit higher though (TP = 18.000) due to the presence of the S1 level.
## If you like our free content follow our profile to get more daily ideas. ##
## Comments and likes are greatly appreciated. ##

LINKUSDT Breakout Alert: Bullish Momentum Above 50 EMA!BINANCE:LINKUSDT Breakout Alert: Bullish Momentum Above 50 EMA!
After multiple tests of the support zone, BINANCE:LINKUSDT has finally bounced off and broken out of its descending trendline, signaling a potential strong uptrend. With the price now holding above the 50 EMA, bullish momentum is evident, and the market may be gearing up for a significant move higher. Traders should consider entering on a pullback while targeting key resistance levels. As always, proper risk management is crucial—set your stop-loss below the support zone and align your position size with your risk tolerance to stay on the safe side.
BINANCE:LINKUSDT Currently trading at $22.5
Buy level: Above $22
Stop loss: Below $19
Target : $40
Max Leverage 3x
Always keep Stop loss
Follow Our Tradingview Account for More Technical Analysis Updates, | Like, Share and Comment Your thoughts

LINKUSDT 1WLINK Update ~ 1W
#LINK So far it continues to maintain its bullish structure. This is wave 2 if we use the Eliot Wave pattern. Buy in stages with a target of at least 20%+ from here.

LINKUSD "CHAINLINK" Crypto Market Heist Plan on Bearish Side🌟Hi! Hola! Ola! Bonjour! Hallo!🌟
Dear Money Makers & Robbers, 🤑 💰
Based on 🔥Thief Trading style technical analysis🔥, here is our master plan to heist the LINKUSD "CHAINLINK" Crypto market. Please adhere to the strategy I've outlined in the chart, which emphasizes short entry. Our aim is the high-risk Green Zone. Risky level, oversold market, consolidation, trend reversal, trap at the level where traders and bullish robbers are stronger. 👀 So Be Careful, wealthy and safe trade.💪🏆🎉
Entry 📉 : You can enter a Short trade at any point,
however I advise placing sell limit orders within a 15 or 30 minute timeframe. Entry from the most recent or closest high level should be in retreat.
Stop Loss 🛑: Using the 4H period, the recent / nearest high level.
Goal 🎯: 16.000
Scalpers, take note : only scalp on the Short side. If you have a lot of money, you can go straight away; if not, you can join swing traders and carry out the robbery plan. Use trailing SL to safeguard your money 💰.
Warning⚠️ : Our heist strategy is incompatible with Fundamental Analysis news 📰 🗞️. We'll wreck our plan by smashing the Stop Loss 🚫🚏. Avoid entering the market right after the news release.
Take advantage of the target and get away 🎯 Swing Traders Please reserve the half amount of money and watch for the next dynamic level or order block breakout. Once it is resolved, we can go on to the next new target in our heist plan.
💖Supporting our robbery plan will enable us to effortlessly make and steal money 💰💵 Tell your friends, Colleagues and family to follow, like, and share. Boost the strength of our robbery team. Every day in this market make money with ease by using the Thief Trading Style.🏆💪🤝❤️🎉🚀
I'll see you soon with another heist plan, so stay tuned 🫂

$LINKUSDT: Breakout Alert!BINANCE:LINKUSDT is currently forming a symmetrical triangle pattern on the chart, indicating a potential breakout. After an extended consolidation phase, the price action suggests that LINK may be on the verge of a significant move. Traders should monitor key resistance and support levels as the price approaches the apex of the triangle. A confirmed breakout above resistance could signal a strong upward trend, particularly if it is accompanied by increased volume.
This setup presents an exciting opportunity for traders, as a decisive break could ignite a substantial upward movement. With the potential for a powerful rally after a lengthy period of consolidation, now is the time to stay alert for breakout signals. Always conduct your own research and consider your risk tolerance before making trading decisions.
BINANCE:LINKUSDT Currently trading at $12
Buy level: Above $12
Stop loss: Below $10.5
TP1: $13
TP2: $15
TP3: $19
TP4: $22
Max Leverage 3x
Follow Our Tradingview Account for More Technical Analysis Updates, | Like, Share and Comment Your thoughts

#LINK/USDT#LINK
The price is moving within a descending channel pattern on the 4-hour frame and is expected to break upwards after it has adhered to it to a large extent
We have a downtrend on the RSI indicator that is expected to break upwards and we have a trend to stabilize above it
We have a major support level in green at a price of 8
We have a trend to stabilize above the moving average 100, which supports the rise
Entry price 9.40
First target 11.32
Second target 12.63
Third target 13.86


LINK target 7.912h time frame
-
LINK just broke the rising flag/wedge recently, this is a sign of turning weak. Retesting the flag bottom will be an entry to open short in future. Low-risk method is to find the top structure in lower time frame if LINK go to retest the flag. With this trading plan, we can have target at structural support around 7.9, deeper is 5.8.
-
TP: 7.9 / 5.8
SL: 16.25


LINKUSD: Two buy entries for a 28.850 target.Chainlink is bear the 1D MA50, a support level that has been intact since September 18th (almost three months). Despite the strong pullback, the 1D technical outlook is only neutral (RSI = 46.740, MACD = 0.490, ADX = 23.241), suggesting that the trend remains bullish and rightfully so as the pattern since the September lows is a Channel Up. That emerged after the longer than 1 year accumulation phase ended.
There is an interesting symmetry so far with the Channel Down (March-May 2022) that led to that accumulation and if it holds, then we might see the 1D MA50 break and the price entering the Symmetric S1 Zone. That will be our 2nd and final long entry. In both cases, we are targeting the R2 level (TP = 28.8500).
See how our prior idea has worked:
## If you like our free content follow our profile to get more daily ideas. ##
## Comments and likes are greatly appreciated. ##

LINK target 19.112h time frame
-
LINK is creating a triangle pattern, this might be a continuation structure for the pump from 10.5 to 16.6, which means LINK can reach higher price if break above this triangle pattern.
Also, LINK just retested 0.382 Fibonacci Projection and had support, enhancing the probability of continuation structure.
TP: 18.27~19.1
SL: 13.65

LINK bottom 51h / 1D time frame
-
On the left chart, LINK get rejection from the resistance zone(10.7~12.3), and I think there is a possibility to create a Head and Shoulders structure.
On the right chart, top 9.45 and bottom 5.45 are a box range. LINK has already broke above the top resistance at 9.45 and start consolidating. This is might be a liquidation hunting, once LINK go below 9.45 again, a fake breakout will be confirmed.
TP: 5.5
SL: 11.9

LINK bottom 0.4~5.712h time frame
-
On the basis of our BTC analysis, market need a dump to correct price and liquidate long as much as possible before bull. Also, we can see LINK has strong trend recently, it broke above that box range and goes into the resistance zone from 10.7~12.2, which is good to set short trading plan. Target is 0.4~5.7, this is also the sweet price to buy spot.

LINKUSD: Strongest day of the year testing the Channel's top.LINKUSD is having the strongest 1D candle of the year, turning the 1D time-frame technically overbought (RSI = 73.130, MACD = 0.370, ADX = 25.207). This rise may have taken the price above both the 1D MA50 and 1D MA200 but just hit the top of the 8 month Channel Down. Technically that is a sell signal, targeting the bottom of the High Variance Belt (TP = 7.000).
If the price crosses above the top of the Channel Down and invalidates it, we won't go long just yet, but rather wait for R1 (8.8000) to break and then buy aiming at R2 (TP = 9.65000).
A weekly closing over the R2, justifies a long term hold position on LINK.
## If you like our free content follow our profile to get more daily ideas. ##
## Comments and likes are greatly appreciated. ##
