Smart Robbery Plan: LINK/USDT Long Setup | Swing/Day Trade Idea🚨CHAINLINK HEIST PLAN 🚨 | LINK/USDT Market Robbery (Thief Trader Style) 💰🔐
🌍 Hola! Bonjour! Hallo! Marhaba! What’s up, Money Makers & Market Robbers?! 🕶️💵
Get ready to raid the LINK/USDT vault with Thief Trader’s high-precision strategy based on 🔥 Technical & Fundamental fusion 🔥.
This is not your regular setup. This is a robbery roadmap. Designed for swing & day traders, and spiced with smart DCA entries, risk control, and a bold vision. Let's get into the game plan before the market alarms go off! 🚓📉📈
🎯 Master Plan – LINK/USDT | Bullish Setup
Entry:
📌 “The vault is open – grab the loot!”
Start entering long anywhere within the nearest price pullback zone. Use 15m to 30m TFs for sniper-style limit entries.
🛠️ Deploy DCA-style multiple limit orders (layered strategy), preferably around recent swing lows or major liquidity zones.
Stop Loss:
🔐 Place SL just below the 4H swing low wick (Currently at $16.50), adjusting for your risk, lot size, and how many limit orders you're stacking.
Take Profit:
🎯 Main TP target: $21.50
⛔ Or bail early if momentum weakens. Your profit, your decision.
⚡️Scalper’s Memo:
Only scalp on the bullish side – stay with the smart money.
Have deep pockets? Jump in now.
On a budget? Join swing traders and follow the full heist plan.
📉 Use trailing SL to secure profits during volatile rallies.
🔍 Fundamental & Sentiment Snapshot:
LINK is gaining bullish traction due to a combo of strong sentiment, favorable macro outlook, and on-chain flows aligning.
📊 Keep eyes on COT reports, intermarket data, and liquidity metrics.
🧠 Sentiment leans bullish while late bears are trapped in the supply zones above.
🛑 Risk & News Management Alert:
🚨 News releases can spike volatility and mess with clean entries.
📵 Avoid placing trades during high-impact events.
📍 Use trailing stop-loss to protect your running profits and preserve capital.
💖Support the Plan, Join the Heist:
Love the trade idea? 💥Hit the BOOST💥 button and show some love to the strategy that lets traders "rob the market" with confidence.
Every like helps build the strongest heist crew on TradingView.
✅ Stay sharp. Stay patient. Stay profitable.
👤 Thief Trader signing out… until the next raid. 🐱👤💰🚀
#LINK #LINKUSDT #CryptoTrading #ThiefTrader #SwingTrade #DayTrade #DCA #BullishSetup #TradingPlan #TA #RobTheMarket #ChainlinkHeist #SmartMoneyMoves
Linkusdtsignal

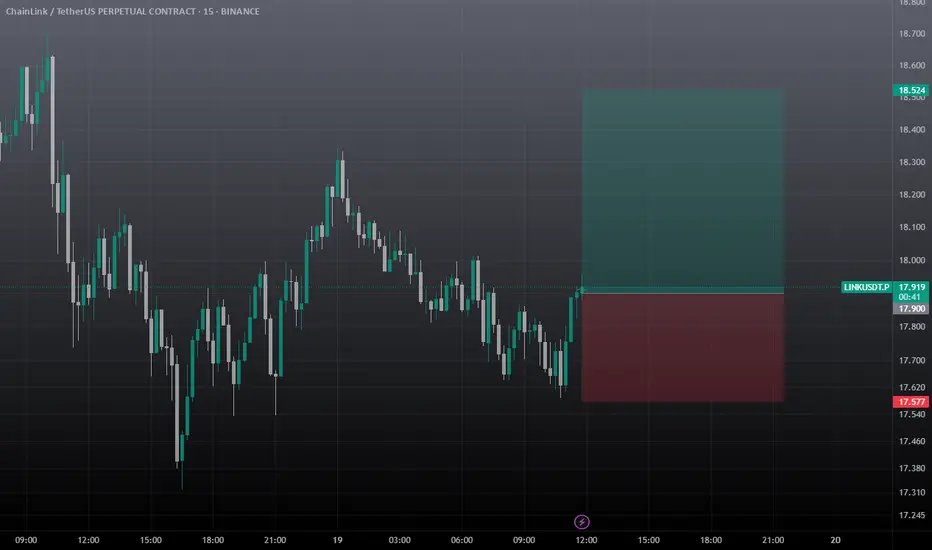
Link Scalp Trade IDEA / Long Scalp Setuplink looking to take out 18.5 area. can take at cmp 17.91, must use sl, it's a scalp trade so don't hold it for long time.
#LINKUSDT: Distribution Phase Has Started! Will It Hit $45? The accumulation phase has just ended, and the distribution phase has just begun. Our current concern is whether the bullish volume holds on and the trend continues to remain bullish. Please do your own research before blindly following the analysis, as this is just our bias and does not guarantee that the price will exactly follow the chart.
Thank you for your support throughout. We wish you the best!
Team Setupsfx_

LINK/USDT Chainlink Gearing Up for a Major Breakout?
🧠 Overview:
The LINK/USDT chart is showcasing a high-conviction technical setup — a well-defined Descending Triangle that has been forming for over 6 months. This pattern often acts as a pressure-cooker scenario, building up momentum before a major breakout.
The triangle is composed of consistent lower highs pressing against a strong horizontal support zone at $12.5 – $13.2, which has been tested and held multiple times since February 2025.
Currently, the price is approaching the apex of the triangle, signaling that a breakout is likely imminent.
📐 Pattern Details – Descending Triangle:
🔻 Descending Resistance Line: Connecting lower highs since the January 2025 peak.
🟨 Flat Support Zone: The $12.5 – $13.2 level has served as a strong demand zone.
⏳ Apex Nearing: Price action is compressing, and breakout pressure is building.
📉 Decreasing Volume: Volume is drying up — a classic precursor to a breakout move.
✅ Bullish Scenario (Breakout):
If LINK breaks above the descending trendline and reclaims resistance around $14.00 – $15.44, the chart could ignite a strong upside move.
🚀 Bullish Targets:
1. $15.44 (first key resistance & breakout validation)
2. $17.44 (prior structure resistance)
3. $19.38 (swing high from Q1)
4. $26.58 (major resistance zone)
5. $28.00 – $29.35 (long-term upside target)
📌 Breakout Confirmation: Look for high volume and a successful retest of the breakout level to confirm bullish momentum.
❌ Bearish Scenario (Breakdown):
If LINK fails to hold the $12.5 – $13.2 support zone and breaks below it with strong volume, downside risks increase significantly.
⚠️ Bearish Targets:
$11.00 (minor support)
$9.50 (next demand zone)
$8.00 (macro support from 2023)
A breakdown from this triangle would invalidate the bullish setup and could trigger a broader bearish continuation.
🧩 Conclusion & Strategy:
📊 Pattern: Descending Triangle
🕰️ Formation Duration: 6+ months (strong reliability)
🟨 Critical Zone: $12.5 – $13.2 = Key Support
📍 Breakout Trigger: Above $15.4
🔍 Breakdown Trigger: Below $12.5
📌 Trading Ideas:
🔼 Long Position: Upon breakout above $15.4 with confirmation
🔽 Short Position: Upon breakdown below $12.5 with increased volume
📚 Bonus Insight:
Chainlink remains one of the most widely adopted oracle solutions in DeFi and enterprise blockchain. A technical breakout from a long-term consolidation like this could attract both retail and institutional capital.
#LINKUSDT #Chainlink #CryptoBreakout #DescendingTriangle #Altseason #TechnicalAnalysis #BullishSetup #CryptoSignals #TradingView #AltcoinSetups

LinkEntry price yellow line
Stop loss update from red line to yellow line
We hit first Take profit
I Close full now


link updateentry price 15.48
stop loss 15.48
take profit
11.9
10.95
we hit first and second take profit

LINKUSDT 1D AnalysisLINK ~ 1D Analysis
#LINK Buy in stages from here with a short term target of at least 10%+ and a long term target of $31

LINKUSDT 1D Analysis LINK ~ 1D Analysis
#LINK Successfully retested this support block. This would be a very good buy for now, with a short term target of at least 10%+.


LINKUSDT 1WLINK ~ 1W Analysis
#LINK Buy gradually from here if you still have a Conviction on this coin with a short -term target of at least 20%+.

LINKUSDT 1WLINK ~ 1W Analysis
#LINK If you still have a Conviction on this Coin, Maybe this support you can consider to start buying again, a minimum target of 20%+.

LINKUSDT 1WLINK Update ~ 1W
#LINK So far it continues to maintain its bullish structure. This is wave 2 if we use the Eliot Wave pattern. Buy in stages with a target of at least 20%+ from here.

LINKUSD "CHAINLINK" Crypto Market Heist Plan on Bearish Side🌟Hi! Hola! Ola! Bonjour! Hallo!🌟
Dear Money Makers & Robbers, 🤑 💰
Based on 🔥Thief Trading style technical analysis🔥, here is our master plan to heist the LINKUSD "CHAINLINK" Crypto market. Please adhere to the strategy I've outlined in the chart, which emphasizes short entry. Our aim is the high-risk Green Zone. Risky level, oversold market, consolidation, trend reversal, trap at the level where traders and bullish robbers are stronger. 👀 So Be Careful, wealthy and safe trade.💪🏆🎉
Entry 📉 : You can enter a Short trade at any point,
however I advise placing sell limit orders within a 15 or 30 minute timeframe. Entry from the most recent or closest high level should be in retreat.
Stop Loss 🛑: Using the 4H period, the recent / nearest high level.
Goal 🎯: 16.000
Scalpers, take note : only scalp on the Short side. If you have a lot of money, you can go straight away; if not, you can join swing traders and carry out the robbery plan. Use trailing SL to safeguard your money 💰.
Warning⚠️ : Our heist strategy is incompatible with Fundamental Analysis news 📰 🗞️. We'll wreck our plan by smashing the Stop Loss 🚫🚏. Avoid entering the market right after the news release.
Take advantage of the target and get away 🎯 Swing Traders Please reserve the half amount of money and watch for the next dynamic level or order block breakout. Once it is resolved, we can go on to the next new target in our heist plan.
💖Supporting our robbery plan will enable us to effortlessly make and steal money 💰💵 Tell your friends, Colleagues and family to follow, like, and share. Boost the strength of our robbery team. Every day in this market make money with ease by using the Thief Trading Style.🏆💪🤝❤️🎉🚀
I'll see you soon with another heist plan, so stay tuned 🫂

LINKUSDTLINK ~ 1W ✅
#LINK Make purchases gradually in this pattern. it is only a matter of time until this pattern is broken out and the bulls will return quickly.

LNK/USD: who's watching this movie on chartChainkLink is bullish from the Weekly TF. taking a short Buy entry wouldn't.
although swing trader can hold. idk

LINKUSDT Elliott Waves AnalysisHello friends.
Please support my work by clicking the LIKE button👍(If you liked). Also i will appreciate for ur activity. Thank you!
Everything on the chart.
The impulse have been completed, im waiting for correction and continuation of growth.
Entry zone: 13 - 10$
Good luck everyone!
Follow me on TRADINGView, if you don't want to miss my next analysis or signals.
It's not financial advice.
DYOR!

LINK/USDT Looking BullishTRADE ALERT!LINK
Ticker: LINK/USDT
Entry: 17.5$ - 18.45$
Take Profit: 21-23$
Stop Loss: 16$
Risk to reward: 1:2
Technical Thesis: Link breaked the support of one day also took the retest and start pumping, we can expect a good Movement toward a the Next support

LINKUSDTBINANCE:LINKUSDT Short idea
⛔"Daily crypto market analyses I provide are personal opinions & not financial advice. Trading carries risks, so do your own research & seek advisor's help. #DYOR
Don't forget to 🚀 and comment

LINK target 7.912h time frame
-
LINK just broke the rising flag/wedge recently, this is a sign of turning weak. Retesting the flag bottom will be an entry to open short in future. Low-risk method is to find the top structure in lower time frame if LINK go to retest the flag. With this trading plan, we can have target at structural support around 7.9, deeper is 5.8.
-
TP: 7.9 / 5.8
SL: 16.25

LINK/USDT Tripple Top Pattern , Looking BearishThe coin has developed a promising "Triple Top Pattern" and is poised for a confirmed breakdown around the neckline area. Upon observing this breakdown, there is potential for considering a short position.

LINK target 19.112h time frame
-
LINK is creating a triangle pattern, this might be a continuation structure for the pump from 10.5 to 16.6, which means LINK can reach higher price if break above this triangle pattern.
Also, LINK just retested 0.382 Fibonacci Projection and had support, enhancing the probability of continuation structure.
TP: 18.27~19.1
SL: 13.65

LINK bottom 51h / 1D time frame
-
On the left chart, LINK get rejection from the resistance zone(10.7~12.3), and I think there is a possibility to create a Head and Shoulders structure.
On the right chart, top 9.45 and bottom 5.45 are a box range. LINK has already broke above the top resistance at 9.45 and start consolidating. This is might be a liquidation hunting, once LINK go below 9.45 again, a fake breakout will be confirmed.
TP: 5.5
SL: 11.9
