GJ| Bullish Outlook | IDM + SSL Sweep - OB Reaction(Refined & Structured):
• Pair: GBPJPY
• Bias: Bullish
• 4H Overview: Price broke major highs with bullish structure still intact. After pulling back into discounted territory, I dropped to mid timeframes to anticipate continuation.
• 30M Structure: Price took out sell-side liquidity and IDM, then mitigated a clean internal order block. Structure is refined and showing signs of smart money activity.
• Entry Zone: Watching LTFs for a clean change of character off fresh demand zones.
• Targets: 5M and 30M structural highs depending on delivery.
• Mindset Note: Patience wins here. When structure and liquidity align this clean, all that’s left is letting LTF confirm it. No need to chase—let the setup speak first.
Liquidity

EURUSD Bearish Market Structure Unfolding – Liquidity Grab BelowEURUSD Bearish Market Structure Unfolding – Liquidity Grab Below Support Expected"
🔍 Technical Analysis Breakdown:
🔺 Resistance Zone (1.17500 - 1.18500)
Labelled “Strong High”, this is a high-supply zone where price previously reversed.
Multiple Break of Structure (BOS) and Change of Character (CHoCH) confirm this as a strong bearish supply area.
Any retracement toward this level could be ideal for short entries.
🟩 Fair Value Gap (FVG)
This imbalance area previously served as a magnet for price before it broke down.
Price failed to hold inside the FVG, reinforcing bearish sentiment.
🔻 Support Zone (1.13500 - 1.14000)
Marked as a "Weak Low", suggesting this level is likely to be taken out in a liquidity sweep.
Price is expected to retest and potentially break below this zone in the near term.
📉 Current Price Action
Recent CHoCH (Bearish) confirms shift in structure.
Price has made a corrective pullback and seems poised for another leg down.
Highlighted grey zone suggests price may retrace slightly higher before continuing its bearish move.
🎯 Bias: Bearish
Expecting downside continuation toward 1.13500 support, targeting liquidity below.
Traders may wait for rejection signals on lower timeframes around the minor pullback zone before executing shorts.
📚 Educational Notes:
CHoCH indicates a shift in market sentiment (from bullish to bearish).
FVG often acts as a magnet but if not respected, confirms momentum in the opposite direction.
Support/Resistance zones are used to determine institutional activity zones.

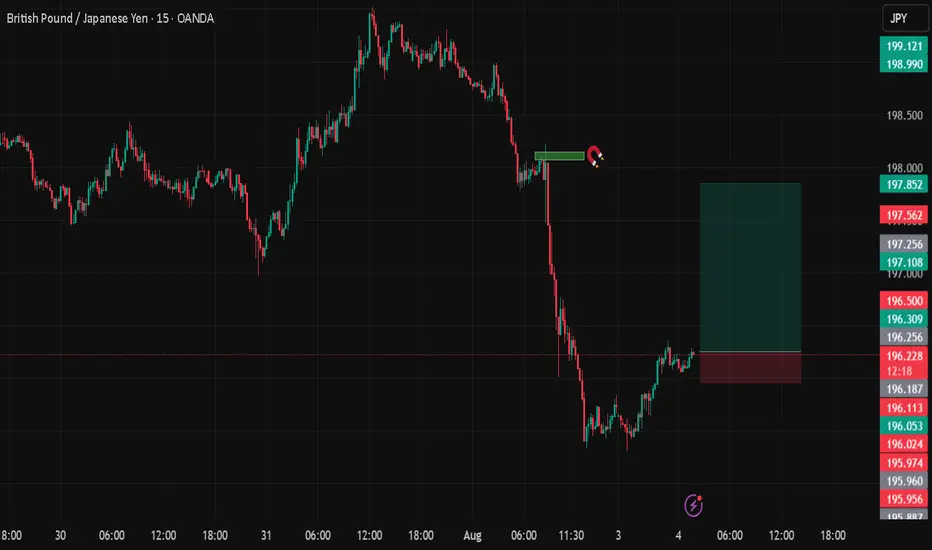
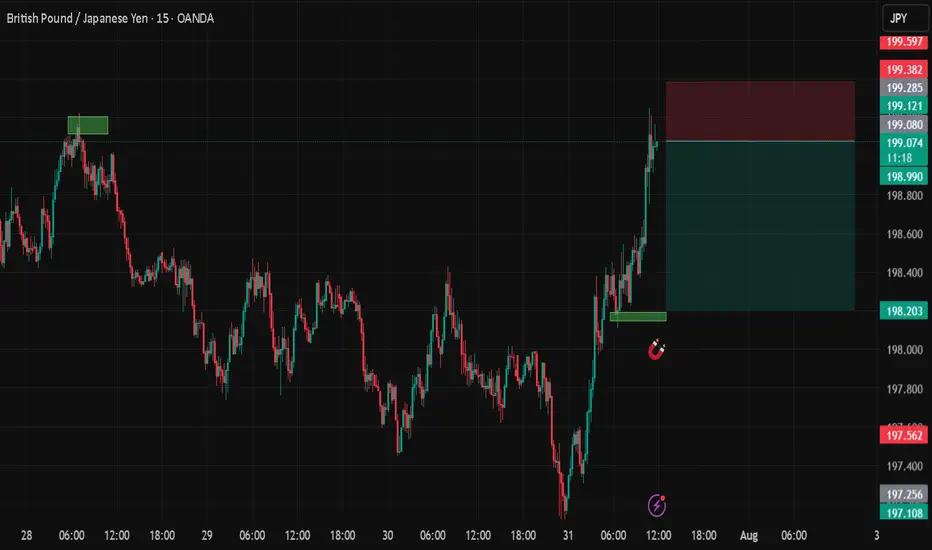
GBPJPYDate:
August 3,2025
Session:
Tokyo Session
Pair:
GBPJPY
Bias:
Long
Fridays New York open left a liquidity pool. I see todays Asia or London session sweeping that area.
Entry:196.254
Stop Loss:195.957
Target:197.847
RR:5.32
EU|Bullish Structure Holding| 4H OB + Inducement Sweep Lining Up(Refined & Structured):
• Pair: EURUSD
• Bias: Bullish
• 4H Overview: Clean bullish structure is intact with bullish intent already shown. After breaking a recent high, price swept sell-side liquidity and inducement, tapping directly into a 4H order block.
• 30M Structure: Watching for a clear change of character—specifically a break of a 30M lower high. Once that happens and price sweeps internal liquidity into the 30M OB, I’ll begin hunting confirmation.
• Entry Zone: After internal OB mitigation, I’ll drop to the 5M for a strong church-level confirmation. Execution follows once the story completes.
• Targets: 5M to 30M highs depending on delivery.
• Mindset Note: Right now it’s analysis mode. Structure is unfolding beautifully. Patience, precision, and price reading—this is where the game’s won.

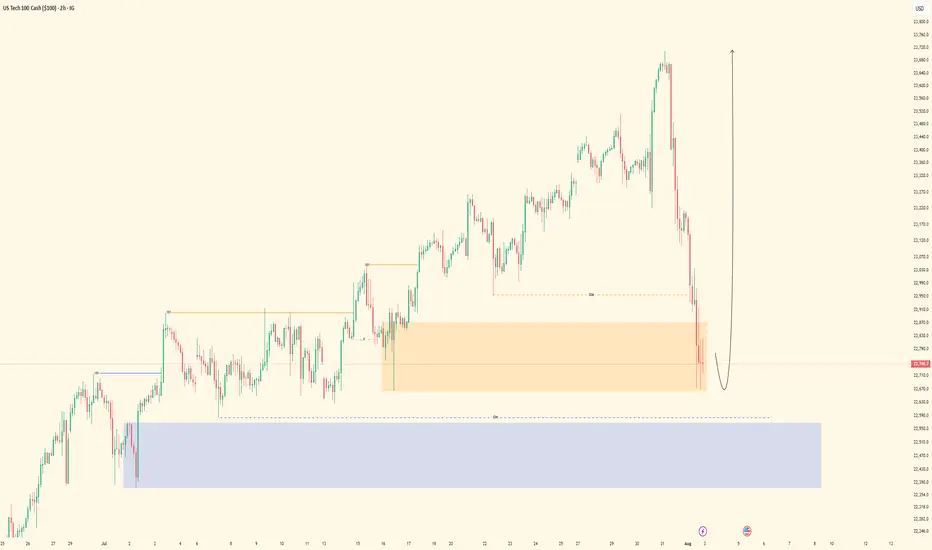
Nasdaq| Bullish Intent Maintained| Refined OB Reaction In Motion(Refined & Structured):
• Pair: Nasdaq (US100)
• Bias: Bullish / Buy
• 4H Overview: Bullish structure remains intact. Despite the congestion and noise, price maintained its upward trajectory. I refined the drop to mid timeframes for precision and clarity.
• 30M Structure: Refined bullish structure with clear intent. Price has mitigated a clean OB, setting the stage for further continuation.
• Entry Zone: Watching lower timeframes for confirmation to ride the wave higher.
• Targets: 5M to 30M structural highs depending on how price delivers.
• Mindset Note: Noise is just noise until structure filters it out. Precision comes from refining—this setup proves that. Stay focused, stay clean, let intent guide you.
GOLD | Bullish Mitigation + Inducement Lining Up For Execution(Refined & Structured):
• Pair: XAUUSD (Gold)
• Bias: Bullish
• 4H Overview: Gold broke last week’s previous high, then pulled back and mitigated this week’s order block within the same range. A significant internal high (turnover HH) has now been broken, and price retraced to sweep liquidity and tap into the OB zone.
• 30M Structure: Now watching for a clean pullback into a refined OB after taking out sell-side liquidity/inducement. Structure is aligning perfectly for the next leg up.
• Entry Zone: Once price enters the OB zone, I’ll be watching the 5M for church-level confirmation. Execution follows once LTF speaks clearly.
• Targets: 5M to 30M structural highs depending on delivery.
• Mindset Note: I’m not rushing. Just following structure and reading price. Analysis mode right now—execution comes once price gives the sermon.

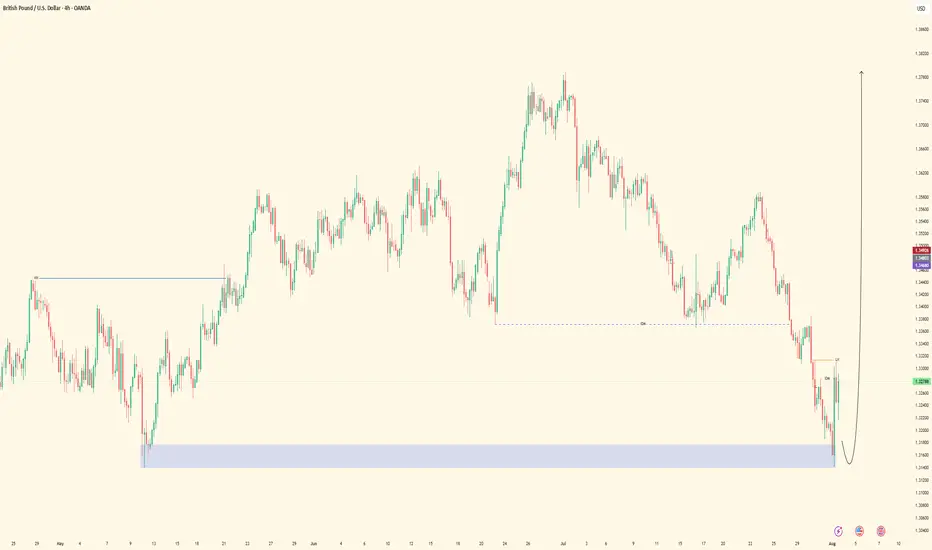
GU| Bullish Structure | Waiting for 30M CHoCH + OB Mitigation(Refined & Structured):
• Pair: GBPUSD
• Bias: Bullish
• 4H Overview: Bullish structure is given with strong intent. A major higher high was broken to the upside. Price swept significant sell-side liquidity and inducement, then mitigated a refined 4H OB with a clean smart money reaction—clear buyer interest.
• 30M Structure: Currently watching for a proper change of character (CHoCH). Still in analysis mode. Waiting for the lower high on the 30M to be breached and liquidity taken before considering execution.
• Entry Zone: Once price confirms with a CHoCH and mitigates the 30M internal OB, I’ll drop to the 5M to hunt for final confirmation before executing.
• Targets: 5M to 30M structural highs depending on price delivery.
• Mindset Note: The best setups come to those who wait. No rush. Let price do the talking. My trigger isn’t just structure—it’s precision and patience working together.
BTC Hits Premium Zone – Bearish Reversal Loading? BTC Hits Premium Zone – Bearish Reversal Loading?
🧠 Technical Breakdown:
🔹 1. Previous Market Structure & CHoCH
The chart shows a clear shift in structure (CHoCH) on the left, which marked the start of the bearish leg.
Break of Structure (BOS) confirms continuation of lower highs and lower lows until recent liquidity grab near the $112,551 zone.
Equal highs and liquidity above were taken out, making the move into the Premium Order Block zone highly significant.
🔹 2. Liquidity and Fair Value Gap (FVG) Zones
A major Liquidity + FVG zone was left unmitigated between $113,000–$112,000, and price is likely to revisit it.
This aligns with the target zone at $112,890, which is highlighted as a magnet for price to rebalance the inefficiency.
🔹 3. Order Block & Premium Supply Zone
A well-defined Order Block is marked just below the resistance zone near $115,166–$116,021.
Price is currently retracing into this zone, suggesting a potential reaction point for smart money to re-enter shorts.
Volume is expected to pick up here, and a reversal could initiate if price fails to break above this supply.
🔹 4. Volume Profile and Market Imbalance
Volume clusters are heaviest near the $114,000–$114,300 range, indicating high activity and previous accumulation/distribution.
Thin volume near the $112,551 zone further confirms price may drop quickly if rejection happens.
🔹 5. Support & Liquidity Sweep
Support zone around $112,551 is a previous liquidity pool and weak low that has not been fully cleared.
Price is likely to revisit this zone in the short term to clear liquidity and complete market rebalancing.
🔐 Institutional Narrative:
Smart money engineered a liquidity sweep to the downside, then caused a retracement into premium.
Now, BTC/USD is positioned in a high-risk zone where sell-side institutions may enter to push price lower.
If this order block holds, expect a rejection toward $112,890, followed by possible deeper continuation into the liquidity void below.
📌 Key Levels:
Level Price (USD)
Strong Resistance Zone 115,166 – 116,021
Order Block (Sell Area) 114,800 – 116,000 (approx.)
Immediate Support 113,000 – 112,551
Target (Liquidity Zone) 112,890
Weak Low (Final Sweep) 112,000
📉 Trade Outlook & Strategy:
🔺 If price reacts bearishly at Order Block:
Look for lower timeframe BOS/CHoCH confirmation.
Entry: Short on rejection at or near $115,000–$115,500
Target 1: $112,890
Target 2: $112,000 (extended liquidity sweep)
Stop-loss: Above $116,200 (invalidates bearish OB)
🔻 If price breaks and closes above $116,021 with momentum:
Structure flips bullish, and the OB is invalidated.
Look for long setups on retracement to $114,000 zone.
🧭 Conclusion:
BTC/USD is currently trading within a Premium Zone, testing a strong Order Block below key resistance. Price may face a bearish reaction, targeting the liquidity zone at $112,890. Smart money footprints suggest a potential trap for breakout buyers, and if momentum fades, we can expect a downside reversal to sweep remaining liquidity.

UJ| Bullsih Bias | Professional Sweep Forming Off 30M OB (Refined & Structured):
• Pair: USDJPY
• Bias: Bullish
• 4H Overview: After breaking previous highs, price pulled back into a sell-side liquidity (SSL) zone. This move shows signs of exhaustion following the sweep, hinting at bullish continuation.
• 30M Structure: Price took out internal liquidity/SSL and is now reacting from a refined 30-minute order block. Looks like a professional sweep is in play, with refined structure holding.
• Entry Zone: Waiting for further confirmation on the lower timeframes once the market opens.
• Targets: 5M and 30M structural highs depending on how price delivers.
• Mindset Note: This setup is a prime example of letting price come to you. Trusting HTF structure and recognizing the sweep fuels the patience needed to strike on LTF intent.

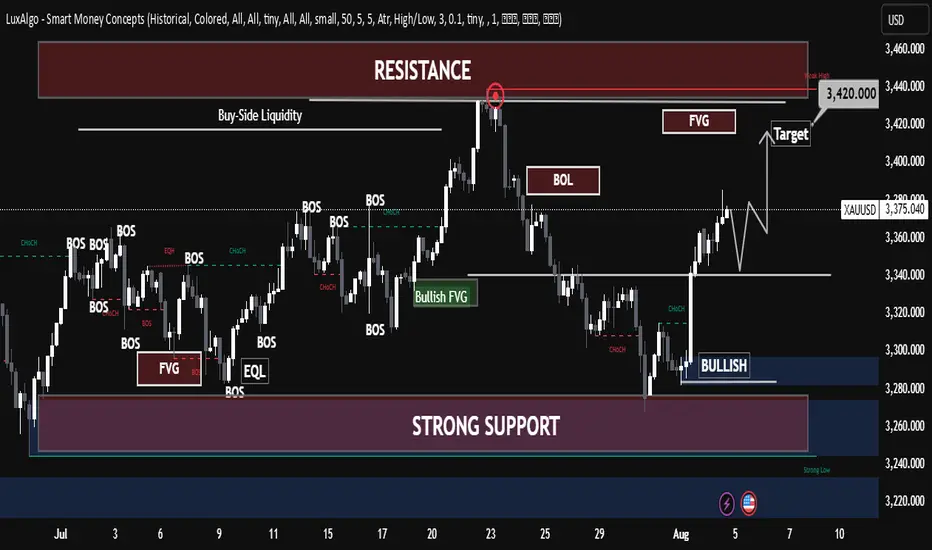
Technical Breakdown (Smart Money Concepts-Based)📊 Technical Breakdown (Smart Money Concepts-Based):
🔹 Market Structure:
Multiple Break of Structure (BOS) signals show a bullish shift in momentum, especially after the recent CHoCH followed by BOS at the current price zone.
Strong bullish confirmation after reclaiming previous liquidity zones, indicating institutional interest.
🔹 Liquidity and Zones:
Buy-Side Liquidity above $3,420 is likely the short-term institutional target.
Price has clearly reacted from a strong support block near the $3,260–$3,280 area, confirming demand and institutional accumulation.
The highlighted Bullish FVG (Fair Value Gap) aligns with a mid-level retracement zone—ideal for potential pullbacks before continuation.
🔹 Key Supply & Demand:
Resistance Zone (3,420–3,450): Contains weak highs and unmitigated FVG—prime liquidity zone for a sweep.
Strong Demand Zone: Around $3,260 has shown repeated reaction; the base of bullish moves.
Imbalance Fill & Rejection Expected in FVG near $3,420.
🔮 Projection & Scenario:
Expected pullback toward $3,340–$3,350, followed by bullish continuation.
Targeting liquidity sweep at $3,420, aligned with Smart Money accumulation and distribution logic.
Monitor for reaction at $3,420 for either a rejection or a clean breakout, confirming further upside.
✅ Conclusion:
This setup suggests institutional buy-side pressure with targets on resting liquidity around $3,420. Smart Money is likely driving price toward that level to grab orders before the next big move.
"BTC Sweeps Liquidity – Eyeing 115K Reclaim?""BTC Sweeps Liquidity – Eyeing 115K Reclaim?"
🔍 Technical Analysis – BTC/USD
On the 1H chart, Bitcoin (BTC) is currently displaying a textbook smart money structure, with price action following key institutional footprints.
🔑 Key Observations:
Liquidity Grab at Weak Low
Price dipped below the local support (~112,500), sweeping sell-side liquidity and tapping into a possible reversal zone.
Rejection from Demand Zone (Support Area)
A strong reaction occurred right at the support level, suggesting buyer interest is still present.
Order Block & Fair Value Gap
A visible Fair Value Gap (FVG) sits above current price action, aligning with an Order Block near the 115,000 level — this is a key magnet for price to rebalance.
Target Zone
Immediate upside target is 115,000, where an order block lies. If price reaches that level, expect potential short-term resistance or reversal.
Break of Structure (BOS) Confirmations
Multiple BOS and CHoCHs indicate bearish-to-bullish attempts, but the current structure still needs confirmation above 113,500+ for bullish continuation.
🧠 Conclusion & Expectation:
BTC has swept liquidity to the downside and may now seek to fill the FVG and revisit the 115K order block. However, confirmation is required — watch for bullish engulfing candles, volume spikes, or a CHoCH above 113,500.
“Smart money doesn’t chase — it waits for liquidity, then repositions. BTC may be following the same script.”

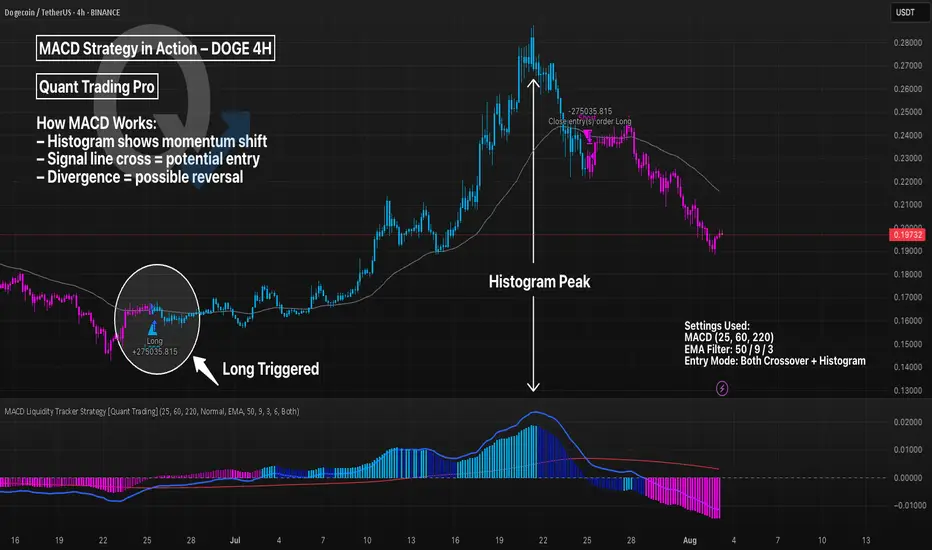
MACD Liquidity Strategy in Action – DOGE 4HThe MACD (Moving Average Convergence Divergence) is a trend-following momentum indicator. It uses two EMAs to generate signals via crossovers and histogram shifts.
This chart shows DOGE 4H with a long-only MACD Liquidity Tracker Strategy, using:
Fast EMA: 25
Slow EMA: 60
Signal Line: 220
These longer settings reduce noise and provide higher-conviction swing entries, though at the cost of late signals.
💡 Tweak Tip:
Lower values (e.g. 12/26/9) = more signals, better for scalping
Higher values (e.g. 25/60/220) = fewer signals, better trend filtering
Adjust the EMA filter (50/9/3 here) to match asset volatility
📊 Use MACD for:
Trend continuation confirmation
Exit timing via histogram fading
Divergence spotting (momentum vs price)
XAUUSD Price at Decision Point – Bounce or Breakdown?Gold (XAUUSD) is currently trading between two significant zones — a ⏫ 1H Order Block above and a 🛑 Major Support level at 3268.
At this stage, price action remains undecided, and we have a few key scenarios to monitor:
🔄 Potential Scenarios:
📌 Price taps into the 1H OB, then shows signs of rejection — this could trigger a move back down toward support.
⬇️ Price drops directly to 3268, where buyers may step in for a potential bounce.
🚀 If the price breaks through the OB, it may continue pushing up toward the liquidity area around 3248.
⚠️ If support fails, we could see a deeper bearish continuation.
These zones are crucial for both intraday and swing setups. Be patient and wait for a clean reaction to catch a high-probability move.

GBPJPYDate:
July 31,2025
Session:
New York Session
Pair:
GBPJPY
Bias:
Long
Liquidity from Monday's London session was swept in today's (Thursday) New York and London Session. Now I see price following the trend downward.
Entry: 199.080
Stop Loss: 199.387
Target: 198.207
RR: 2.90
How to Find Liquidity Zones/Clusters on Any Forex Pair (GOLD)
You need just 1 minute of your time to find significant liquidity zones on any Forex pair and Gold.
In this article, I will teach you how to identify supply and demand zones easily step by step.
Liquidity Basics
By a market liquidity, I mean market orders.
The orders are not equally distributed among all the price levels.
While some will concentrate the interest of the market participants,
some levels will be low on liquidity.
Price levels and the areas that will attract and amass trading orders will be called liquidity zones.
How to Find Supply Zones
To find the strongest liquidity clusters, we will need to analyze a daily time frame.
A liquidity zone that is above current prices will be called a supply zone.
High volumes of selling orders will be distributed within.
One of the proven techniques to find such zones is to analyze a historic price action. You should identify a price level that acted as a strong resistance in the past.
4 horizontal levels that I underlined on EURGBP influenced market behavior in the recent past.
The price retraced from these levels significantly.
Why It Happened?
A down movement could occur because of an excess of selling orders and a closure of long positions by the buyers.
These factors indicate a high concentration of a liquidity around these price levels.
How to Draw Supply Zone?
One more thing to note about all these horizontal levels is that they cluster and the distance between them is relatively small .
To find a significant liquidity supply zone, I advise merging them into a single zone.
To draw that properly, its high should be based on the highest high among these levels. Its low should be based on the highest candle close level.
Following this strategy, here are 2 more significant supply zones.
We will assume that selling interest will concentrate within these areas and selling orders will be spread across its price ranges.
How to Find Demand Zones
A liquidity zone that is below current spot price levels will be called a demand zone . We will assume that buying orders will accumulate within.
To find these zones, we will analyze historically important price levels that acted as strong supports in the past.
I found 3 key support levels.
After tests of these levels, buying pressure emerged.
Why It Happened?
A bullish movement could occur because of an excess of buying orders and a closure of short positions by the sellers. Such clues strongly indicate a concentration of liquidity.
How to Draw Demand Zones?
Because these levels are close to each other, we will unify them into a one liquidity demand zone.
To draw a demand zone, I suggest that its low should be the lowest low among these key levels and its high should be the lowest candle close.
Examine 2 more liquidity zones that I found following this method.
Please, note that Demand Zone 2 is based on one single key level.
It is not mandatory for a liquidity zone to be based on multiple significant levels, it can be just one.
We will assume that buying interest will concentrate within these areas and buying orders will be allocated within the hole range.
Broken Liquidity Zones
There is one more liquidity zone that I did not underline.
That is a broken supply zone. After a breakout and a candle close above, it turned into a demand zone. For that reason, I plotted that based on the rules of supply zone drawing.
Start Market Analysis From Liquidity
Liquidity zones are one of the core elements of forex trading.
Your ability to recognize them properly is the key in predicting accurate price reversals.
Identify liquidity zones for:
spotting safe entry points,
use these zones as targets,
set your stop losses taking them into consideration.
They will help you to better understand the psychology of the market participants and their behavior.
I hope that the today's tutorial demonstrated you that it is very easy to find them.
❤️Please, support my work with like, thank you!❤️
I am part of Trade Nation's Influencer program and receive a monthly fee for using their TradingView charts in my analysis.

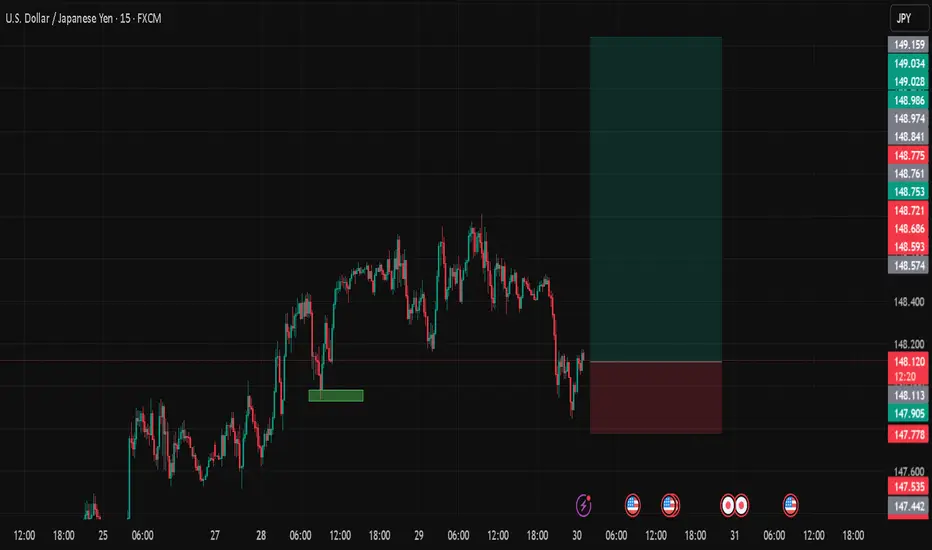
USDJPYDate:
July 30,2025
Session:
Asia and Sydney Session
Pair:
USDJPY
Bias:
Long
Liquid from Mondays New york open swept now price wants to follow trend
Entry: 148.108
Stop Loss: 147.778
Target: 149.640
RR: 4.57
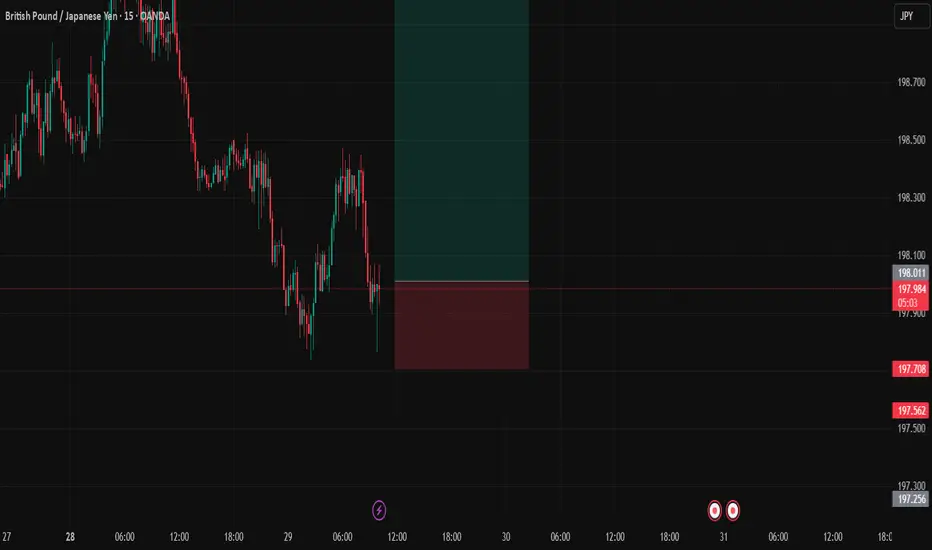
GBPJPYDate:
July 29,2025
Session:
London and New York Session
Pair:
GBPJPY
Bias:
Long
Yesterdays liquid untouched still lies. Expecting price to fill that area either by end of NY session or Asia.
Entry: 198.018
Stop Loss: 197.704
Target: 199.068
RR: 3.5
EUR/USD 30-MIN ANALYSISThis EURUSD setup showcases a clean bullish continuation scenario following a confirmed Break of Structure (BOS) and a sharp rally driven by momentum and liquidity imbalance.
After sweeping a key low (XXX), price impulsively broke structure to the upside, confirming a potential shift in market intent. A retracement is now expected to mitigate the Buy-Side Imbalance (BISI) zone.
BOS & SSS (Short-Term Structural Shift): Confirmed bullish intent.
Imbalance (BISI): Price left behind an unfilled imbalance zone a likely magnet for a pullback.
Re-Entry Zone: (BISI) provides a high probability area for long re-entry.
Upside Targets:
Target 1: 1.15483 – intermediate structural level.
Target 2: 1.16158 – premium supply / liquidity target.
#EURUSD 30M Technical Analysis Expected Move.

GBPCAD OUTLOOKIn this analysis we're focusing on 2H time frame for finding possible upcoming movement in price. So as per my strategy today I'm looking for a sell trade opportunity. Confirmation is very important, after confirmation we'll execute our trade. Let's see which opportunity market will give us.
Always use stoploss for your trade.
Always use proper money management and proper risk to reward ratio.
This is my prediction.
#GBPCAD 1H Technical Analysis Expected Move.

EURJPY POSSIBLE EXPECTED MOVEIn this analysis we're focusing on 1H time frame. Today I'm looking for a potential buy move from my marked key levels. This is a higher time frame analysis. Let's analyze more deeply into smaller timeframe and potential outcomes. Confirmation is very important.
Always use stoploss for your trade.
Always use proper money management and proper risk to reward ratio.
This is my analysis.
#EURJPY 1H Technical Analysis Expected Move.

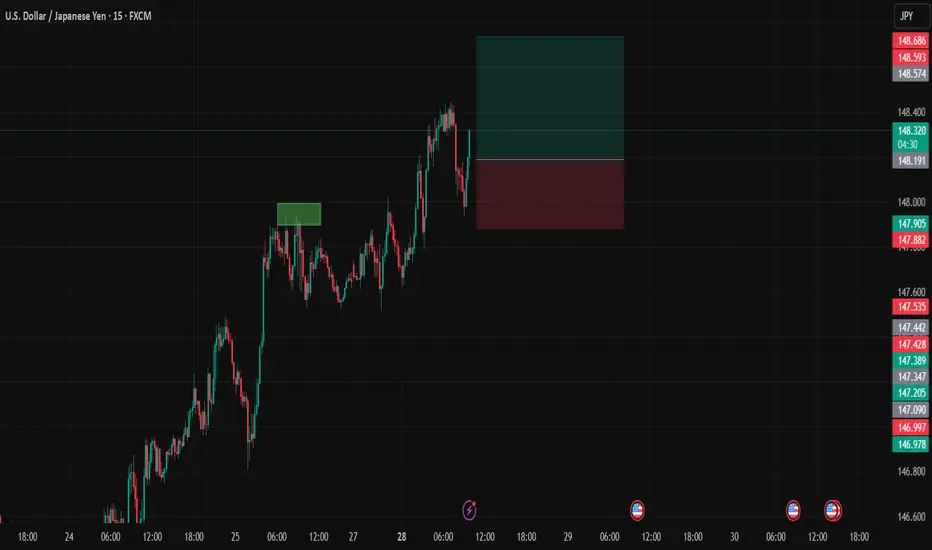
USDJPYDate:
July 28,2025
Session:
London and New York Session
Pair:
USDJPY
Bias:
Long
Looks like Sundays liquidity pool from last NYC open has been swept and it looks like price action wants to follow/continue its trend long.
Entry: 148.197
Stop Loss: 147.884
Target: 148.740
RR: 1.77
NZDUSDT Long Looking to enter NZD/USD around 0.59250 at the Order Block due to a liquidity inducement zone and potential Market Structure Shift (MSS).

NASDAQ| Bullish Bias - Refined OB Near MitigationPair: NASDAQ (NAS100)
Bias: Bullish
HTF Overview (4H):
Strong bullish structure has been the narrative, and last week’s upside intent confirmed the move. Current action suggests price is preparing for continuation after brief consolidation.
LTF Confirmation (30M):
Structure has been refined with a key OB in play. Price is approaching mitigation, and I’ve been tracking this level closely since last week.
Entry Zone: Waiting for clear 5M shift after OB mitigation. 5M OB already tapped — now I’m watching for confirmation to execute.
Targets: 5M highs first, 30M highs if price maintains momentum
Mindset Note: Focused and flowing. No forcing — I’ve tracked this from HTF to LTF and now I’m just waiting for price to invite me in. Clarity + patience = execution.
