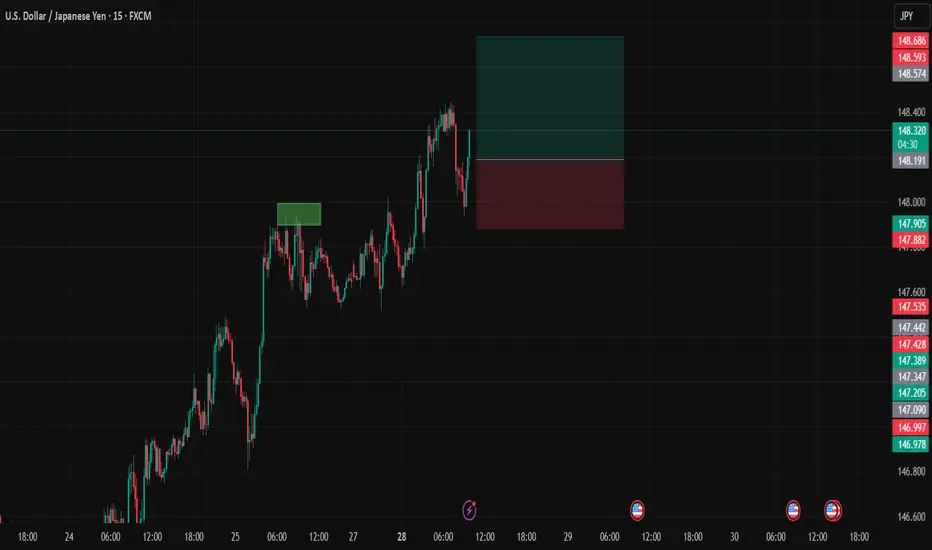
USDJPYDate:
July 28,2025
Session:
London and New York Session
Pair:
USDJPY
Bias:
Long
Looks like Sundays liquidity pool from last NYC open has been swept and it looks like price action wants to follow/continue its trend long.
Entry: 148.197
Stop Loss: 147.884
Target: 148.740
RR: 1.77
Liquidity
NZDUSDT Long Looking to enter NZD/USD around 0.59250 at the Order Block due to a liquidity inducement zone and potential Market Structure Shift (MSS).

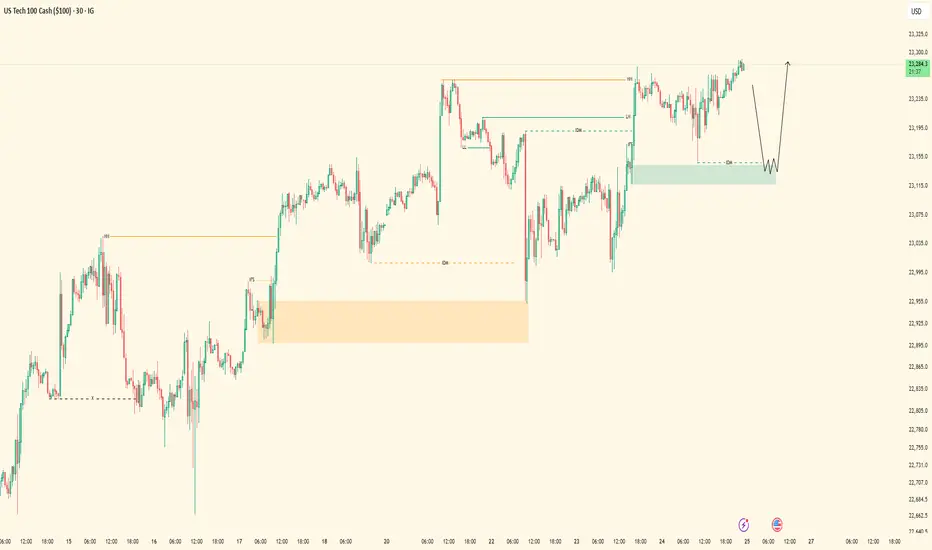
NASDAQ| Bullish Bias - Refined OB Near MitigationPair: NASDAQ (NAS100)
Bias: Bullish
HTF Overview (4H):
Strong bullish structure has been the narrative, and last week’s upside intent confirmed the move. Current action suggests price is preparing for continuation after brief consolidation.
LTF Confirmation (30M):
Structure has been refined with a key OB in play. Price is approaching mitigation, and I’ve been tracking this level closely since last week.
Entry Zone: Waiting for clear 5M shift after OB mitigation. 5M OB already tapped — now I’m watching for confirmation to execute.
Targets: 5M highs first, 30M highs if price maintains momentum
Mindset Note: Focused and flowing. No forcing — I’ve tracked this from HTF to LTF and now I’m just waiting for price to invite me in. Clarity + patience = execution.

GBPUSD | Bullish Bias - Midframe Alignment After SSL SweepPair: GBPUSD
Bias: Bullish
HTF Overview (4H):
Price structure is clearly bullish with strong intent. Looking to ride momentum as price continues toward 30M and 4H highs.
LTF Confirmation (30M):
Structure has been refined. Price swept sell-side liquidity and cleanly mitigated a key 30M OB — now I’m monitoring for LTF alignment to catch the continuation.
Entry Zone: Waiting for 5M CHoCH to flip bullish. Entry comes on the pullback into demand once the shift confirms.
Targets: 5M highs, 30M highs — trailing based on delivery and momentum
Mindset Note: No emotion, no forcing. Waiting for alignment from Smart Money and letting price invite me in. Clarity leads, execution follows.

EURUSD| Bullish Bias - Refined OB Play into ContinuationPair: EURUSD
Bias: Bullish
HTF Overview (4H):
Bullish structure remains intact — recent break to the upside was followed by a healthy pullback. Now price is continuing the push toward external 4H highs.
LTF Confirmation (30M):
Structure refined from last week. Price recently mitigated a 30M demand OB and is now showing signs of continuation. Watching for clean 5M shift to confirm the next leg.
Entry Zone: 5M CHoCH flip followed by pullback into demand zone
Targets: 30M highs, then extended target at 4H highs
Mindset Note: Keeping it clean and reactive. No guessing — I’m tracking Smart Money flow, structure shift, and waiting on my cue.

GBPJPY| Bullish Bias - Range Play Before The SweepPair: GBPJPY
Bias: Bullish
HTF Overview (4H):
Structure remains bullish, but price is currently sitting inside a tight top-of-range formation. No clear breakout yet — still waiting on a deeper sell-side liquidity sweep to fuel the next leg. Until then, the focus is on how price dances within mid-range liquidity.
LTF Confirmation (30M):
Still watching for a clean sweep of previous internal lows from last week. 30M OB is refined and marked — once it’s mitigated, I’ll wait for LTF confirmation.
Entry Zone: Will monitor for 5M shift and intent after OB mitigation.
Targets: Initial target = 5M highs; extended = 30M highs depending on price delivery.
Mindset Note: Sitting on hands until Smart Money shows its hand. No rushing range plays. Patience = precision.

XAUUSD | Bullish - Deep Liquidity Grab + OB MitigationPair: XAUUSD
Bias: Bullish
HTF Overview (4H):
Structure remains bullish, with continuation expected toward prior 4H highs. Last week’s strong bullish intent signaled Smart Money’s directional commitment. Price reached deeper to seek liquidity beneath major sell-side lows, setting the stage.
LTF Confirmation (30M):
Price cleanly mitigated a 30M order block resting just under the swept liquidity. This reinforces the bias, and I’ll now be watching for LTF confirmations once the market opens.
Entry Zone: Within or just above the 30M OB
Targets: 5M and 30M internal highs. Trailing targets will depend on how price delivers.
Mindset Note: Patience is key here. I’m waiting for clean confirmation before executing — no rush. The story is written. I just need the trigger.

EURNZD ShortAfter a recent Market Structure Shift (MSS) signaling a bearish direction, I'm looking to short at 1.95692. The supply zone aligns perfectly with the 61.8% retracement level, and there's a potential liquidity/inducement level forming, adding confluence to the trade.

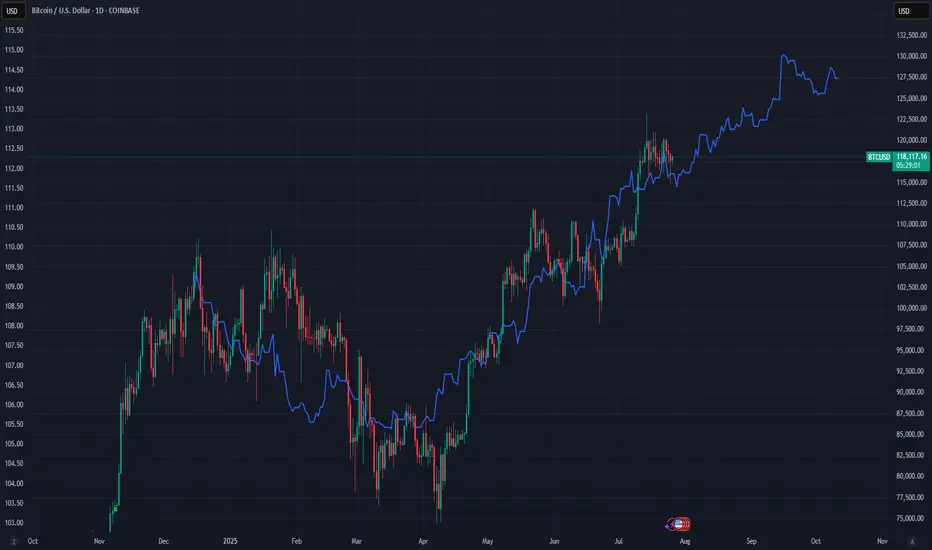
Bitcoin vs Global M2: Can Liquidity Predict the future?This chart compares Bitcoin’s price (daily) with a Global M2 indicator that includes the monetary supply of major economies like the U.S., Eurozone, China, and Japan.
It’s not a perfect global measure — but it gives us a reliable macro signal of what global liquidity is doing.
And when it comes to Bitcoin, liquidity is everything.
Why this matters:
Bitcoin is often seen as volatile or unpredictable. But when we zoom out and overlay it with liquidity flows (like M2), a powerful pattern emerges:
Bitcoin tends to follow global M2 with a ~10-week lag.
When M2 rises, Bitcoin often rallies weeks later. When M2 contracts, Bitcoin loses momentum.
This makes M2 a powerful leading indicator — not for predicting exact price levels, but for catching the direction of trend and regime shifts.
What this chart tells us:
M2 leads, Bitcoin follows.
The curves won’t align perfectly — but the macro structure is there.
Big expansions in M2 create a friendlier environment for risk assets like BTC.
This is the same logic used by macro strategists like Raoul Pal: liquidity drives everything.
Important disclaimer:
This doesn’t mean M2 tells you where price will be on a specific date. But it can help identify turning points — and confirm whether we’re in a reflationary vs contractionary environment.
Think of it as a weather forecast, not a GPS pin.
In other words:
This chart doesn't show the price. It shows the future.
UJ| Bullish Structure Ride | 5M Demand ExecutionPair: USDJPY
Bias: Bullish
HTF Overview: 4H structure stayed bullish with clean intent. Internal liquidity resting above prior highs, and price is still pushing through the 30M range toward those 4H targets.
LTF Confirmation: 30M showed a clean continuation range with a lower high (LH) inside structure — price never broke character. I tracked it into 5M where the OB was sitting patiently.
Entry Zone: Tapped into the 5M OB with a short-term sweep right before — no need for extra confirmation. The move had structure, inducement, and momentum on its side.
Target: TP hit at the 5M highs, but overall I’m watching for the 30M LH to go first, then ultimately expecting price to run the 4H internal highs this upcoming week.
Mindset Note: When the story is clear on the HTF, all you need is one clean LTF entry to ride with conviction. I’m letting the higher timeframe breathe and staying ready.
Understanding Market Structure: GBPJPY Trendline Support 📊 GBPJPY Technical Analysis — 15-Min Chart (As of July 24, 2025)
Trend Structure & Price Action
The chart shows a clear ascending trendline, connecting higher lows across the last sessions.
Multiple Break of Structure (BOS) points confirm bullish market behavior, with price consistently forming higher highs and higher lows.
The most recent BOS and price rejection from the lower boundary of the cloud band indicate bullish intent is still active.
Indicators Used
Custom Cloud Band (EMA Based 20, 1.5 settings):
Price is oscillating within and around the cloud band.
Recent candles are attempting to reclaim the upper band, suggesting building bullish momentum.
Volume Profile (VRVP) shows strong volume support around the 198.200–198.500 range, aligning with the trendline.
Support & Resistance
Support Zone: 198.200 (trendline confluence + volume shelf)
Immediate Resistance: 198.800–199.000
Major Resistance: 199.400 (next psychological level and prior high)
Forecast & Trade Idea (Educational Purpose)
If price continues to respect the ascending trendline and breaks above the recent local high (~198.750), we could see a bullish breakout toward 199.200+.
A bullish flag or small consolidation above the trendline before breakout is likely, as illustrated by the arrow.
Invalidation occurs if price breaks and closes below the trendline and 198.200, which may trigger a short-term correction.
✅ Conclusion
GBPJPY is currently in a bullish market structure with support from both trendline and volume profile. A clean breakout above 198.800 with volume confirmation could fuel continuation toward 199.200 and beyond. Risk management is crucial — watch for false breakouts or a shift in structure below the rising trendline.

BTCUSD Key Supply Zone Rejection – Bearish Target Mapped BTCUSD Key Supply Zone Rejection – Bearish Target Mapped (Educational Breakdown)
⸻
🧠 Technical Analysis (1H Chart):
• Range Structure: BTCUSD is currently trading within a well-defined consolidation range between the Resistance Zone ($119,850–$120,591) and the Support Zone ($116,937).
• Volume Profile (VRVP): Volume is noticeably thick near the mid-range, suggesting accumulation/distribution behavior. Price is struggling to break above the value area high near $120K.
• Resistance Rejection: After testing the upper supply zone, price failed to sustain bullish momentum and is showing signs of exhaustion – a possible sign of institutional selling.
• Target Zone: If price rejects this resistance again, a strong move toward the target level of $117,260 is expected. This aligns with:
• Mid-range liquidity sweep
• Low-volume node (LVN) below current price
• Fair Value Gap fill near $117,200–$116,900
⸻
🧩 Key Concepts Highlighted:
• Support & Resistance Mapping
• Volume Profile Readings
• Institutional Order Flow Bias
• Target Projection using Smart Money Concepts
⸻
⚠ Educational Insight:
This setup is a perfect example of how to combine Volume Profile + Price Action to identify liquidity traps and smart entries. Always wait for confirmation near key zones — not every level breaks!
⸻
✅ Trade Plan (Not Financial Advice):
• Watch for bearish engulfing/rejection wick at resistance
• Short entry below $119,000 with SL above $120,600
• Target: $117,260 / Final TP: $116,937 zone

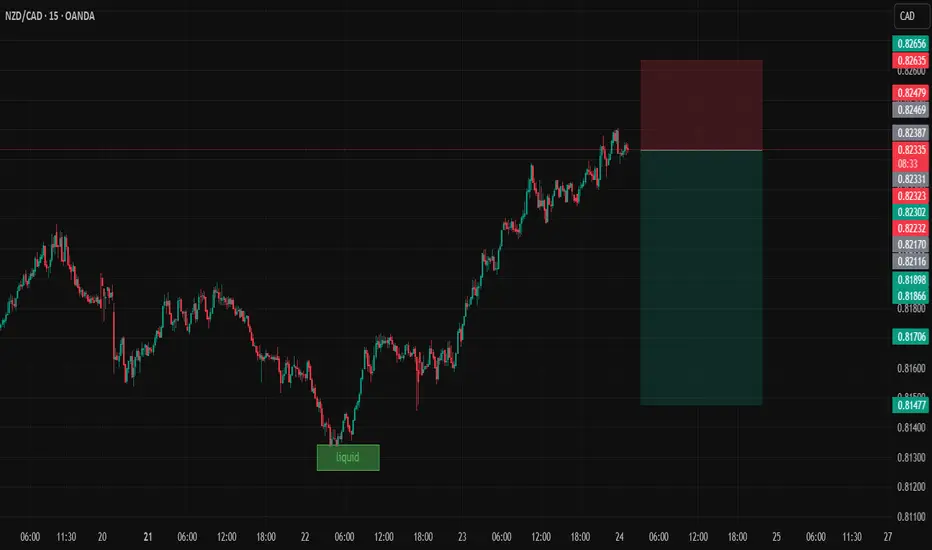
NZDCADDate:
July 24,2025
Session:
Tokyo and London session
Pair:
NZDCAD
Bias:
Short
liquidity pool that is waiting to be swept this week. Looks like price is gonna be magnetized towards that pool level during London and Tokyo. The trade may even stretch into NYC.
Entry: 0.82331
Stop Loss: 0.82635
Target: 0.81475
RR: 2.81
EURUSD - Next Buy Zone? This one has some nice potential
We will see how it plays out if we get tagged in

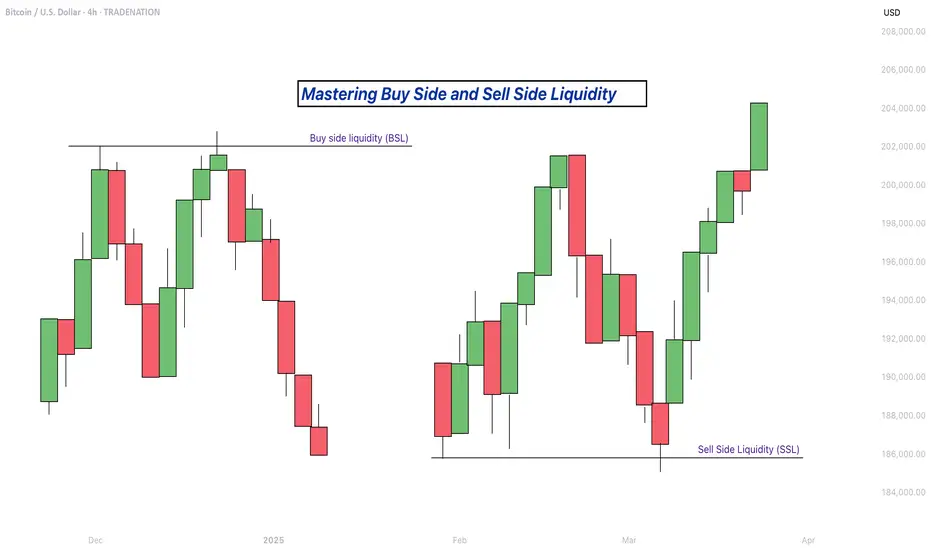
Mastering Buy Side and Sell Side Liquidity - How to trade it!In trading, understanding liquidity is one of the keys to predicting where the market might go next. The Inner Circle Trader (ICT) method teaches traders how to recognize where big players like banks and institutions are likely to enter or exit trades. Two important ideas in ICT trading are buy side liquidity and sell side liquidity. Once you understand what these terms mean and how to spot them on a chart, you can start using them to find better trading opportunities.
What will be discussed?
- What is Buy Side Liquidity?
- What is Sell Side Liquidity?
- How do you see Buy and Sell Side Liquidity?
- Examples
- How to trade BSL and SLL Liquidity?
What is Buy Side Liquidity
Buy side liquidity is found above market highs. It refers to all the stop loss orders from people who are holding short positions. When the market is going down, some traders sell (or go short) and place their stop losses above recent highs to protect themselves. These stop losses are actually buy orders because closing a short position requires buying. Big institutions know this, so they push price upward to trigger those stop losses and grab that liquidity. That’s why you’ll often see the market spike above a recent high before reversing. That spike is the market grabbing buy side liquidity.
What is Sell Side Liquidity
Sell side liquidity is the opposite. It’s found below recent lows. This is where traders who are buying (going long) place their stop losses. If someone buys a market, they’ll usually put a stop loss just below a previous low. That stop loss is a sell order. Smart money looks at these areas as pools of sell side liquidity. So when the market moves down quickly and breaks a recent low, it’s likely collecting those sell stop orders. After that, you’ll often see a reversal because the liquidity has been taken.
How do you see Buy and Sell Side Liquidity?
You can spot buy side and sell side liquidity by looking at the chart and identifying recent highs and lows where many traders might have placed stop losses. These are usually obvious swing highs and swing lows. If you look at a chart and see a clean high where price previously reversed, that’s likely where traders are placing stops. That makes it a target for buy side liquidity. Same for a recent low, if it’s a clean level where people might have bought in the past, that low probably holds sell side liquidity. The more obvious the level looks, the more likely it’s full of stops and therefore a liquidity target.
Examples
How to trade BSL and SLL Liquidity?
Trading liquidity means watching for the market to run above a recent high (to take buy side liquidity) or below a recent low (to take sell side liquidity), and then looking for signs of reversal. Once liquidity has been taken, the market often changes direction.
When you’re trading the ICT concept of liquidity, the key is not just spotting where liquidity lies, but also knowing when price is likely to reverse after that liquidity has been taken. Reversals don’t happen randomly, they leave clues on the chart. Here’s how you can recognize those signs in a simple way:
1. Market Structure Break
This is one of the clearest signs of a reversal. Let’s say the market grabs sell side liquidity by breaking below a recent low. If price then quickly starts moving up and breaks above the last lower high, that’s a break in structure. It shows that sellers are losing control and buyers are stepping in. It’s the first confirmation that the direction might be changing.
2. Rejection Wicks or Strong Candles
After price runs into liquidity (above a high or below a low), watch the candlesticks closely. If you see a long wick rejecting the level, or a strong candle in the opposite direction right after the liquidity grab, that’s a clue. It means price went there, collected the orders, and got rejected fast. That rejection shows the market might be reversing.
3. Fair Value Gaps (FVGs)
Fair value gaps are small “windows” left in price when it moves quickly in one direction. After liquidity is taken and price starts reversing, it often leaves an FVG behind. If price pulls back into that gap and holds, that can be a great entry point. FVGs act like magnets and support zones in ICT.
4. Displacement
Displacement is a strong, impulsive move that breaks structure. It usually happens right after liquidity is taken. If price moves very fast in the opposite direction after hitting a liquidity level, that’s a good sign smart money is behind the move and it’s not just random noise. That strong push is a hint that a new trend might be forming.
5. Change in Character (CHOCH)
This is a shift in how the market behaves. For example, price might be making lower highs and lower lows (a bearish trend), but after liquidity is taken, it suddenly starts making higher highs and higher lows. That change in character tells you the trend might be reversing.
-------------------------
Disclosure: I am part of Trade Nation's Influencer program and receive a monthly fee for using their TradingView charts in my analysis.
Thanks for your support. If you enjoyed this analysis, make sure to follow me so you don't miss the next one. And if you found it helpful, feel free to drop a like 👍 and leave a comment 💬, I’d love to hear your thoughts!
XAUUSD Locked In| Waiting for 5M OB SparkPair: XAUUSD (Gold)
Bias: Bullish
Timeframes: 30M / 5M
Gold has followed structure beautifully — top-down alignment from 30M into 5M is clear. Price respected the 30M OB and showed intent, but now we’re approaching the moment of truth.
I’m watching the 5M OB for entry — this is where execution mode activates. No rush. I’m in analysis mode right now, but the shift is coming.
Entry zone is mapped, structure’s in place, order flow is aligned — all I need now is price to do what it always does: respect the blueprint.
Entry Zone: 5M OB
Target: 5M highs
Mindset Note: Patience before the spark. I don’t force entries — I wait for the market to hand me the move it already hinted at. ⚡️

Nasdaq Bullish Flow | 5M OB Execution PendingPair: NAS100
Bias: Bullish
Timeframes: 30M / 5M
Price remains heavy bullish — structure aligning perfectly across the board. Ever since the 30M OB was mitigated, I’ve been following Nasdaq’s order flow step-by-step.
I was watching for full-bodied confirmations inside the 30M zone, but instead, price gave clarity through the lower timeframes. That 5M flip gave away smart money’s intent — showing me exactly where accumulation is happening.
Now waiting for price to tap into the 5M OB to shift into execution mode. This setup has been mapped with precision — no guessing. Once entry presents itself, I’ll follow through.
Entry Zone: 5M OB
Target: 5M highs
Mindset Note: Still in analysis mode — patience until price hits my zone. Smart money doesn’t rush, it accumulates. So do I. 💼
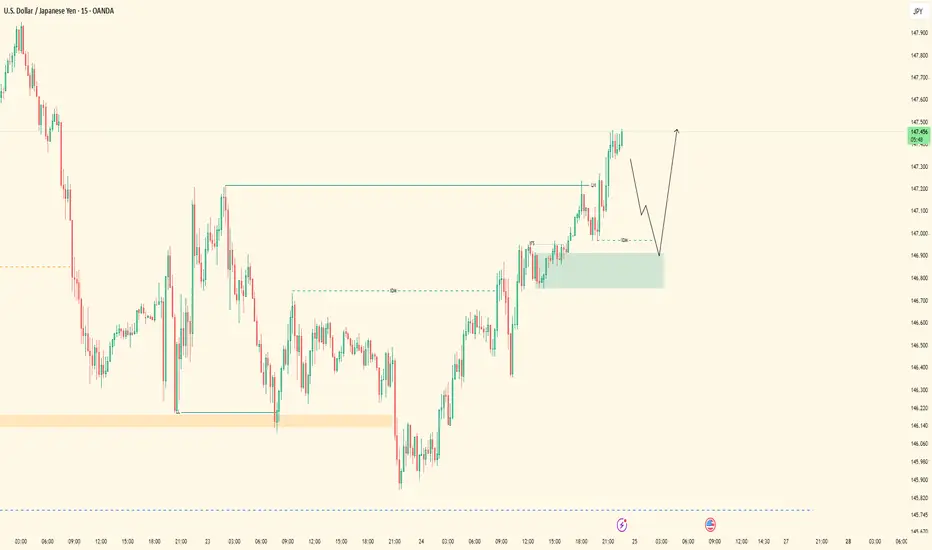
UJ Exexcution Flow| 5M OB Setup in MotionPair: USDJPY
Bias: Bullish
Timeframes: 30M / 5M
Top-down structure respected cleanly across the board — from HTF to LTF, price has been flowing exactly as forecasted. After confirming the bearish LH break and structure flip, we’re now in a bullish leg with intent clearly shown on the lower timeframes.
Currently waiting for price to mitigate the marked 5M order block for precise execution. Entry is valid and backed by structural logic — no guessing, just following what price has already confirmed.
Entry Zone: 5M OB (confirmed after LH break + LTF intent) Target: Clean 5M highs
Mindset Note: Analysis mode done. Execution mode engaged. I let price lead — I just follow structure.
Welcome Back! Gold Trading Strategy & Key Zones to WatchIn this week’s welcome back video, I’m breaking down my updated approach to XAU/USD and how I plan to tackle the Gold markets in the coming days. After taking a short break, I’m back with fresh eyes and refined focus.
We’ll review current market structure, identify key liquidity zones, and outline the scenarios I’m watching for potential entries. Whether you’re day trading or swing trading gold, this breakdown will help you frame your week with clarity and confidence.
📌 Covered in this video:
My refreshed trading mindset after a break
Key support/resistance and liquidity zones
Market structure insights and setup conditions
What I’ll personally avoid this week
The “trap zones” that might catch retail traders off guard
🧠 Let’s focus on process over profits — welcome back, and let’s get to work.

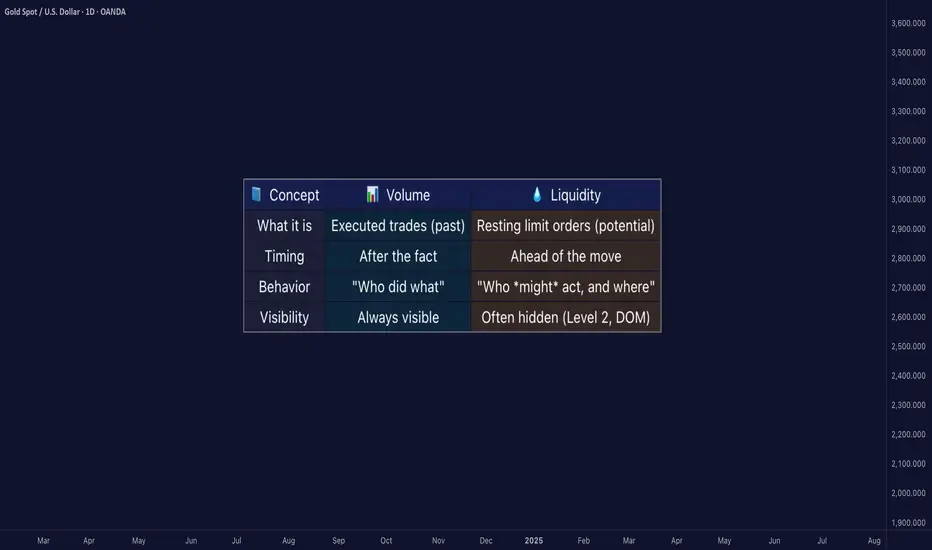
Liquidity ≠ Volume: The Truth Most Traders Never Learn█ Liquidity ≠ Volume: The Truth Most Traders Never Learn
Most traders obsess over volume bars, but volume is the footprint, not the path forward.
If you’ve ever seen price explode with no volume or fail despite strong volume, you’ve witnessed liquidity in action.
█ Here’s what you need to know
⚪ Volume Is Reactive — Liquidity Is Predictive
Volume tells you what happened.
Liquidity tells you what can happen.
█ Scenario 1: Price Jumps on Low Volume
❝ A price can jump on low volume if no liquidity exists above.❞
⚪ What’s happening?
The order book is thin above the current price (i.e., few or no sellers).
Even a small market buy order clears out available asks and pushes price up multiple levels.
Volume is low, but the impact is high because there’s no resistance.
⚪ Implication:
This is called a liquidity vacuum.
It can happen before news, during rebalancing, before session openings, on illiquid instruments, or during off-hours.
Traders often overestimate the strength of the move because they only see the candle, not the absence of offers behind it.
█ Scenario 2: Move Fails on High Volume
❝ A move can fail on high volume if it runs into a wall of offers or bids.❞
⚪ What’s happening?
There’s a strong surge of aggressive buying or selling (high volume).
But the order book has deep liquidity at that level — large resting limit orders.
The aggressive traders can’t chew through the liquidity wall, and price stalls or reverses.
⚪ Implication:
This is called liquidity absorption.
Market makers or institutions may intentionally absorb flow to stop a breakout.
Many retail traders mistake this for “fakeouts,” but it’s really liquidity defending a level.
⚪ What the Research Says
Cont, Stoikov, Talreja (2014): Price responds more to order book imbalance than trade volume.
Bouchaud et al. (2009): Liquidity gaps, not trade size, are what truly move markets.
Hasbrouck (1991): Trades only impact price if they consume liquidity.
Institutions don’t chase candles — they model depth, imbalance, and liquidity resilience.
⚪ Where the Alpha Lives
Liquidity tells you where the market is weak, strong, or vulnerable — before price moves.
Fakeouts happen in thin books.
Reversals occur at hidden walls of liquidity.
Breakouts sustain when liquidity follows the price, not pulls away.
If you understand this, you can:
Enter before volume shows up
Avoid chasing dead breakouts
Fade failed moves into empty space
█ Final Truth
Volume is the echo. Liquidity is the terrain. Alpha is in reading the terrain. You want to study the structure, because price moves toward weakness and away from strength. Learn to see where liquidity is, or where it’s missing, and you’ll see trading with new eyes.
-----------------
Disclaimer
The content provided in my scripts, indicators, ideas, algorithms, and systems is for educational and informational purposes only. It does not constitute financial advice, investment recommendations, or a solicitation to buy or sell any financial instruments. I will not accept liability for any loss or damage, including without limitation any loss of profit, which may arise directly or indirectly from the use of or reliance on such information.
All investments involve risk, and the past performance of a security, industry, sector, market, financial product, trading strategy, backtest, or individual's trading does not guarantee future results or returns. Investors are fully responsible for any investment decisions they make. Such decisions should be based solely on an evaluation of their financial circumstances, investment objectives, risk tolerance, and liquidity needs.
NASDAQ100| - Bullish Bias RemainsPrice didn’t give me the deep candle retrace into my 30M OB — just a wick tap — but that was enough. That wick shows me smart money touched in.
Dropped to the LTF and got my shift in structure confirming bullish intent.
Now I’m locked in, watching for price to sweep a 5M sell-side liquidity pocket into a clean LTF order block for the next entry.
🎯 Target: Short-term 5M highs
🚀 Bias: Still bullish unless structure breaks
This is a patience game now — execution only after confirmation.

USDJPY| - Bullish Setup Loading30M price action remains heavy to the upside. Structure is intact — no lows invalidated. Currently sitting on a refined 30M order block, I’m patiently watching for price to dip back into the zone and sweep short-term liquidity (SSL).
Once that sweep happens and we pull back into the OB, I’ll be looking to ride the bullish momentum:
🎯 First target: 5M highs
🚀 Final target: 30M highs
Feeling confident — just waiting on smart money to confirm it’s time.

XAUUSD| Smart Money Confirmations LoadingBias: Bullish
HTF Overview: Price has just tapped into the 30-minute order flow zone after clearing out sell-side liquidity. This area aligns cleanly with bullish intent and prior structure.
LTF Focus: Currently waiting for lower timeframe confirmation — ideally a clear CHoCH or internal flip. Once smart money confirms this zone with a shift, I’ll look to enter and ride the momentum.
Target: Initial focus is on the 5-minute highs as a short-term objective. While price could continue toward 30-minute highs, structure suggests the recent 5M high is a more immediate and realistic target, making it a smarter move to secure profit around that level.
Mindset Note: Not in a rush — letting price speak first. The confirmation is what separates a guess from a smart move.
