BTC - Will the Bears finally get their chance?Buy Side Liquidity Sweep in Progress
Price is currently climbing toward a region densely packed with resting buy side liquidity, marked by multiple previous highs. The area around 108,900 to 111,000 is especially significant, with two clear liquidity pools stacked above recent swing highs. These levels are likely to attract price as market participants seek to trigger stop orders and induce fresh buying interest—setting the stage for a potential reversal.
Weakness in the Current Impulse
The recent rally has advanced with minimal retracement and virtually no visible Gaps. This lack of corrective structure often indicates imbalance and suggests the move is overextended. When price moves upward too cleanly, it tends to leave behind thin liquidity zones, making the entire leg vulnerable to a sharper correction once exhaustion sets in.
Fair Value Gap as a Draw Below
Below current price lies a prominent bullish Fair Value Gap around 104,000. This inefficiency was left unfilled during the last leg up and may now serve as a magnet for price. These types of Gaps are often revisited by the market in an effort to rebalance supply and demand, especially after aggressive moves that break structure to the upside.
Once the higher liquidity levels are swept, watch for a clear reaction—either a strong rejection or lower timeframe structure shift—which could signal that the top is in. If that shift materializes, price may begin a downward leg targeting the unfilled Gap below. The magnitude of the move, combined with the lack of structure on the way up, leaves plenty of room for corrective action.
For those looking to engage, waiting for confirmation on a lower timeframe—such as a break of short-term bullish structure or the formation of a bearish Gap—can help time entries more precisely. In setups like these, patience is key: let the Sweep play out, observe how price reacts, and only then consider stepping in.
Liquidity

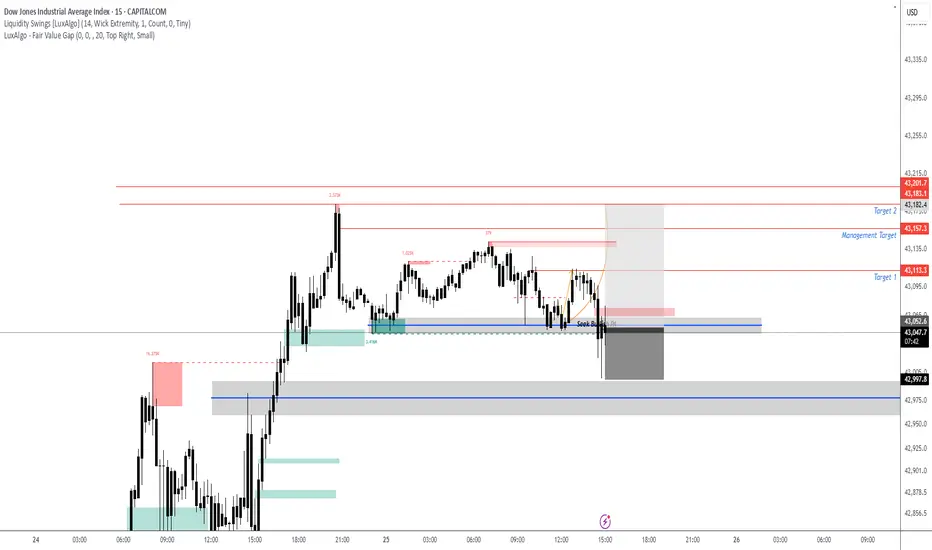
US 30 Potential longUS30 – Wyckoff Spring Setup for NY Session | Intraday Execution Play
Price rallied in the London session with rising volume and structure breaks —
Now we’re anticipating a classic Wyckoff spring scenario just ahead of NY open.
📍 Key Expectations:
Sweep of intraday support around 43,482
Strong buyer reaction (spring confirmation)
Expansion into the 43,600+ zone — possible 1.5R+ continuation
⚠️ Volume buildup + stop placement below prior structure make this zone ripe for a fakeout → reversal.
I’m watching for a quick flush below the line → wick rejection → engulfing confirmation to trigger longs.
This is a trap trade — smart money baits shorts, I’m betting they get squeezed.
🔫 Entry: On confirmation after spring
📉 Invalidation: Below the spring low
🎯 Target: 43,610 zone and trailing after break of 43,570
Let them walk into the trap. Then pull the trigger.

XAUUSD Daily Sniper Plan – June 27, 2025Hey traders! Today’s a trader’s dream: high-impact US news, gold trapped in a tight coil between supply and demand, and price flirting with the decision zone. The first breakout will be explosive — but only one side survives the trap. Let’s lock in the real structure, real bias, and sniper-level execution.
🔸 HTF Bias Breakdown
Daily Bias: Neutral → Price trapped between major supply (3359) and HTF demand (3282). Expect breakout after news.
H4 Bias: Bearish → Lower highs holding below 3359, structure weak below 3340.
H1 Bias: Mixed → Bullish momentum building off 3310–3282, but compression under EMAs warns of a fake rally.
🔹 Key Levels Above Price
3385 – Final top-side liquidity zone (last week’s spike high)
3359–3344 – HTF supply & OB (main short zone)
3340–3330 – The pivot zone (battle for control)
🔸 Key Levels Below Price
3317–3310 – Primary demand zone (where buyers stepped in yesterday)
3297–3282 – Deep liquidity pocket & HTF OB (last chance for bulls)
3260 – Breakdown zone if everything fails below
🔥 Sniper Zones & Execution Logic
🔴 3385–3375 – Extreme Supply
Only trade this zone if NY news launches price up and rejection is instant. Needs M5/M15 bearish reversal (engulfing, CHoCH, FVG fill). No news spike = no trade.
🔴 3359–3344 – Main Supply Zone
This is your first real short setup. Sweep into this area + rejection = clean short trigger. Confluence: HTF OB, FVG, EMA 100 rejection, bearish CHoCH.
⚔️ 3340–3330 – Pivot Decision Zone
This is where direction flips.
Break and hold above 3340 = bullish → targets 3359 / 3375
Rejection under 3330 = bearish → back toward 3310 or 3282
Plan: Use for break/retest entries only with M5/M15 confirmation. No blind trades.
🟢 3317–3310 – Primary Demand Zone
Watch for news-induced sweep, then M15 bullish PA (CHoCH, engulfing, RSI bounce). First safe buy zone if structure holds.
🟢 3297–3282 – Deep Demand Zone
Only used if NY session nukes the market. Enter only on textbook SMC/ICT reversal + RSI sub-30. This is the last stand for bulls.
🧠 Execution Strategy
Wait for NY news and first liquidity sweep. Don’t guess.
Sell 3359–3344 or 3375+ only on strong rejection
Buy 3310 or 3282 only on bullish reversal confirmation
Pivot 3340–3330 is the heart of today — use for break/retest or trap reversal
If you love clear logic, tap like, follow, and share your bias in the comments! 🚀👇
Disclosure: I am part of TradeNation's Influencer program and I'm using their TradingView charts in my analyses and educational articles.
GoldFxMinds

BTC - Double Top after Liquidity Sweep?Price has recently executed a Buy Side Liquidity Sweep just above the previous high. This type of move often signals a potential shift in market direction, especially when followed by signs of exhaustion or failure to push higher. In this case, price has formed a double top near the 106,600 level, a classic sign of weakening bullish momentum and hesitation at a key resistance area.
Following the Sweep, the projection suggests a possible rejection from this region, leading to a corrective move to rebalance the inefficiencies left behind by the sharp upward impulse. These inefficiencies are marked as Fair Value Gaps —areas where price moved too quickly, leaving imbalanced zones between buyers and sellers. The market tends to return to these areas over time as it seeks equilibrium.
The first Gap lies just below the 0.28 Fibonacci retracement and may serve as an initial area for a reaction. If price slices through this level without meaningful support, attention shifts to the second Gap, which aligns closely with the 0.50 to 0.618 retracement zone. This region is historically significant for pullbacks and could offer a temporary pause or bounce.
Should the move extend further, the third and deepest Gap, located between the 0.618 and 0.65 levels , becomes a key area of interest. It marks a critical rebalancing zone that could attract stronger buying interest. If this area fails to hold, the 0.786 retracement level sits just below and may act as a final point for support before any broader directional change.
For refined entries, traders can watch lower timeframes like the 5-minute chart. Look for signs of weakness, such as an inverted Gap or a lower-timeframe break in structure, to time positions with tighter risk. This allows participation in the broader move while maintaining tactical precision.
The confluence of a Buy Side Liquidity Sweep, a double top , and multiple Gaps below provides a clear framework for a potential downside play. As always, let the price action lead.
Patience, confirmation, and context are key to executing with confidence.

EURUSD Pull BAck - Long term Target 1.200Looking for the pull to prior day lows. Long term target for EURUSD 1.200.

GOLD REVERSAL POINT [Bearish Bias]According to this analysis, today I'm expecting a sell opportunity. So here we're analyze 1H time frame, Price is currently moving near a strong order flow area, and has also SIBI is pending. If price faces clear rejection from this key levels, So there is a high probability that the market may decline from this level. Wait with patient and maintain discipline, confirmation is key.
Now let's see how our sell zone plays out.
Always use stoploss for your trade.
Always use proper money management and proper risk to reward ratio.
#GOLD 1H Technical Analysis Expected Move.

US30 - ShortLooking for the Short on US30 final pull back before we see extension to the upside 45,000.

US30 - Long 43,150Still looking for that 43,150 lets get a test of FVG then on bullish PA above we can plan trade. Stops would go below the order block.

GOLD 30M ANALYSIS (LONG)In this analysis we're focusing on 30Min time frame. If we look in this 30Min chart, we have supply area and demand area. And we have also a minor resistance level. Now what I'm looking for that price move impulsively upside after sweeping all SSL. I'm expecting that price will come back and retest (3310 - 3305) area at least. So keep an eye on these level, confirmation is key.
Second Condition:
If price break above 3332 and close above 3332 with strong momentum than we will plan a buy trade on retracement.
Always use stoploss for your trade.
Always use proper money management and proper risk to reward ratio.
#XAUUSD 30M Technical Analysis Expected Move.

XAUUSD – Sniper Entry Plan June 26, 2025👋 Hello traders,
Gold is currently consolidating after recent downside liquidity sweeps, and Thursday brings high-impact USD catalysts. Let’s break it down and build a precise plan for sniper entries around these volatile zones. We’re trading structure, not noise — eyes on the prize. 🎯
🔸 HTF Outlook (D1 → H4 → H1)
🌐 Macro & Geopolitical Context
Markets are bracing for:
USD Unemployment Claims (Forecast: 244K, previous: 245K)
Final GDP q/q and Durable Goods Orders
Fed speakers (Barkin, Barr, Harker)
Stronger-than-expected data could reinforce USD bullish sentiment, sending gold down. Weaker reports + dovish Fed = bullish pressure on gold.
🗺️ Daily Bias: Neutral to Bullish
Price is ranging above a key CHoCH low + Daily OB (3272–3288)
Strong bullish continuation only confirmed with a break above 3370–3384
FIBO: 50% retracement of the last swing is near 3310, giving structure to Buy Zone 1
Bias: Bullish as long as 3272 holds — PA supports HL structure above imbalance
🕓 H4 Bias: Bearish Pullback
CHoCH at 3384 → clean Lower High + price failed to close above premium FVG
Pullback testing EMA 50/100 + FVG at 3345
FIBO extension zone at 161.8% aligns near 3288 = reactive downside target
Bias: Reactive bearish under 3352. If 3370 breaks cleanly → short invalid.
🕐 H1 Bias: Bullish Short-Term
CHoCH → HL printed at 3310 → higher lows forming toward supply
EMA 21/50 crossed to the upside, RSI mid-range (50–60)
PA structure showing ascending triangle under resistance
Bias: Bullish continuation valid toward 3352–3370, unless breakdown under 3308
🔸 LTF Precision (M30 → M15)
🔹 Sell Zone 1 – 3352–3345
H1 OB + M15 FVG + upper range sweep
RSI expected to peak near 70 → potential divergence
FIBO: 78.6% retracement of previous bearish leg
PA: Watch for M15 liquidity sweep + bearish engulfing
🔸 Entry: Wait for break/retest → confirmation on M5–M15 BOS
🔹 Sell Zone 2 – 3370–3384
HTF premium imbalance zone + weak high above
RSI likely in exhaustion zone
FIBO extension 1.272–1.618 completes inside this supply
PA: Only enter after stop hunt wick + clear CHoCH (M5)
🔸 Entry: Reactive fade after liquidity trap
🔸 Buy Zone 1 – 3308–3313
H1 CHoCH + OB + EQ zone
RSI bounce zone (30–40)
FIBO 50–61.8% retracement of bullish swing
PA: Watch for M15 bullish engulfing or double bottom formation
🔸 Entry: Only on structure break + retest confirmation
🔸 Buy Zone 2 – 3288–3272
Daily OB + HTF FVG + massive imbalance
RSI expected to overshoot under 30
FIBO: 1.618 extension from previous M15 bullish leg
PA: High-RR reversal zone if flushed by NY open
🔸 Entry: Enter only after M5 CHoCH or strong engulfing near the OB
⚖️ Decision Zone – 3333–3336
Previous supply turned EQ zone
PA shows indecision — do not enter here
Useful for monitoring if price holds support or rejects
🔸 Trade Scenarios
🟢 Bullish Scenario
If USD data is weak:
Flush to 3308 or 3288
Confirm HL formation → sniper buy from OB → aim 3345+, possibly 3370 sweep
🔴 Bearish Scenario
If USD prints strong:
Price spikes into 3352 or 3370 zones → rejection + BOS
Sniper short entry → targets 3310 → 3288
🔸 Final Plan & Action Points
✅ Patience is key during news. Let structure confirm.
✅ Track price behavior near 14:30 CEST, avoid instant spikes.
✅ Best sniper RR zones:
🔹 Sell from 3352 or 3370
🔸 Buy from 3308 or 3288
📊 Precision matters. Structure wins.
👍 Like this if it helped you map the move, and 🔔 follow for tomorrow’s sniper entry.
— GoldFxMinds
Disclosure: I am part of TradeNation's Influencer program and receive a monthly fee for using their TradingView charts in my analyses and educational articles.

US30 - Entries ActiveAs anticipated got the sweep below then break above our area with a U shape formation. Looking to the upside.
US30 - Final Push before PullbackPotentially another push to upper levels of supply potentially 43,150-43,200. Can see this retest before seeing a potential pull back based off larger time frame.

EURUSD - Looking to the upside retest of SupplyLooking to the upside, first lets get that push to lower level of liquidity swing then a push to the upside. Only on bullish confirmation at our highlighted level. I think we have one more retest before catching a potential short (pullback) on the larger time frame. Long term target for EURUSD is 1.200.

XAUUSD Bullish OutlookThis chart captures a highly strategic bullish setup on XAUUSD, rooted in Smart Money Concepts (SMC) and institutional trading principles. The market has performed a major liquidity sweep, dipping below previous lows to collect resting sell-side liquidity before reacting sharply from a key demand zone.
Why Bullish? The Confluences:
Liquidity Sweep:
Price manipulated below a significant structural low to trap late sellers and activate institutional orders. This move into deeper liquidity suggests the smart money is building long positions.
Extreme P.O.I. + Demand Zone:
The blue zone marks a high probability reversal area where demand outweighs supply. This zone is validated by historical reactions and refined to align with an Order Block (OB) a clear footprint of institutional accumulation.
Bullish Structure Anticipation:
After the reaction, price is expected to form a series of higher highs and higher lows, confirming bullish market structure. Multiple resistance levels are in sight, each one representing an objective for price to reach in its journey upward.
Entry Point: $3,343 – $3,330
Located inside the OB and demand zone, this is where price is likely to build a base for upward continuation.
Stop Loss: Below $3,324
TP1: $3,363 (first internal structure break)
TP2: $3,375 (mid range target)
TP3: $3,383 (structural high retest)
TP Final: $3,405 (liquidity target above EQH)
Remember confirmation is key before execution.
#GOLD 2H Technical Analysis Expected Move.

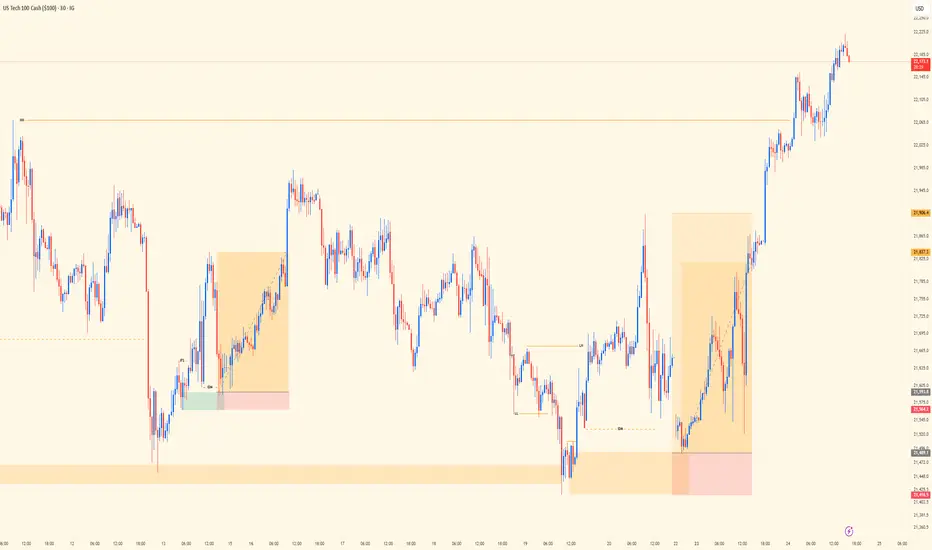
NASDAQ Midweek Review | Trend, Liquidity, PrecisionSingle-chart post today showing the execution trail behind two solid wins on NASDAQ.
Top-down bias was aligned — bulls clearly in control, so I stuck with trend direction. No need to fight momentum. As a trend trader, I don’t counter — that mindset shift alone is what keeps me consistent and clean with entries.
Chart shows the 30M view — where structure, liquidity, and timing came together. Both setups were built off elite structure reads. Liquidity played its part: manipulation, sweep, confirmation, and execution.
Bias: Bullish
HTF Alignment: Bullish trend continuation
Entry Frame: 30M precision
Key Insight: Liquidity isn’t noise — it’s narrative.
Mindset Note: Counter-trading is a shortcut to inconsistency. Stay with flow, respect structure.
Bless Trading!
EURUSD Midweek Outlook | 3H - 15M Dual ViewLeft side chart shows the 3H Bird’s Eye structure — price swept the recent highs but failed to follow through, signaling external bull weakness. That shift in narrative tells me price may be prepping to drop, potentially targeting the SSL below before gathering fuel to attack major highs.
Right side zooms in on the 15M — I’m patiently watching for a clean lower high to break (CHoCH) followed by a pullback to confirm a sell entry. Until I get that proper LTF trigger, I stay on the sidelines. Execution always follows alignment.
Bias: Short
HTF Structure: 3H sweep of highs, showing weakness
LTF View: Waiting for 15M confirmation (break + retest)
Target: SSL below
Mindset Note: Trade what’s shown, not what’s felt. Stay sharp, stay patient.
Bless Trading!

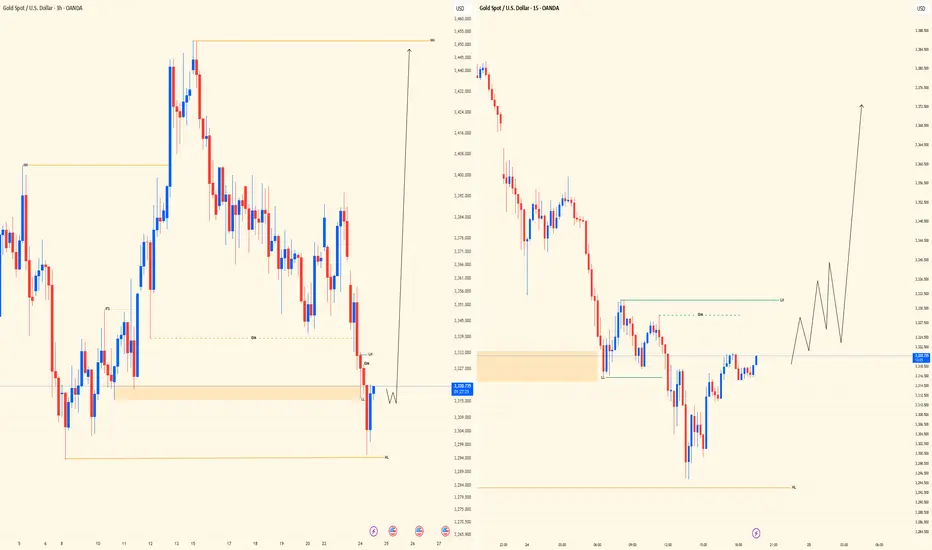
Midweek XAUUSD Insight | Dual View SetupPair: XAUUSD
Bias: Bullish
HTF Overview (Left Panel – 3H): Price action has been moving within bullish structure, with a major higher low currently holding strong. This HL is the key pivot I’m watching for continuation.
Refinement Zone (Middle – 30M): We’ve tapped into a 30M OB and are now sitting in mitigation territory. No signs of reversal yet, but the setup is maturing.
Entry Technique (Right Panel – 15M View): Just waiting for that classic Smart Money confirmation — LTF CHoCH, liquidity sweep, then return into OB. Will refine down to 5M for precise entry if price plays out clean.
Entry Zone: Waiting on confirmation around the OB zone
Target Zones: Based on HTF structure continuation
🧠 Mindset Note: Setup is solid, but patience wins. Let the story unfold — we only strike with clarity and precision.
Bless Trading!
GBPJPY| Midweek OutlookEven though it’s midweek, I wanted to share an update on GBPJPY and walk you through the process so far.
Price has been showing clear bullish structure from the 4H down to the 30M, so I remained patient and waited for price to revisit and mitigate a bullish order block — and that’s exactly what we got.
Now that mitigation has played out, I’m watching closely for LTF confirmations to line up. Ideally looking for entry opportunities around 196.006 – 195.922, depending on how the lower timeframes react and confirm.
Not rushing anything — just executing based on structure, mitigation, and confirmation. I’ll continue updating as price develops.
#GBPJPY #SMC #OrderBlock #SmartMoneyConcepts #PriceAction #ForexTrading #GJSetup #MidweekOutlook #InducementKing #DayTrader
Bless Trading!

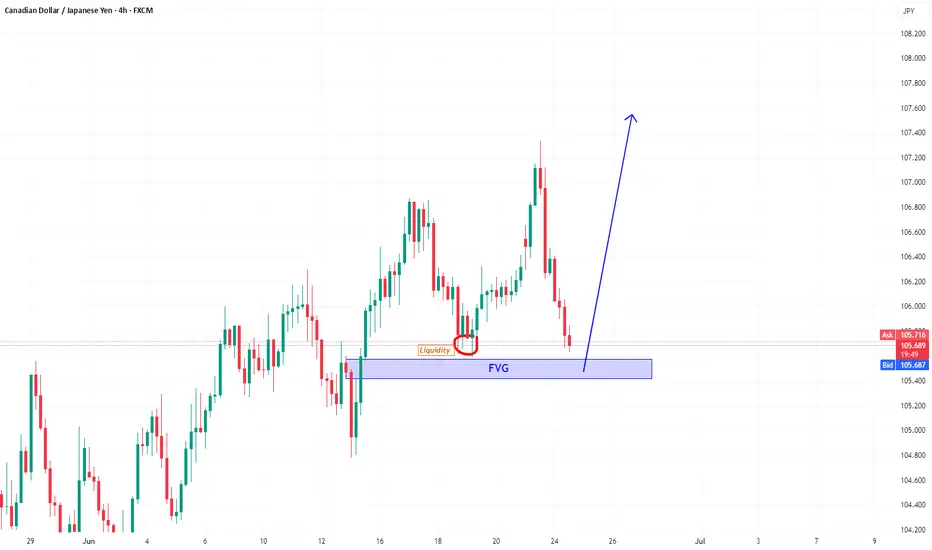
CADJPYHaigh Bullish opportunity.
Price will rebound from FVG area which never touch before ,Also will sweep the previous liquidity which not taken before
CADCHF bullish Price will rebound from FVG area which never touch before , Target next liquidity area.

Buying the Top Was the TrapEURGBP has just broken structure on the 1H chart and is showing strong momentum to the downside. After taking out a key low, price is now sitting in a vulnerable spot, with a potential push even lower on the table .
A fair value gap sits just above, and price might return there before continuing its move down. If that happens, it could set up a clean lower high and another leg into the previous low.
This setup looks promising, but as always, wait for a shift in character on the lower timeframe before making any decisions . If that shift doesn't happen, price could still run deeper before any reaction.

The Trap Has Been Set. Will Price Take the Bait?EURNZD just broke structure on the 4H chart and is now pulling back into a zone where things could get interesting. After the initial drop, price is retracing into an area filled with imbalance and liquidity.
This looks like a setup where the market may lure in buyers before making its next move lower. If sellers step in where expected, we could see a clean continuation to the downside.
As long as price remains beneath that reaction zone, the bearish narrative stays intact. One to keep an eye on in the coming sessions.
Just a word of caution : Always wait for a clear change of character on the 15-minute timeframe before considering any entry. If that confirmation doesn’t show up, price can easily break through the zone and continue climbing.

US30 - Intraday long scalp then short Looking for that intraday scalp on the long around 120 points can hold potentially further up to our higher supply level. If bearish PA is confirmed around the 43,000 level can look to take this short. All dependent on PA.
