GoldFxMinds Sniper Plan — June 17, 2025 🚀 GoldMinds Battle Plan Loaded — June 17, 2025
Good morning GoldMinds 👋
The market is again building perfect traps after CPI & PPI whipped both sides last week. Liquidity is stacking and volatility is hiding behind a quiet news calendar — exactly when the market loves to attack both sides. We stay patient, sniper-style.
🌎 Macro & Sentiment:
No major data today, but liquidity still reacts after last week’s CPI & FOMC tone.
DXY remains stable — gold remains capped inside premium supply zones.
The real game now is liquidity manipulation — we focus on clean execution.
🔬 Structure & Bias:
✅ D1: Liquidity sweep above 3450 — sellers protecting premium.
✅ H4: Lower high distribution forming.
✅ H1: Bearish order flow starting to control.
✅ EMAs 5/21/50: compressed bearish.
✅ RSI: showing divergence on intraday.
Bias: Tactical Bearish — under 3460 we remain sellers on sweeps. Liquidity hunts both ways but premium remains the trap zone.
🎯 Sniper Zones
🔻 SELL ZONES:
3405 – 3410 → early pullback rejection zone
3435 – 3445 → main OB liquidity sweep
3452 – 3460 → extreme premium trap zone
🔻 BUY ZONES:
3365 – 3380 → golden zone buy (perfect fibo confluence)
3335 – 3345 → deep flush exhaustion buy
🔄 Tactical Scenarios
Sell spikes into premium → M15 rejection → target 3380 first.
If flushed into golden zone → watch M15 confirmation → target 3405.
If deep flush into 3335 → exhaustion buy setups only.
💡 Tactical Notes
No chasing — liquidity first, reaction second.
News absence = perfect condition for engineered liquidity sweeps.
Stay sniper. Only act when structure confirms.
🔥 If this sniper battle plan helps you prepare, smash the 🚀, drop your bias in comments & hit FOLLOW to support real structure-based trading. Let’s bring back real value content to TradingView.
GoldFxMinds 🧠✨
Liquidity

NZDUSD - LongWhen the market opens and the spreads die down. Will definitely be entering this trade to the upside.
We are still in a HTF bullish orderflow.
This is a great buy set up as we are at a very discounted price.
Lets see how It plays out

USDJPY| Bull vs Bear at Key ZoneUpdated the chart and noticed both bullish and bearish order blocks near current price — classic tug-of-war setup, and USDJPY does this often.
Structure is still developing, and the direction will be confirmed through how price reacts on the entry timeframes. Whichever side mitigates first with intent gives the trade.
Until then, it’s observation mode — watching closely and letting price reveal the path.
— Inducement King 👑
Bless Trading!

USDJPY| Bearish Structure in FocusUSDJPY broke a major lower high on the 4H, creating new external liquidity that has yet to be swept. This shift opened the door for potential bearish continuation.
On the 30-minute, I confirmed bearish intent with a major low taken. Structure aligns, but patience is key — I’m only interested in entries within premium pricing.
Now watching for buy-side liquidity to be swept into my marked order block. That reaction will be the signal for possible downside continuation.
Setup is clear. Execution comes with precision.
— Inducement King 👑
Bless Trading!

NAS100\ Bullish Play DevelopingNasdaq holds a strong bullish structure on the 4H, so I moved down to the 15-minute for a cleaner bird’s-eye view of price action. Liquidity was swept directly into a refined order block — a precise tap that validated the zone.
Price is now hovering around a 5-minute OB. Just observing and letting the market unfold.
Discipline and patience — that’s where the edge is.
— Inducement King 👑
Bless Trading!

GBPUSD| Bullish Structure HoldingGBPUSD continues to map out a bullish structure. While higher timeframe liquidity remains untouched, I’m anticipating a potential continuation on the lower timeframes.
Refined the 30-minute structure and confirmed bullish intent is intact. Now focused on price taking short-term liquidity and mitigating into the marked order block before considering any execution.
The setup is developing — staying patient and letting price come to me.
— Inducement King 👑
Bless Trading!

GBPJPY| Bullish Shift in ProcessGBPJPY broke its major lower high on the 4H, signaling a shift in directional intent to the upside. While external liquidity remains intact, I’m monitoring for a potential continuation setup.
On the 30-minute timeframe, price broke a significant high and internal structure is now aligned with bullish order flow. I’ve marked a near-term zone where price may pull back into — specifically watching for a sweep of short-term liquidity within an internal order block.
No rush. Just waiting for price to offer a high-probability entry aligned with refined structure and flow.
— Inducement King 👑
Bless Trading!

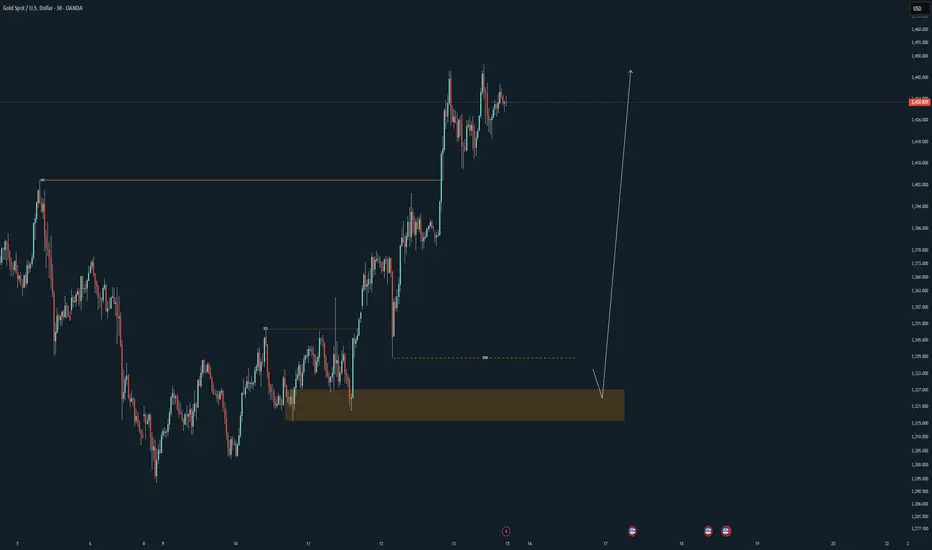
XAUUSD| Bullish Momentum Building with CLean StructureGold continues to show strong bullish momentum, with price steadily climbing and maintaining upward pressure.
I dropped to the 30-minute chart to refine structure, and the bullish narrative remains intact.
At this point, I’m allowing price to develop — waiting patiently for a potential liquidity sweep that aligns with my criteria.
No chasing, no guessing — just reading the market and executing when the story aligns.
Refined structure. Momentum confirmed.
Patiently waiting to act — as always, precision is key.
— Inducement King 👑
Bless Trading!
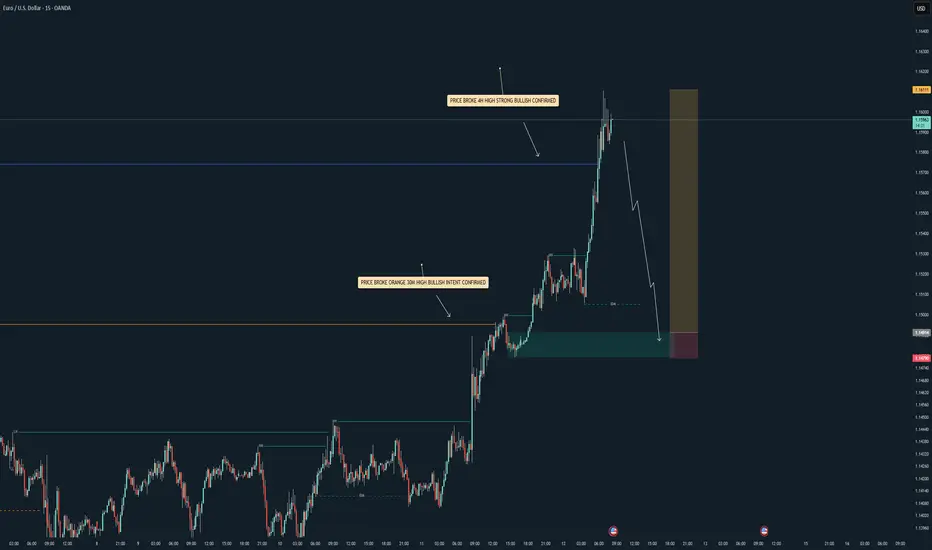
EU Loading the Next Leg Up| Bullish Bias in MotionEU gave that clean 4H high break — strong bullish intent locked in.
Zoomed into the 30M and spotted that refined structure doing what it does.
Now just sitting tight, waiting on market open to see if price wants to bless the kid with that next leg up.
High timeframe bias is bullish.
Mid-timeframe structure aligned.
It’s patience time — sniper mentality 🧠🎯
Bless Trading!

Caught EU clean today. Waited patiently for that textbook 30M liquidity sweep, then stalked the LTF entry like a sniper. No rushing—just letting price do its thing until it stopped running. Then we pounced. 💥
Execution was sharp. Setup was smooth.
This is how we trade over here—precision, patience, and purpose.
📉 Stay tuned for the breakdown and upcoming analysis.
Would love to hear y’all thoughts on this one 👀👇
#SMC #Forex #InducementKing #EUTrade #SmartMoneyFlow
Bless Trading!

EURUSD, GBPUSD - Outlook for next weekEURUSD - So we have 2x 4 hour POI's (Points Of Interest). Will be looking at potential reversals at both POI's however, within the first POI we have an area of potential liquidity that could look to be taken before we make out move back to the upside.
Therefor, the second POI could look to be our more solid option for our buying options at some point next week.
GBPUSD - This pair looks to be building its liquidity now for potential trades to the upside as today on the lower TF's it was setting quite a few traps for the potential longs and the traders that would have been shorting the breaks below structure to the left.
If you have any questions for me please do let me know

BTC gathers liquidity ahead of growth Inside the trading range Bitcoin has moved into a sell-off phase due to the situation in the Middle East. The sell-off could extend to 102500 - 100600. But as the market is trending and bullish, the support at 100600 may hold the price and allow the market to strengthen
Scenario: A false break of the resistance at 105280 is formed. Accordingly, I am initially waiting for a decline to 102500. If 102500 fails to hold the move, bitcoin could then head to the liquidity pool. A false break of 100600 may give a chance for a rise to 105200 - 108200.

EURUSD - Current long positionVideo analysis of EURUSD
Hopefully we will get some bullish momentum however its not looking great

EURUSD, GBPUSD & EURGBP analysisHere's my outlook on the 3 pairs mentioned in the title. Looking for more upside momentum after we have some sort of pullback into the premium discount prices.
Once we get some15min bearish internal orderflow on the lower Time Frames I will look to enter short term sell positions before looking to take longer term buys on the way back up.
Again, if I can be of any assistance please do let me know and I will be happy to help where I can.

EU| Workflow - End of Week but Still in SyncPrice still pushing with strong bullish conviction, so I’m just flowing with it and waiting on that precision entry — nothing forced, just discipline and patience.
Even though we’re nearing the end of the week, the workflow and higher timeframe analysis still align, so I’m staying ready. I’ve got my zones mapped out and I’m watching for price to pull back into that green zone POI. Once that mitigation happens, I’ll drop to the 1M for the structure shift and look for that 5M LH break to confirm my entry.
Just letting the setup mature and keeping emotions out of the way. 📊
Always open to hearing how others are viewing EU right now — let’s elevate the convo while we wait on the market to give us the greenlight. 🎯
#SMC #EU #SmartMoney #TopDownPrecision #InducementKing #JuicemannnStyle #ForexFlow #EndOfWeekExecution
Bless Trading!
Global M2 Money SupplyWith more money than ever before in circulation available. Asset prices should go up..
Do you agree or disagree?

GBPUSD - Long after a structural shiftBased off of yesterdays analysis.
We can see we are fast approaching a very nice POI.
Will post below my mark up chart from yesterday so you can see below. Will now be sending most of my day on the 15min TF waiting for our structural shift to the upside.
Let's see how price plays out today.
Don't just dive into the trade. Wait for your structural shift first.
If I can offer any help please do let me know

EURUSD| Riding the Real FlowInitially waited for price to return to my first POI — didn’t happen. Instead, price BOS’d and unlocked fresh liquidity. No panic. I’m not here to force old zones — I follow structure.
Now we’ve got:
✅ 4H bullish momentum still active
✅ Fresh BOS creating new intent + liquidity
✅ 30M heavy bullish push showing strength
✅ Top-down alignment from 4H → 30M → 5M
✅ Mitigation + sweep + OB entry on deck
That clean demand zone is holding value — I’m just staying patient, letting price do its thing. As always: “We sit. We wait. We strike.”
When it aligns — I’m in. Until then, I’m chilling like the sniper I am.
#SMC #JuicemannnFlow #TopDownMastery #ForexSniper #StructureTalks #InducementKing #EURUSD #RideTheMomentum #4HTo5M #LiquidityReads #FundedTraderMoves
Bless Trading!

GBPUSD - Long at some pointVery similar with what we are looking for in relation to EURUSD
Will wait for a mitigation of the demand at lower price. Will wait for an internal structure break before looking to get long.
Will have a nice sleep now and will re-evaluate in the morning.
Caught 2 lovely trades on this today and hopefully I may be able to catch 1 or 2 more before the week is out.
Again, if you have any questions don't be shy to get in touch

EURUSD - Mark up for the rest of the weekAfter the CPI data was released today we had a lovely upside move. The move has caused us to trade into the previous weak higher timeframe high which I am hoping we can break and close above before the day is out.
I am now focusing on what kind of pullback we may get into out POI's. Because there is no buy side liquidity on the first POI I will need to see a structural shift on the 15min TF to confirm that internal structure swing to move back towards the upside.
If the 1st POI fails to hold I will be more aggressive with my secondary POI as that will be the premium discount price in order for us to move higher.
If that POI fails and we break the 4H structure swing then this could signal we are about to move lower.
If I can be of any assistance to anyone don't be shy to give me a message

Mastering Liquidity Dynamics: Understand the Dynamic True ValueDear Reader,
Thank you for reading—your time is valuable.
Use the chart's zoom-in/out (-/+) function for better visibility. This chart captures a large sample for your evaluation.
Below is the manual detailing the Smart Farmer System —a Dynamic True Value framework derived from real-time data to anticipate market intent and liquidity behavior .
If this resonates with you, drop a comment below— constructive insights are always welcome .
The Dynamic True Value - a Smart Farmer System: Terminology and Mechanics
: For now, I have firmed up POC - Price of Control, VAP - Value Average Pricing, SULB - Sell Upper Limit Bound, BLLB - Buy Lower Limit Bound.
Mechanic:
POC - Where fair value price dynamic is read.
VAP - Trading above indicates bullish sentiment of the cycle, and the opposite for bearish sentiment.
A crossed over of:
Grey POC above Green VAP - Signaling distribution, accumulation, consolidation, build-ups, correction, retracement .
Green VAP above Grey POC - Bullish strength and momentum consistency .
Pink VAP above Black POC - Bearish strength and momentum consistency .
Flip of Pink VAP to Green VAP - Sentiment flips from bear to bull, and the same goes for green flip to pink showing bull to bear.
Validation of entry signals requires:
Signal's candle must close past the opposite side of POC – flip sentiment .
The confirmation candle (is the closed next candle immediately after entry signal candle) must continue closed past the POC – maintain sentiment .
The progress candle (is the next candle closed right after the Confirmation Candle) shows traction, momentum build-up, and volume consistency .
Hint of invalidation:
Signal's candle is considered void if the next candle prints a new entry signal in the opposite direction. This often signals accumulation, sideways movement, build-up, uncertainty, or swings in range .
The immediate next candle closed past POC to the opposite side.
What to understand about Liquidity Trap, SULB, and BLLB:
Liquidity traps
Often occur at the recent/previous flatlines of Dynamic True Value (POC, VAP, SULB, BLLB) .
It is worth paying attention to the market’s intent and institutional positioning.
Signs of exhaustion, absorption, inducement, offloading, and accumulation are visible in the M1 (one-minute) TF, with significant confluence near the previous/recent flatlines of Dynamic True Value in the higher/macro-TFs.
An Anchored VWAP tool can be helpful for filtering noise in the market. This tool can be found in the drawing tab in the TradingView platform.
SULB
Details the dynamic of upper resistance where Bears remain in control below the dynamic level.
Below this limit bound (LB) , bears show strength – bear sentiment .
A converging price toward this LB indicates bulls are present.
Moving past this LB (a candle closed above) and successfully RETESTING newly formed support indicates a confirmed directional shift . Followed by printing a new BLLB in the next following candles with price continuing to rise above this failed SULB.
A rejection below LB (a rejection/exhausted candle closed below LB) and successful RETEST reaffirms the resistance holds , indicating downside continuation .
BLLB
Details the dynamic of lower support where Bulls remain in control above the dynamic level.
Above this LB, bulls show strength – bull sentiment .
A converging price toward this LB signifies bears are present.
Moving past this LB (a candle closed below) and successfully RETESTING newly formed resistance indicates a confirmed directional shift . Followed by printing a new SULB in the next following candles with price continuing to push lower below this failed BLLB.
A rejection above LB (a rejection/exhausted candle closed above LB) and successful RETEST reaffirms the support holds , indicating upward continuation .
Important Notes:
Select preferred Entry’s Signal TF (ex. M3 TF, M5 TF for scalping strategy, M15 for intraday/daily strategy, 4H TF for day-to-weekly strategy, etc.).
Always refer to the selected Entry’s TF for trading progress. Anticipate TP and SL by watching the range in this TF.
Non-entry TFs are not for entry purposes. These multi-TFs are used for measuring strength, momentum, liquidity, positioning, structure – The market intends . The Non-entry TF is used to anticipate institutional executions and liquidity pools.
These criteria MUST BE MET. A failed criterion suggests vague execution. Be patient and wait for clear validations.
Institutions excel in creating illusions.
SFS is designed to stand ready, calm, and execute with Clarity.
SFS cuts through noise, distraction, and stays independent of NEWS, GEOPOLITIC, RUMORS, and herd mentality because all these are designed to mislead retail traders into institutional traps.
When we see such ambiguity against the criteria, we know not to fall into the TRAP and become the liquidity FUEL.
Stay sharp, only respond when signals are firmed. SFS is designed to counter Smart Money capitalism. It is about time to level the playing field.

EURUSD| Buy Flow In PlayGot price respecting my top-down flow — 4H to 5M is in full alignment right now. We swept key liquidity levels and price held structure clean, giving me reason to look for a buy continuation.
Could’ve posted a more detailed breakdown (order blocks, FVGs, etc.), but I’ll save that sauce for another time. Just curious what y’all see here — feel free to share your take on this play. I’m always open to sharp minds tapping in.
Let’s see how this unfolds. 🧠💧
#EURUSD #SmartMoneyConcepts #LiquiditySweep #PriceActionTrading #TopDownAnalysis #InducementKing
Bless Trading!

GBPUSD - Long on fullfillment Looking at GBPUSD
The order flow on the 4HR and 15min are still bullish.
Looking for that upside momentum until we take out a 4HR level of demand.
So until the buyers have had enough and the sellers take over. Lets see what we get overnight.
Will leave a pending order on this until the London open and then re-assess in the morning
If you have any questions don't be shy
