USD/JPY Chart Analysis (Educational Breakdown)📊USD/JPY Chart Analysis (Educational Breakdown)
🗓 Date: July 28, 2025
⏰ Timeframe: 2H (2-Hour Candles)
🧠 Concepts: Liquidity | Fair Value Gap | Order Block | Structure | Support/Resistance
⸻
1. Market Structure Overview
• The pair has been bullish, making higher highs and higher lows.
• Recently, price tapped into a resistance zone (~148.40–149.00) and sharply rejected, suggesting a potential short-term reversal.
• The price may now aim to sweep liquidity below support before a possible rebound.
⸻
2. Key Levels
🟥 Resistance Zone (148.50–149.00)
• Marked by a previous supply zone where sellers stepped in aggressively.
• Current Bearish Order Block sits just below this resistance, confirming institutional interest in selling this level.
🟫 Bearish Order Block
• Last bullish candle before sharp drop acts as a bearish order block (around 148.30–148.50).
• This is a high-probability sell-side reaction area — ideal for liquidity grabs and reversals.
🟦 Fair Value Gap (FVG)
• Between mid-17th–18th July, an imbalance was left after strong bullish momentum.
• Price returned to this zone, partially filled the gap, and then dropped again — confirming its importance.
🟥 Support Zone (145.80–146.30)
• Long-standing demand area where buyers previously stepped in.
• This area aligns closely with sell-side liquidity (SSL).
⸻
3. Liquidity Zones
🔵 Buy-Side Liquidity (BSL) – Above resistance (149.00+)
• Stop-loss clusters above previous swing highs.
• Liquidity for institutional sell positions.
🟣 Sell-Side Liquidity (SSL) – Below 146.00
• Positioned right under support.
• Ideal liquidity target for smart money to trigger stop hunts and fill positions before reversing.
Liquiditygrab

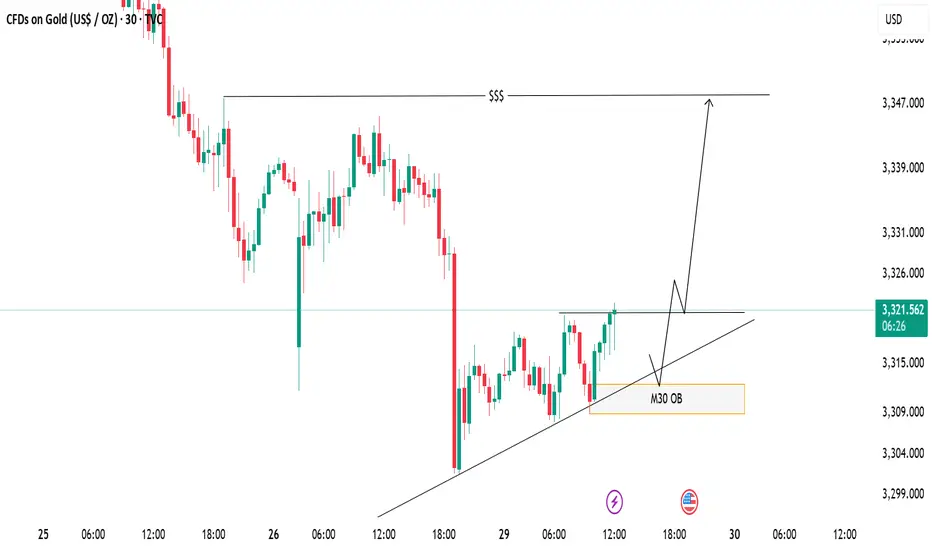
XAUUSD Eyeing Liquidity Grab – M30 OB Zone in PlayPrice is respecting the ascending trendline and consolidating near a key resistance level. A bullish breakout is expected, with a potential retest of the trendline and the M30 Order Block (OB) zone acting as a key demand area.
📈 Trade Plan:
Wait for a minor pullback into the OB and trendline confluence
Look for bullish confirmation to go long
Target the liquidity zone above (around 3347)
📌 A clean structure and bullish order flow hint at a continuation to the upside.
XAUUSD Technical Analysis – Educational Insight Key Observations:
🔴 Strong Support Zone (3,278 – 3,299 USD)
This zone has been highlighted as a key institutional level where buyers have consistently stepped in.
It aligns with previous Breaks of Structure (BOS), confirming its historical significance.
📉 Recent Price Action:
Price is retracing from the highs of around 3,439 USD and is approaching the strong support zone again.
A possible liquidity grab near the support is anticipated before a bullish reversal.
🔄 Break of Structure (BOS):
Multiple BOS marked indicate shifts in market direction and the presence of aggressive buying/selling phases.
These BOS events help identify trend continuation or reversal points.
🟢 Bullish Fair Value Gap (FVG):
A bullish FVG is present, indicating imbalance in price movement where institutions may look to fill orders.
Price previously reacted positively to this zone, indicating unfilled demand.
📈 Target Area:
A clearly marked target at 3,440.487 USD, which aligns with Buy-Side Liquidity, suggests a potential liquidity run.
This implies smart money may drive price upwards after collecting liquidity below support.
Volume Profile (VRVP):
The horizontal volume bars show the highest traded volume areas, providing confirmation for key support zones and BOS reactions.
🧠 Educational Insights:
BOS (Break of Structure) is used by institutional traders to spot shifts in trend. It typically signals continuation or reversal when aligned with liquidity concepts.
Liquidity Zones (like buy-side or sell-side liquidity) often serve as magnets for price; smart money aims to trigger orders and trap retail traders.
Fair Value Gaps represent imbalances where price moved too fast; institutions may return to these zones to execute pending orders.
Volume Profile Analysis helps in understanding where the most buying/selling occurred—confirming support and resistance zones.
📌 Strategy Suggestion (For Learning Only):
Entry Idea: Wait for price to tap the strong support (ideally sweep liquidity slightly below).
Confirmation: Look for bullish engulfing or BOS on lower timeframe to confirm reversal.
Target: 3,440 area where buy-side liquidity resides.
Stop Loss: Below the strong support (near 3,270 level) to protect against deeper liquidity grabs.
📢 Disclaimer (Educational Use Only):
This analysis is for educational purposes and not financial advice. Trading involves significant risk; always do your own research or consult a financial advisor.

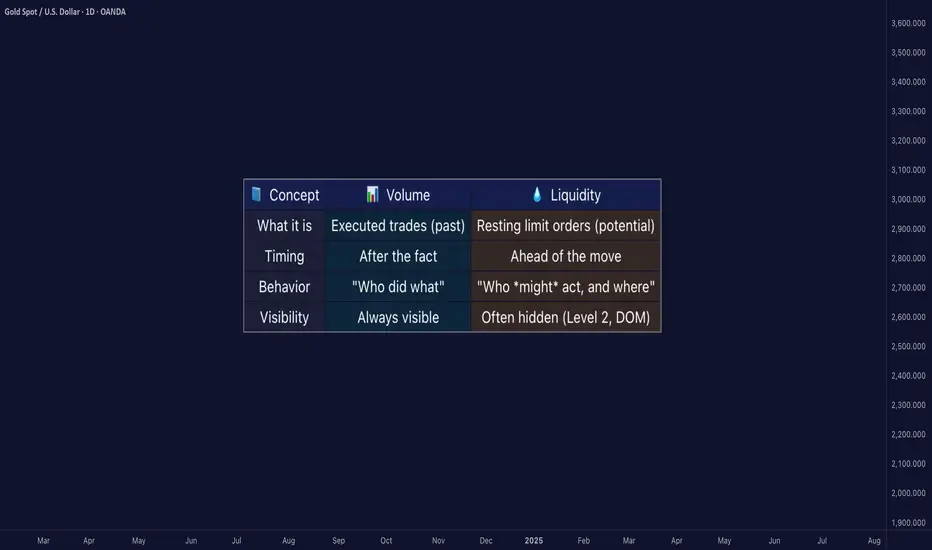
Liquidity ≠ Volume: The Truth Most Traders Never Learn█ Liquidity ≠ Volume: The Truth Most Traders Never Learn
Most traders obsess over volume bars, but volume is the footprint, not the path forward.
If you’ve ever seen price explode with no volume or fail despite strong volume, you’ve witnessed liquidity in action.
█ Here’s what you need to know
⚪ Volume Is Reactive — Liquidity Is Predictive
Volume tells you what happened.
Liquidity tells you what can happen.
█ Scenario 1: Price Jumps on Low Volume
❝ A price can jump on low volume if no liquidity exists above.❞
⚪ What’s happening?
The order book is thin above the current price (i.e., few or no sellers).
Even a small market buy order clears out available asks and pushes price up multiple levels.
Volume is low, but the impact is high because there’s no resistance.
⚪ Implication:
This is called a liquidity vacuum.
It can happen before news, during rebalancing, before session openings, on illiquid instruments, or during off-hours.
Traders often overestimate the strength of the move because they only see the candle, not the absence of offers behind it.
█ Scenario 2: Move Fails on High Volume
❝ A move can fail on high volume if it runs into a wall of offers or bids.❞
⚪ What’s happening?
There’s a strong surge of aggressive buying or selling (high volume).
But the order book has deep liquidity at that level — large resting limit orders.
The aggressive traders can’t chew through the liquidity wall, and price stalls or reverses.
⚪ Implication:
This is called liquidity absorption.
Market makers or institutions may intentionally absorb flow to stop a breakout.
Many retail traders mistake this for “fakeouts,” but it’s really liquidity defending a level.
⚪ What the Research Says
Cont, Stoikov, Talreja (2014): Price responds more to order book imbalance than trade volume.
Bouchaud et al. (2009): Liquidity gaps, not trade size, are what truly move markets.
Hasbrouck (1991): Trades only impact price if they consume liquidity.
Institutions don’t chase candles — they model depth, imbalance, and liquidity resilience.
⚪ Where the Alpha Lives
Liquidity tells you where the market is weak, strong, or vulnerable — before price moves.
Fakeouts happen in thin books.
Reversals occur at hidden walls of liquidity.
Breakouts sustain when liquidity follows the price, not pulls away.
If you understand this, you can:
Enter before volume shows up
Avoid chasing dead breakouts
Fade failed moves into empty space
█ Final Truth
Volume is the echo. Liquidity is the terrain. Alpha is in reading the terrain. You want to study the structure, because price moves toward weakness and away from strength. Learn to see where liquidity is, or where it’s missing, and you’ll see trading with new eyes.
-----------------
Disclaimer
The content provided in my scripts, indicators, ideas, algorithms, and systems is for educational and informational purposes only. It does not constitute financial advice, investment recommendations, or a solicitation to buy or sell any financial instruments. I will not accept liability for any loss or damage, including without limitation any loss of profit, which may arise directly or indirectly from the use of or reliance on such information.
All investments involve risk, and the past performance of a security, industry, sector, market, financial product, trading strategy, backtest, or individual's trading does not guarantee future results or returns. Investors are fully responsible for any investment decisions they make. Such decisions should be based solely on an evaluation of their financial circumstances, investment objectives, risk tolerance, and liquidity needs.
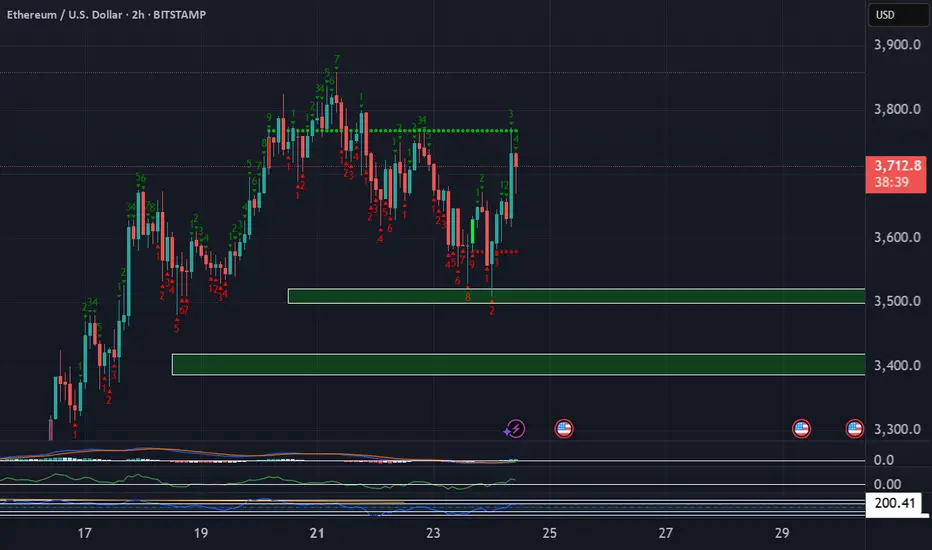
Ethereum Long These zones are significant because they represent areas where large institutions and professional traders are likely to be active, potentially causing strong price movements when those orders are triggered. We want to enter trades that have minimal drawdown to maximize our buying power.
GOLD Rejected from Reversal Zone – Retest + Bounced & Major High📌 1. Major High & Liquidity Grab
The chart starts by showing a strong impulsive move toward the upside that taps into a Major High zone (highlighted at the top). This is a classic MMC "liquidity grab" where price sweeps the previous high to trigger stop losses and collect orders before reversing. This is a common trap zone where retail traders get caught in FOMO buys.
📌 2. Reversal Area Identified
The price entered a clearly marked Reversal Area between $3,430 – $3,445. This zone acted as:
Historical supply area
Psychological resistance
Liquidity hunt zone
Upon entry, strong rejection candles formed, signaling institutional sell pressure. This reaction aligns with MMC principles where reversal is expected post-liquidity collection from major highs.
📌 3. Parabolic Curve Formation – Bullish Impulse
A beautifully formed parabolic curve (Black Mind Curve) supported the bullish rally from around $3,310 up toward the high. This shows accumulation → breakout → expansion. However, the curve has now been broken, suggesting that bullish momentum is weakening.
⚠️ This break of curve support is critical — it often leads to a corrective phase or a deeper retracement.
📌 4. Mini Reversal Zone + SR Interchange Zone
Price has now pulled back to a very important area: the Mini Reversal Zone + SR Flip Zone around $3,400. This zone previously acted as resistance and now has the potential to act as support (classic SR interchange).
According to MMC concepts:
If this zone holds → we may see a bullish bounce and potential re-test of the upper reversal area.
If this zone breaks → bears will likely push price toward the next demand level around $3,350 – $3,340.
This is the decision point — a “battlefield” zone where market direction can be decided.
📌 5. Potential Scenarios Ahead:
✅ Bullish Scenario:
Price respects the SR zone ($3,400)
Forms bullish engulfing / continuation pattern
Likely target: re-test of reversal zone ($3,430–$3,445)
Beyond that: breakout possible if volume supports it
❌ Bearish Scenario:
Price breaks below $3,395 with strong bearish candles
Could confirm the rejection from the major high and trigger a full retracement
Downside targets: $3,360 → $3,340 range
🔑 Final Thoughts:
This GOLD setup is a perfect case of MMC theory in action — liquidity grab at the top, rejection at reversal zone, curve break, and now testing critical SR flip area.
Keep an eye on:
Candlestick behavior at the SR zone
Volume confirmation
Momentum indicators (if using)
Wait for confirmation before jumping in — let the market reveal its hand at the decision zone.

Smart Money Concepts in Action: XAUUSD Tests Strong Resistance Market Context and Structure
On the 1-hour chart, XAUUSD (Gold) has been in a bullish market structure, forming consecutive Breaks of Structure (BOS)—a clear sign of buying pressure and upward momentum. These BOS points mark moments when the market forms new highs, confirming bullish continuation.
However, as price approaches the 3370–3380 zone, it reaches a well-defined resistance/supply area. This zone has previously rejected price and can be viewed as a region where institutional selling may occur.
🧠 Smart Money and Liquidity Concepts
From a Smart Money Concepts (SMC) perspective, price often moves to areas of liquidity—zones where buy stops (above highs) or sell stops (below lows) are collected. In this chart:
Price pushes up towards 3370, potentially grabbing liquidity above recent highs.
This move could be a liquidity sweep, where the market fakes a breakout to trap retail traders before reversing.
Such behavior often occurs near institutional zones, suggesting a possible distribution phase—where large players offload positions before a move in the opposite direction.
⚙️ Resistance Analysis: Why 3370 Matters
The 3370–3380 area has acted as a ceiling in the past.
Price is currently reacting near this level, showing early signs of rejection.
This zone aligns with previous order blocks, where institutions may have placed sell orders.
In educational terms, this shows how supply zones can act as natural turning points in a market, especially when price approaches them after an extended move.
📦 Support & Potential Downside
If a reversal happens from this resistance, the next key support zone lies between 3300–3320. This level has historically acted as demand and could be revisited for price rebalancing or order filling.
📝 Educational Summary
This XAUUSD chart provides a great learning opportunity in observing:
How Break of Structure (BOS) confirms trend direction.
The role of liquidity zones in trapping retail traders.
How smart money operates around key levels like 3370.
The importance of combining structure, zones, and reaction for confluence.

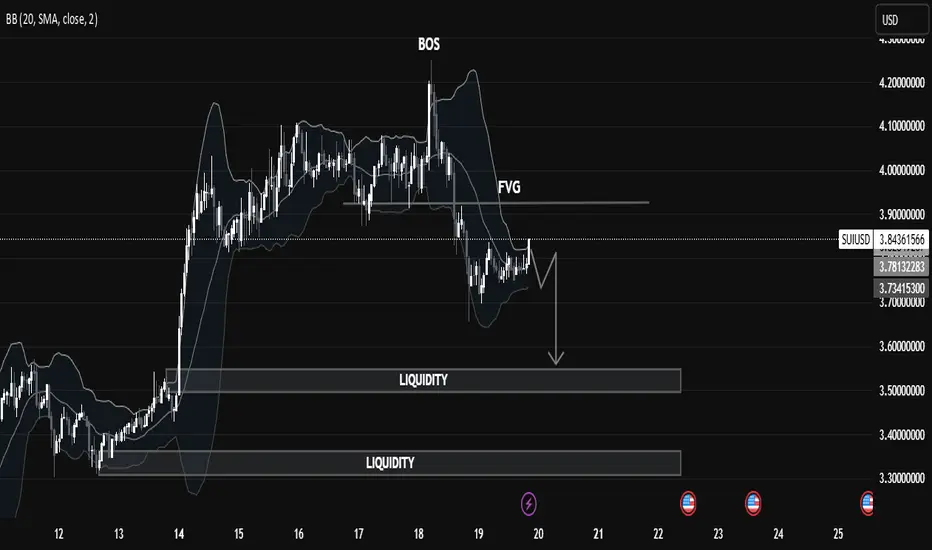
SUIUSD Liquidity Trap in Motion: Price Targeting Deeper Pools🧠 Market Structure Insight (SMC Framework)
🔍 1. Break of Structure (BOS):
The most recent BOS around the $3.95 level marked a bull trap, indicating a transition from bullish momentum to a distribution phase. This suggests institutional players offloaded liquidity at premium prices before initiating a markdown.
🕳️ 2. FVG (Fair Value Gap):
A visible Fair Value Gap (Imbalance) remains unmitigated above the current price action. This zone acted as a supply area, where price sharply moved down, leaving inefficiency in its trail—now serving as a potential point of rejection if revisited.
📌 Liquidity Zones:
Upper Liquidity Cleared: Price has swept highs before reversal (a sign of engineered liquidity grab).
Double Liquidity Pools Below:
First pool: Around $3.55 - $3.60
Second pool: Deep liquidity around $3.30 - $3.35
These levels are highly attractive for Smart Money to target next, suggesting continuation to the downside.
📉 Current Price Behavior:
Market is consolidating in a tight range just below FVG, signaling potential re-accumulation of sell orders.
The chart pattern suggests a potential lower high forming, likely to precede a bearish leg towards liquidity zones.
Bollinger Bands show compression, hinting at volatility expansion soon.
🎯 Trade Outlook (Not Financial Advice):
🔻 Bearish Bias:
Unless price breaks above the FVG zone with strong bullish momentum, the probability favors a bearish continuation targeting:
1st Target: ~$3.55
2nd Target (Deeper liquidity grab): ~$3.30
A rejection from FVG followed by a BOS to the downside would serve as confirmation for this bias.
📚 Educational Takeaway:
This chart is a clean illustration of Smart Money Concepts in play:
BOS > FVG > Liquidity Sweep
Price respects institutional footprints: grab liquidity, fill imbalances, then drive toward untouched liquidity zones.
Recognize market intent through structure shifts and imbalance reaction.
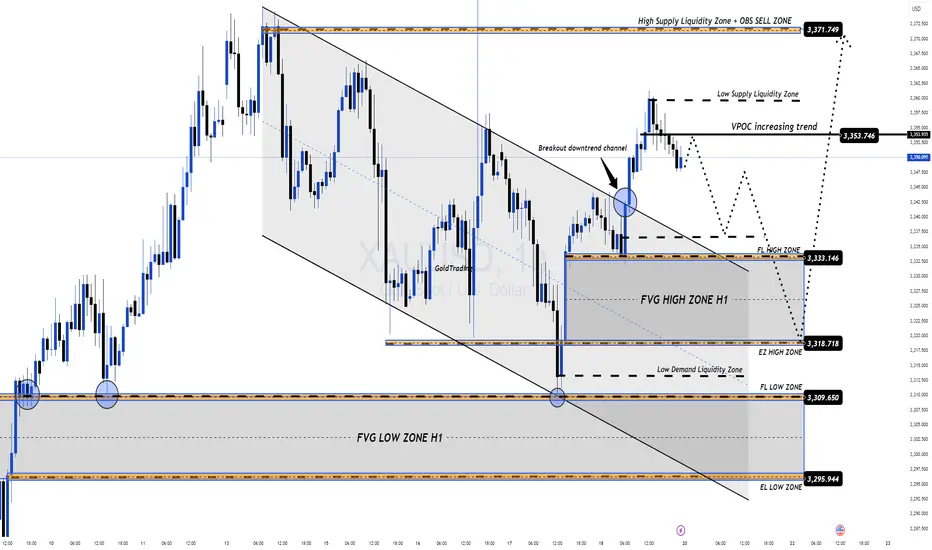
GOLD OUTLOOK – READY FOR THE NEW TRADING WEEK (JULY 21–25)GOLD OUTLOOK – READY FOR THE NEW TRADING WEEK (JULY 21–25)
🟡 Market Recap:
Gold made a strong bullish reversal at the end of last week, following a liquidity sweep at the FVG ZONE 3310. Price surged quickly toward the OBS SELL ZONE around 335x–336x.
However, by Friday’s close, price reacted to multiple confluences (OBS + FIBO zones) and closed below the VPOC level in the recent uptrend – forming a potential short-term top.
📉 Outlook for July 21–25:
No major economic data expected next week.
However, geopolitical tensions and trade policy concerns (e.g. tariffs, military conflicts) will be the key catalysts.
These events could lead to high volatility and liquidity grabs across the board.
🧠 Technical Perspective – H1 Mid-Term View:
Gold continues to form multiple unfilled Fair Value Gaps (FVGs) after strong bullish moves.
Recent price action created new high-zone FVGs, but lower FVGs remain untested.
🔁 Expected scenario: A potential retracement to fill the lower FVG zones (3310/3305), followed by another bullish leg.
📍Trading Strategy:
Wait for price to retrace into FVG Low Zones.
Look for early BUY setups at confluence areas:
CP zones
FIBO retracement levels
Volume/Price reaction zones
🎯 Target Outlook:
Bullish targets around 333x – 336x remain valid.
If price sustains momentum after pullback, we may aim for Buy Side Liquidity near 3371.749.
✅ Key Reminders:
Avoid chasing highs (FOMO).
Stick to proper TP/SL rules, especially with headline-driven markets next week.
🎉 Wishing you a relaxing weekend – recharge and get ready to conquer the markets next week!
🚀 GOD BLESS ALL
NZD/USD Technical Analysis | Smart Money Perspective🧠 NZD/USD Technical Analysis | Smart Money Perspective
On the current NZD/USD chart, price is trading around 0.5960, positioned between a clearly defined resistance zone (0.6130–0.6150) and a support zone (0.5890–0.5900).
We can observe the following key technical elements:
🔹 1. Liquidity Sweep
Price recently broke below the previous swing low near 0.5900, tapping into a pool of sell-side liquidity. This movement is commonly interpreted as a liquidity grab, where institutions manipulate price to trigger retail stop losses before reversing.
🔹 2. Double Bottom Formation
The chart indicates a potential double bottom forming at the support level — a classic accumulation signal. This pattern suggests buyers may be stepping in after liquidity has been taken out, anticipating a reversal.
🔹 3. Fair Value Gap (FVG)
An FVG (imbalance) is visible in the range of 0.5985 to 0.6015. This inefficiency was created by a sharp bearish move, leaving price action unbalanced. Price is now expected to retrace into this area to rebalance orders — a common smart money behavior.
🔹 4. Market Structure Outlook
If the double bottom confirms with a bullish break of structure above 0.5980, we could expect a continuation toward:
First Target: FVG zone around 0.6015
Second Target: Major resistance near 0.6150, where past distribution occurred.
✅ Conclusion
This setup combines key smart money concepts:
Liquidity grab below support
Accumulation phase at demand
FVG as target
Potential bullish market structure shift
Traders should monitor price action around the support zone for confirmation (e.g., bullish engulfing or break of short-term highs) before entering long positions. Targets remain at the FVG and resistance zones, but risk management is essential in case of a deeper sweep or macroeconomic catalyst.

NASDAQ Bullish Play into Liquidity Before Potential ReversalForecast:
NOTE: At this moment, this is a forecast and trades will be taken dependent on live PA.
Price has reacted strongly off the 21,410–21,430 Daily Order Block, suggesting bullish intent. If bullish structure holds, I expect a move into the 22,060–22,130 liquidity zone, where sell-side setups could form.
This is a classic Buy to Sell model:
Buy from OB at ~21,420
Target liquidity above recent highs (~22,100+)
Look for shorts after sweep into 22,130–22,220 range
Invalidation: Break and close below 21,410 suggests the OB failed — potential deeper drop toward 20,700.

Mastering Liquidity Dynamics: Understand the Dynamic True ValueDear Reader,
Thank you for reading—your time is valuable.
Use the chart's zoom-in/out (-/+) function for better visibility. This chart captures a large sample for your evaluation.
Below is the manual detailing the Smart Farmer System —a Dynamic True Value framework derived from real-time data to anticipate market intent and liquidity behavior .
If this resonates with you, drop a comment below— constructive insights are always welcome .
The Dynamic True Value - a Smart Farmer System: Terminology and Mechanics
: For now, I have firmed up POC - Price of Control, VAP - Value Average Pricing, SULB - Sell Upper Limit Bound, BLLB - Buy Lower Limit Bound.
Mechanic:
POC - Where fair value price dynamic is read.
VAP - Trading above indicates bullish sentiment of the cycle, and the opposite for bearish sentiment.
A crossed over of:
Grey POC above Green VAP - Signaling distribution, accumulation, consolidation, build-ups, correction, retracement .
Green VAP above Grey POC - Bullish strength and momentum consistency .
Pink VAP above Black POC - Bearish strength and momentum consistency .
Flip of Pink VAP to Green VAP - Sentiment flips from bear to bull, and the same goes for green flip to pink showing bull to bear.
Validation of entry signals requires:
Signal's candle must close past the opposite side of POC – flip sentiment .
The confirmation candle (is the closed next candle immediately after entry signal candle) must continue closed past the POC – maintain sentiment .
The progress candle (is the next candle closed right after the Confirmation Candle) shows traction, momentum build-up, and volume consistency .
Hint of invalidation:
Signal's candle is considered void if the next candle prints a new entry signal in the opposite direction. This often signals accumulation, sideways movement, build-up, uncertainty, or swings in range .
The immediate next candle closed past POC to the opposite side.
What to understand about Liquidity Trap, SULB, and BLLB:
Liquidity traps
Often occur at the recent/previous flatlines of Dynamic True Value (POC, VAP, SULB, BLLB) .
It is worth paying attention to the market’s intent and institutional positioning.
Signs of exhaustion, absorption, inducement, offloading, and accumulation are visible in the M1 (one-minute) TF, with significant confluence near the previous/recent flatlines of Dynamic True Value in the higher/macro-TFs.
An Anchored VWAP tool can be helpful for filtering noise in the market. This tool can be found in the drawing tab in the TradingView platform.
SULB
Details the dynamic of upper resistance where Bears remain in control below the dynamic level.
Below this limit bound (LB) , bears show strength – bear sentiment .
A converging price toward this LB indicates bulls are present.
Moving past this LB (a candle closed above) and successfully RETESTING newly formed support indicates a confirmed directional shift . Followed by printing a new BLLB in the next following candles with price continuing to rise above this failed SULB.
A rejection below LB (a rejection/exhausted candle closed below LB) and successful RETEST reaffirms the resistance holds , indicating downside continuation .
BLLB
Details the dynamic of lower support where Bulls remain in control above the dynamic level.
Above this LB, bulls show strength – bull sentiment .
A converging price toward this LB signifies bears are present.
Moving past this LB (a candle closed below) and successfully RETESTING newly formed resistance indicates a confirmed directional shift . Followed by printing a new SULB in the next following candles with price continuing to push lower below this failed BLLB.
A rejection above LB (a rejection/exhausted candle closed above LB) and successful RETEST reaffirms the support holds , indicating upward continuation .
Important Notes:
Select preferred Entry’s Signal TF (ex. M3 TF, M5 TF for scalping strategy, M15 for intraday/daily strategy, 4H TF for day-to-weekly strategy, etc.).
Always refer to the selected Entry’s TF for trading progress. Anticipate TP and SL by watching the range in this TF.
Non-entry TFs are not for entry purposes. These multi-TFs are used for measuring strength, momentum, liquidity, positioning, structure – The market intends . The Non-entry TF is used to anticipate institutional executions and liquidity pools.
These criteria MUST BE MET. A failed criterion suggests vague execution. Be patient and wait for clear validations.
Institutions excel in creating illusions.
SFS is designed to stand ready, calm, and execute with Clarity.
SFS cuts through noise, distraction, and stays independent of NEWS, GEOPOLITIC, RUMORS, and herd mentality because all these are designed to mislead retail traders into institutional traps.
When we see such ambiguity against the criteria, we know not to fall into the TRAP and become the liquidity FUEL.
Stay sharp, only respond when signals are firmed. SFS is designed to counter Smart Money capitalism. It is about time to level the playing field.

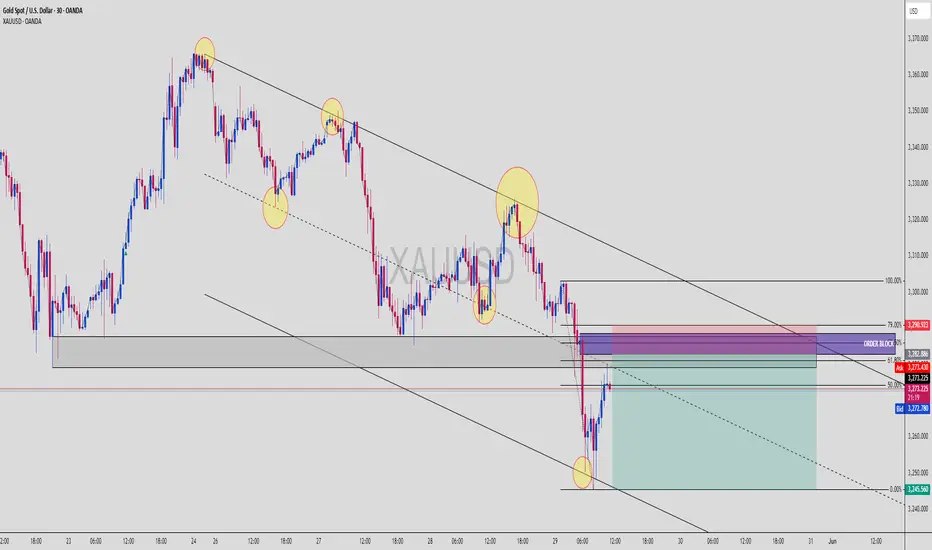
XAUUSD Gold Short: Premium Tap Into OB + Reversal Loading XAUUSD (30-Min) | Premium Rejection + Order Block + Fib Stack for Intraday Short
This GOLD setup is a surgical-grade short play — combining institutional Order Block, Fibonacci Premium Levels, and liquidity rejection for a high RRR sniper entry.
🔍 Smart Money Setup Breakdown:
🔴 Bearish Order Block Zone (OB)
Strong bearish engulfing forms OB between 3,312.949 and 3,319.292
Price is currently reacting off 70.5% – 79% Fib zone — a premium region
Bears defending aggressively as price fails to break above
📐 Fibonacci Confluence
Fib drawn from recent swing high to swing low
Price retraced cleanly into 70.5% – 100% range
Current rejection forming just under 79% Fib at 3,312.949
OB + Fib = sniper confluence
📉 Bearish Reversal Behavior
Candle structure shows bullish exhaustion
Wicks into premium followed by strong rejections
Upcoming bearish candle could confirm shift in momentum
🎯 Target Zones Based on Fib Extensions
50%: 3,306.000
0% (Full move): 3,293.500
Extended TP: 3,288.000 for deeper draw
🧠 Chart Ninja Entry Plan:
🔹 Entry Zone 3,311.510 – 3,312.949 (OB + Premium zone)
🔻 SL Above 3,319.292 (above 100% + OB high)
📉 TP 1 3,306.000 (mid move)
📉 TP 2 3,293.500 (measured move)
⚖️ RRR Estimated 1:4+ depending on execution precision
🧠 Chart Ninja Wisdom:
"Gold respects the money, not the noise. If you know where Smart Money hides,
you’ll always catch the move before the herd even blinks." 🥷✨
🔁 Bonus Insight:
You can clearly see the liquidity engineered below 3,308 and resting near 3,293.5. Price may wick these areas fast, so set alerts or stagger TPs if you’re managing this intraday.
🚨 Chart this setup and watch for the breakdown confirmation
💬 What’s your SL placement for this? Drop it in the comments

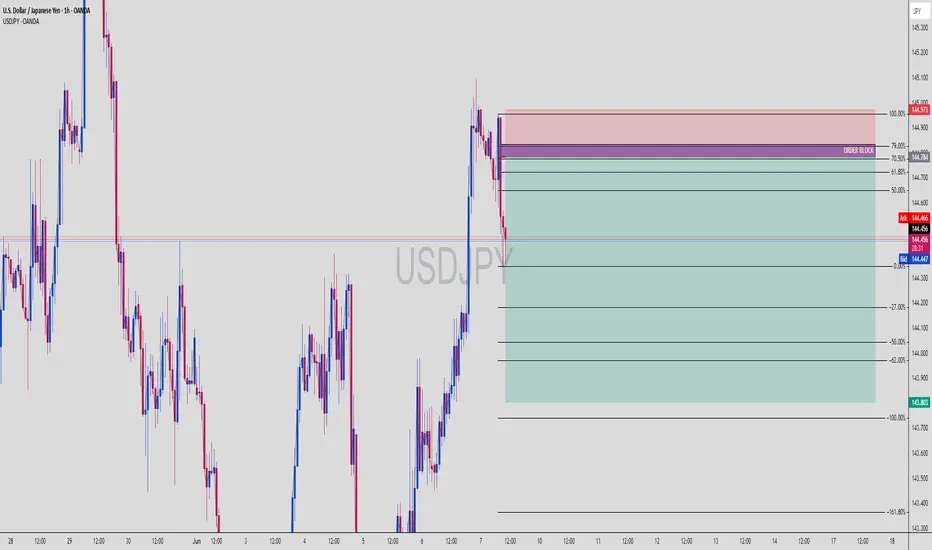
USDJPY Short Setup: OB Rejection + Fib Premium Sell-Off IncomingUSDJPY (1H Chart) | Institutional Short Setup with OB + Fib Confluence
The market is showing clear Smart Money Distribution behavior — with a rejection from a high-confluence zone combining Order Block, Premium Fib Levels, and bearish momentum shift.
🔍 Smart Money Setup Breakdown:
🔻 Bearish Order Block Zone (OB)
Price wicked into OB zone and got instantly rejected
OB located precisely at the 70.5% – 79% premium range
Mark of institutional sell-side interest
📐 Fibonacci Retracement + Premium Zone
Retracement from swing high (144.973) to swing low (144.436)
Premium zone between 61.8% to 79% aligns with OB (144.700–144.973)
Entry taken from this zone for high-probability sell setup
📉 Bearish Confirmation
Aggressive bearish reaction post-OB tap
Market structure flipping bearish
Momentum candle breaks previous bullish leg
🔻 Target Zones (Measured Fib Extensions)
-27%: 144.200
-62%: 144.000
-100%: 143.803
-161.8%: 143.300 (extended liquidity draw)
🧠 Chart Ninja Entry Plan:
🔹 Entry Zone 144.784 – 144.973 (OB + Premium Fib + FVG rejection)
🔻 SL Above 145.000 (above OB wick)
📉 TP 1 144.200 (first fib extension)
📉 TP 2 143.803 (full -100% extension)
⚖️ RRR Approx. 1:4+ — stealthy sniper precision
💬 Pro Tip from the Ninja Dojo:
The market doesn’t move because of indicators — it moves because of liquidity.
Find the OB. Wait for the imbalance. Strike where Smart Money hides. 🥷📊
This isn’t retail — this is calculated execution.
🎯 Save this chart before price melts to 143.8
💬 Drop your entry zone & SL idea in comments
BTCUSD Breakdown from Pennant – MMC Structure Analysis + Target🧠 Introduction: Why This Chart Matters
Bitcoin recently provided a textbook example of market manipulation, where the price action formed a bullish-looking pattern (Pennant), trapped traders with a fake breakout, and then reversed strongly to the downside. By using Mirror Market Concepts (MMC), we can clearly see the logic behind this move—how the market mirrored a previous pattern and fulfilled a predictable target zone.
This analysis breaks it all down, step-by-step, for both educational and practical trading purposes.
🔍 Detailed Chart Breakdown:
1️⃣ The Illusion – Bullish Pennant Formation
Initially, BTC/USD formed what looked like a bullish pennant—a common continuation pattern in technical analysis. The pattern appeared after a sharp upward move, followed by converging trendlines suggesting consolidation.
Retail traders often anticipate a breakout above the pennant as a sign of bullish continuation. This is where the trap begins.
Why It’s a Trap: The pattern looked clean and reliable—but the context told another story. This move was designed to lure breakout traders into long positions right before a reversal.
2️⃣ The Fakeout – Liquidity Grab Above the Pattern
Shortly after the pennant formed, price pushed above the upper trendline, triggering breakout entries and stop losses of short-sellers. But instead of continuing up:
The price reversed sharply.
This aggressive move confirmed the fakeout.
This is a classic example of a liquidity hunt, where the market moves briefly in one direction to gather orders before executing the real move.
📌 MMC Insight: This behavior mirrors a prior setup—price previously faked upward, then dropped to a key demand zone. The mirror pattern gives a clue that the same outcome might repeat.
3️⃣ CHoCH – Change of Character Confirmed
After the fakeout, BTC broke below a key internal support and trendline structure, signaling a CHoCH (Change of Character)—a shift from bullish to bearish market control.
This moment is crucial:
It confirms the smart money’s intention.
It signals that the previous bullish move was just a setup.
Sellers now have control.
💡 Pro Tip: CHoCH is one of the earliest and most reliable signs of a reversal when combined with liquidity patterns.
4️⃣ Trendline Break & Structural Sell-Off
The break of the trendline following CHoCH solidified the bearish direction. This was the best confirmation-based entry point, as the structure flipped and began forming lower highs and lower lows.
5️⃣ Target Fulfilled – Previous Demand Zone Hit
The price then continued down aggressively and hit the marked MMC target zone. This area coincided with:
A previous demand zone (where buyers stepped in before).
A Mirror Market reversal point, seen earlier in the chart.
This fulfillment of the MMC target validates the entire analysis—from trap to reversal to target.
🎯 Key Zones:
Fakeout High: $69,600 area (liquidity sweep)
CHoCH Break Level: Around $69,100
Trendline Break Confirmation: $69,000
Final Target Zone: $68,500–$68,700
📈 Trading Strategy Recap:
Entry Idea: Enter short after CHoCH and trendline break
Stop Loss: Above fakeout high ($69,600+)
Take Profit: MMC demand zone ($68,500–$68,700)
This trade offered excellent risk-to-reward and confluence using multiple tools (MMC, CHoCH, structure, liquidity sweep).
🧠 What You Can Learn from This Setup:
Patterns Can Lie: A pattern like a pennant isn’t enough—context is key.
Liquidity Is King: Understand where the market needs to go to collect orders.
Mirror Market Concepts Work: Historical behavior often repeats in reverse. Use MMC to forecast likely outcomes.
CHoCH is Powerful: It's your early alert system for trend changes.
🔎 Final Thoughts:
This BTC/USD chart is a powerful example of how smart money operates—with manipulation, pattern traps, and mirrored market behavior. If you’re a price action trader or use MMC, this breakdown is a must-study.
Don't just trade patterns—trade context. Look for traps. Use MMC. Watch CHoCH. And always have a mapped target based on structure.

BTCUSDT Market Analysis UpdateBINANCE:BTCUSDT Hi everyone, I hope you are doing well and I have put my opinion in Bitcoin price on the chart for you. and hope this helps you! Simple, concise, useful
Bitcoin (BTCUSDT) has broken below a key trendline, and we are now seeing a potential retracement towards a demand zone around $66,771.5, which could act as a strong support level.
Breakdown & Retest: BTC has fallen below a significant trendline, confirming a bearish move. A possible retest of this zone before further decline is likely.
Long Entry Consideration: If price stabilizes and shows bullish confirmation at the highlighted demand zone, it could provide a strong long opportunity.
Bearish Scenario: A clean breakdown of this level could signal further downside potential, requiring caution before entering long positions.
RSI Oversold? The RSI is showing a potential reversal area, but confirmation is key before making any trades.
📉 Waiting for confirmation before entering!
Let me know your thoughts in the comments!
Best regards

XAUUSD Rejection from Fib + OB Combo | Bearish Continuation?XAUUSD | Premium Smart Money Short Setup 🎯
This GOLD setup is a straight-up institutional-grade bearish continuation. Let’s break down why this is a high-probability short for Smart Money Traders.
🔍 1. Market Context
Price is trending inside a clear descending channel, tapping into the lower boundary and now pulling back.
We just had a reaction from the mid-supply zone, and price is now rebalancing into the Order Block (OB) aligned with:
🔻 79% Fibonacci Retracement
🔻 Previous Structure Break
🔻 OB + imbalance fill zone
🧱 2. Bearish Confluences
📉 Descending Channel = bearish structure
🟣 Order Block Zone = high-value area for institutional entries
📐 Fibonacci Levels = 61.8%, 70.5%, and 79% all stacked
💥 OB + 79% = high-prob sniper short
🕳 Imbalance + Liquidity Sweep = likely short continuation
🎯 3. Trade Idea
Entry: 3282.00–3290.00 (OB + 79% Fib)
Stop Loss: 3294.00 (above OB wick)
Take Profit: 3245.00 zone (channel bottom)
Perfect RR setup 👇
⚖️ 4. RRR (Risk-Reward Ratio)
💰 Entry: ~3285
🔒 SL: ~3294
📍 TP: ~3245
✅ RRR ≈ 1:4.3 = sniper level swing short 🎯
🧠 5. Smart Money Logic
Liquidity Sweep above minor high before short = engineered trap
OB reaction at fib premium zone = smart entry
Continuation expected unless price closes above 3295
📌 Save this chart — this is Smart Money flow in action
💬 Drop “Gold OB SMC 🔥” in comments if you saw this coming
🔁 Repost to help fellow traders master fib+OB sniper entries
AUDJPY Short Setup – Fair Value Gap + 61.8% Precision Tap📊 AUDJPY | 1H Bearish Setup Breakdown (SMC Perspective)
This is a clean setup for sniper traders 🧠 — a perfect blend of FVG, Fib retracement, and a reaction from Smart Money zones. Let’s dig in:
🔻 1. Macro Context: Bearish Bias
Market structure is still bearish, with lower highs and lows
Price just completed a correction phase
We're seeing price react at a high probability distribution zone
🟪 2. Confluence Zones: FVG + Fib
📌 Fair Value Gap (FVG) – Price has just tapped into the FVG between 92.92 and 93.12
📌 61.8% Fib Level – Price perfectly aligns with golden pocket zone
📌 OB Above – Strong bearish order block lies around 93.60, with a Strong High marking retail’s target stop area
This stack of confluences makes this zone ripe for a short entry.
💣 3. Entry Logic
Entry was triggered after a clean tap into the FVG zone
Price shows signs of rejection with long upper wicks and slowing momentum
Ideal Smart Money scenario: Price mitigates FVG, avoids OB sweep (for now), and targets internal liquidity
🎯 4. Target Zone
TP = 91.651
Clean equal lows and imbalance just above
Channel midpoint & liquidity resting below
Matches 0% Fib level on the move
⚖️ 5. Trade Setup
📍 Entry: 92.926
🔐 Stop Loss: ~93.390 (above FVG + structural high)
🎯 Target: 91.651
🧮 Risk-to-Reward Ratio: ~1:4.5+
🧠 Smart Money Flow
Retail longs are eyeing a break above that “Strong High” — but Smart Money will likely:
Tap into FVG
Drive price down for a liquidity grab
Possibly retest or sweep OB after internal liquidity is cleared
💬 Drop “FVG ZONE SNIPED 🧨” if you took the entry
🧠 Save this post to study FVG + Fib reactions
👀 Tag your trading buddy who needs to level up their confluence game

USDJPY | Smart Money Long Setup – Deep Fib + OB Reaction💴 USDJPY | Institutional Long Play with Perfect OB + Fib Confluence
Price gave us an aggressive push off the demand zone, showing clear Smart Money accumulation behavior. This setup is high probability based on Smart Money Concepts (SMC).
🔍 1. Technical Breakdown
Strong impulse move upward
Clean pullback into the Order Block
Confluence with 70.5%–79% Fibonacci retracement zone
Price respected the OB zone and printed higher highs
That reaction was institutional — no cap 🧢.
🧱 2. Bullish Confluences
🔥 Order Block (OB): Purple demand zone = unmitigated
📐 Fib Sweet Spot: 70.5%–79% = institutional re-entry levels
✅ Strong Wick Rejection: Shows absorption of sell-side liquidity
📈 Market Structure Shift: Break of structure to the upside
🎯 3. Trade Plan
Entry: 142.89 (within OB + 70.5%)
Stop Loss: 142.00
Take Profit: 145.49 zone
This setup targets the -27% fib extension — a classic institutional TP level.
⚖️ 4. RRR (Risk-Reward Ratio)
💰 Entry: 142.89
🔒 SL: 142.00
📍 TP: 145.49
✅ RRR ≈ 1:2.9
Solid intraday-to-swing play with clean structure.
🧠 5. Key Confirmation Points
Break and close above 144.36 = confirmed bullish intent
Price respecting 143.44 OB = bulls still in control
SL below OB = protected by demand block
💬 Comment “SMC Long Sniper 💹” if you caught this move!
🔄 Share this if you love OB + fib sniper entries
📌 Save this setup for your next demand zone playbook

XAUUSD | Institutional Sell Setup – OB + 79% Fib Confluence🪙 XAUUSD | Gold Sell Setup Based on Smart Money Concepts
This is a classic example of how institutions lure in retail traders — tap the golden zone, reject hard, and leave a trail of liquidated longs.
🔍 1. Technical Breakdown
Price aggressively climbed into a strong Order Block zone
Rejection from the 70.5%–79% Fibonacci retracement area
Broken ascending channel confirms shift in momentum
Bearish BOS already occurred = Smart Money in control
This zone (3332–3357) is a magnet for institutional sells.
🧱 2. Bearish Confluences
💀 OB Rejection: Previous up candle before the sharp drop
📐 Fib Overlap: 70.5–79% = premium zone for shorts
📉 Structure Shift: Channel break + bearish order flow
⚠️ No Candle Close Above OB: = market respecting supply
🎯 3. Trade Plan
Entry: 3332–3357 (executed)
Stop Loss: 3360 (above OB)
Take Profit: 3120 zone
This is a deep sell-side liquidity hunt.
⚖️ 4. RRR (Risk-Reward Ratio)
📥 Entry: ~3345
🔒 SL: 3360
💰 TP: 3120
✅ RRR ≈ 1:15
This is a "swing short with conviction" kind of setup, where patience = profit.
🔁 5. Key Confirmation Points
Watch for lower lows and lower highs to continue
Price closing below 3290 = full confirmation
If Gold reclaims 3360 = setup invalidated
💬 Comment “Sniped Gold 🥷💰” if you took this short!
📌 Save this chart for OB + Fib zone study
🎯 Post your entry/exit levels — let’s compare setups
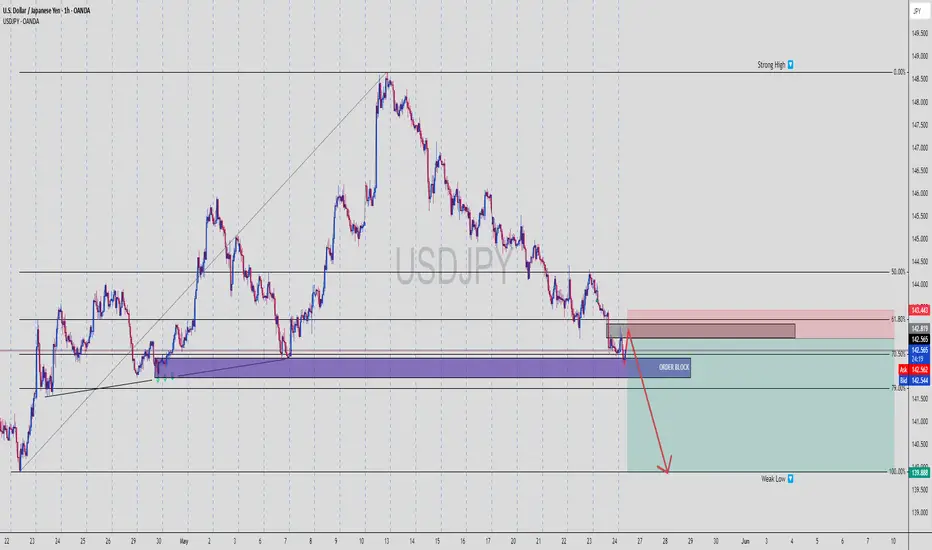
USDJPY | FVG + OB + Weak Low Target = Textbook SMC Setup📊 USDJPY | 1H Bearish Play – Smart Money In Control
We’re seeing a classic setup where price retraces into a bearish zone of confluence and prepares for a selloff toward internal liquidity. Check the breakdown:
🔻 1. Structure Shift Confirmed
Price broke structure on the downside after forming a lower high
Current move is a retracement into discount OB zone
Clear rejection is forming, signaling short momentum incoming
🟪 2. Zone Confluence
📌 Order Block (OB): Sitting just under the 61.8% Fib
📌 Fair Value Gap (FVG): Mitigated perfectly
📌 Fib Retracement: Price reacts between 61.8% and 70.5% — classic Smart Money play
📌 Previous Demand Turned Supply: This level is now acting as a rejection zone
This is stacked confluence — just how Smart Money likes to move.
💣 3. Entry Strategy
Entry Zone: 142.55 (midpoint of the OB reaction area)
Stop Loss: Above 143.443 (above OB + liquidity wick)
Take Profit: 139.888 (weak low, previous liquidity resting point)
⚖️ 4. Risk-to-Reward Ratio (RRR)
🎯 TP = 139.888
📍 Entry = 142.550
🔐 SL = 143.443
✅ RRR ≈ 1:3.5
A great example of high-probability short setup using pure Smart Money logic.
📉 5. Why This Works
Retail traders will try to long at this zone hoping for a breakout
Smart Money uses this zone to engineer liquidity
They tap into the FVG/OB, then target internal liquidity and weak lows
Clean, controlled sell-off expected down to 139.888
🧠 SMC Insights
This chart is all about liquidity engineering:
Push up into OB
Reject at premium pricing
Drive down to weak low to collect stops
Possibly reverse or continue trend from there
💬 Comment “FVG TAP + OB = 🔥” if you spotted this setup early
💾 Save it before the drop happens
📤 Share with a fellow SMC trader who needs this breakdown
BTC Short Locked – FVG + 79% Fib = Liquidity Grab Incoming📉 BTCUSD | 1H Smart Money Short – Premium Rejection in Play
Bitcoin just tapped into a nasty supply zone that aligns with:
🟥 Fair Value Gap (FVG)
🔻 79% Fibonacci Retracement
💥 Previous Breaker Block Zone
🧠 Clean Internal Liquidity sweep
🚩 Structure still bearish – no HH
🔍 1. Market Structure Breakdown
Price broke down aggressively from the top (early signs of redistribution)
We’re now retesting the FVG + OB zone
No candle close above the Strong High = still valid bearish context
🧱 2. Zone Confluence
📍 FVG (Fair Value Gap): Imbalance created during impulsive sell-off
📍 OB + Breaker: Strong resistance holding inside 70.5%–79% retracement
📍 Strong High: Still protected
📍 Weak Low: Below = prime target for liquidity sweep
Price kissed the edge of that 79% Fib and immediately rejected = 🔥 confidence for a swing short
🎯 3. Trade Plan
Entry: Around 110,800 (inside FVG zone)
Stop Loss: Above 112,400 (Strong High)
Take Profit: 105,248 (below Weak Low liquidity)
⚖️ 4. RRR (Risk-Reward Ratio)
📥 Entry: 110,800
🔒 SL: 112,400
💰 TP: 105,248
✅ RRR ≈ 1:3.5
Solid asymmetric setup with clearly defined structure, inducement, and imbalance = Smart Money textbook trade.
📉 5. Why This Works
Retail longs are entering late = exit liquidity for big players
Price filled the FVG but failed to break structure
Weak low below is clean AF, likely to be swept for continuation
1H/4H alignment = high conviction short
💬 Type "SHORTED BTC 💥" if you saw this setup before the drop!
📌 Bookmark this – confluence stacking is how you win consistently
👊 Share this with someone still buying the top 📈🙃

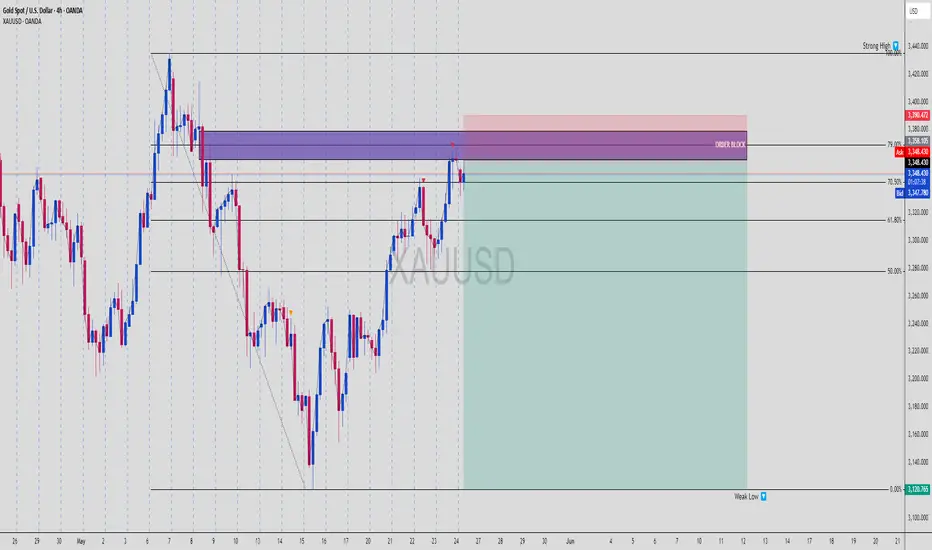
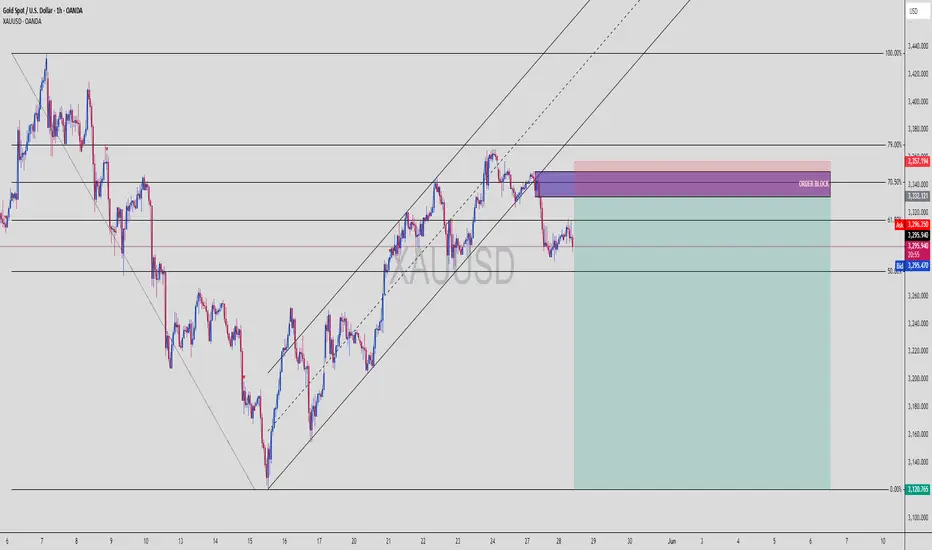
GOLD Short Setup – OB Rejection + FVG Play to Weak Low 📉 XAUUSD | 4H Short Setup – Classic Smart Money Reversal Zone
Gold is giving us a prime reversal opportunity off a stacked supply zone, aligning with:
🔵 79% Fibonacci Retracement
🟪 High-Timeframe Order Block (OB)
🚫 Failure to create a new high (bearish intent confirmed)
Let’s break it down:
🔻 1. Price Structure Insight
Clean swing high printed near 3400
Retraced down to a discount zone, then sharply reversed
Price now tapping into a premium supply zone between 70.5% – 79% Fib
🟣 2. Key Zone Confluence
📍 Order Block: The final up-candle before a massive drop = institutional sell zone
📍 Fibonacci Levels: 70.5%–79% = premium sell levels
📍 Internal Liquidity: Price swept local highs before stalling
📍 Strong High Above: Untouched = inducement for future sweep (or rejection fuel)
Everything screams Smart Money Sell Setup 📉
🎯 3. Trade Idea
Sell Entry: Around 3,348
Stop Loss: Above OB & Strong High ~ 3,390
Take Profit: 3,120 (clear weak low = liquidity pool)
⚖️ 4. Risk-Reward Ratio (RRR)
📥 Entry: 3,348
🔒 SL: 3,390
💰 TP: 3,120
✅ RRR ≈ 1:5.4
Perfect textbook SMC setup—high confluence + asymmetric RRR = 🔑
🧠 5. Why This Setup Works
Retail traders are lured into longs after bullish push
Smart Money taps OB, rejects hard at premium
Target: internal liquidity resting at weak low (3120)
This creates a controlled sell-off that avoids grabbing the strong high
🟢 Drop a “GOLDEN SHORT 🪙💥” if you caught this setup before the crowd
💾 Save it for reference – this is how institutions trap liquidity
📤 Share with your trading fam — this setup is 🔥🔥🔥