July 29, Forex Outlook : High-Reward Setups You Shouldn’t Miss!Welcome back, traders!
In today’s video, we’ll be conducting a Forex Weekly Outlook, analyzing multiple currency pairs from a top-down perspective—starting from the higher timeframes and working our way down to the lower timeframes.
Pairs to focus on this Week:
USDJPY
AUDJPY
CADJPY
EURGBP
GBPCHF
USDCHF
NZDCHF
EURNZD
Our focus will be on identifying high-probability price action scenarios using clear market structure, institutional order flow, and key confirmation levels. This detailed breakdown is designed to give you a strategic edge and help you navigate this week’s trading opportunities with confidence.
📊 What to Expect in This Video:
1. Higher timeframe trend analysis
2. Key zones of interest and potential setups
3. High-precision confirmations on lower timeframes
4. Institutional insight into where price is likely to go next
Stay tuned, take notes, and be sure to like, comment, and subscribe so you don’t miss future trading insights!
Have a great week ahead, God bless you!
The Architect 🏛️📉
Liquiditypool

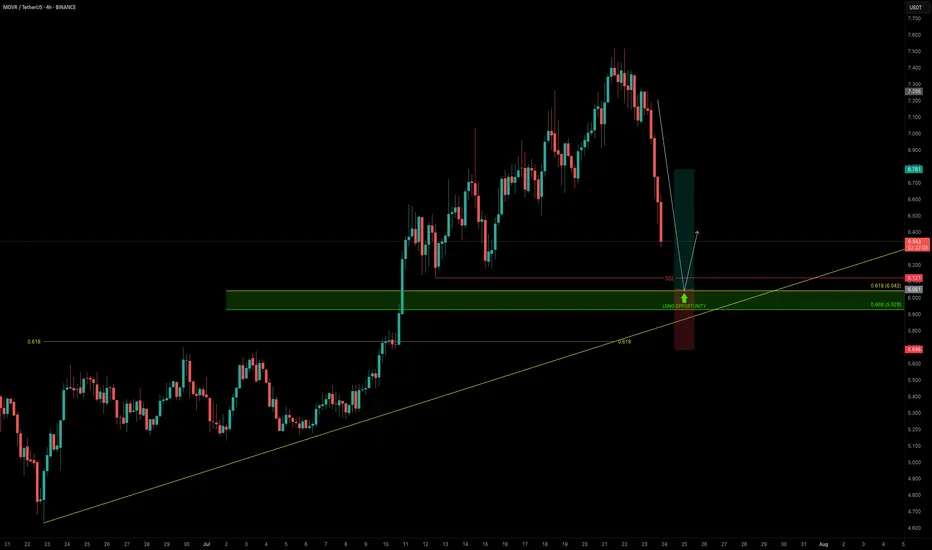
MOVR — Buying the Dip Into Confluence SupportAs the broader market pulls back, it’s the perfect time to scan for high-conviction long setups — and MOVR stands out.
Price is approaching a strong confluence support zone, offering a solid long opportunity.
🧩 Key Technicals
➡️ Liquidity Pool Below the Low:
There’s a visible liquidity pocket just beneath the swing low at $6.121 — an area where stop hunts and reversals are likely.
➡️ Fib & Speed Fan Confluence:
0.618 Fib retracement from the recent move aligns at $6.042
0.618 Speed Fan level also intersects the zone
Together, they form a technical floor right at the $6 psychological level
🟢 Long Trade Setup
Entry: $6.042
Stop-loss: $5.685 (below structure & liquidity sweep)
Target (TP): $6.78
R:R: ≈ 1:2+
Plan: Wait for price to fill into the zone and monitor for a bullish reaction (e.g., SFP, bullish structure reclaim)
💡 Why It Matters: Confluence Builds Confidence
When multiple tools — fib retracement, speed fan, liquidity pools, and psychological round numbers — all line up, it increases the probability of a strong reaction.
This is how smart money builds positions — not by chasing pumps, but by entering where others panic.
Final Thoughts
MOVR is approaching a clean, high-probability buy zone just below $6.00.
If the level holds and confirms with price action, this setup offers a solid R:R and a clear invalidation point.
📌 Mark the zone, set your alert, and let price come to you.
_________________________________
💬 If you found this helpful, drop a like and comment!
Want breakdowns of other charts? Leave your requests below.
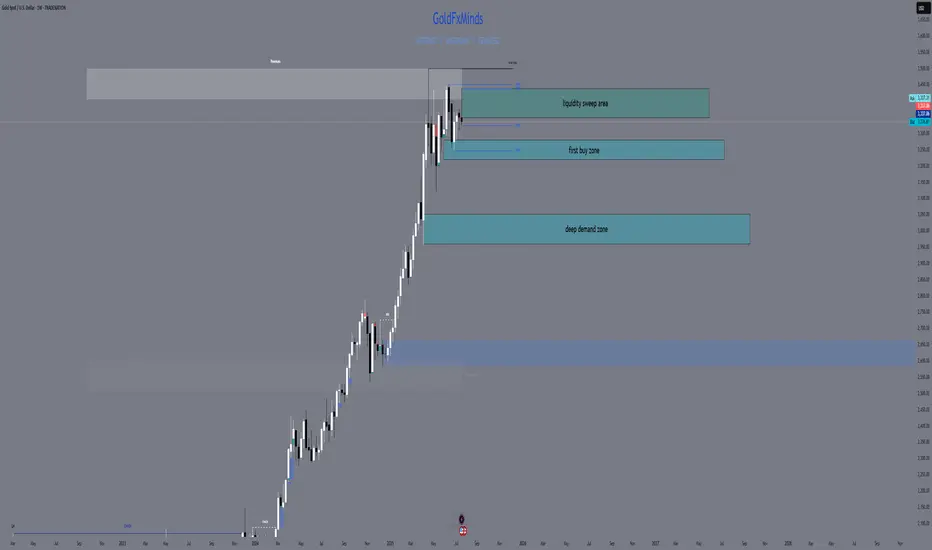
Daily XAUUSD Outlook — Riding the Fed Wave (July 28, 2025)Hey Gold Hunters! 🌟
Today feels like the calm before a storm—ADP whispers tomorrow, the Fed speaks Wednesday, and gold is inching toward its next big move. Let’s weave the macro pulse into our Smart‑Money map, highlight the five real zones, then plot our sniper‑perfect entries. No fluff—just the human beat of the market.
1️⃣ Macro Pulse & Market Mood
US Dollar: Bullish tilt as markets price in another hawkish Fed pause.
Tomorrow (Tue): ADP jobs print could spark an early swing.
Wed PM: FOMC Statement & Powell’s press conference—biggest catalyst this week.
Thu/Fri: Core PCE, Unemployment Claims, then Friday’s NFP + ISM Manufacturing.
Gold is caught in suspense: a squeeze here (into supply) or a slide there (into demand) will come fast once the Fed drops its hint.
🧭 Bias: Neutral‑bearish—looking for lower highs under the 3,345–3,375 supply zone, with a preference to short rallies into that band until price convincingly breaks and holds above 3,375. Once we see a clean weekly‑style close above that level, we’ll flip to neutral‑bullish.
2️⃣ Five Breathing Zones (Top → Bottom)
🛑 Zone 1 “Sky Trap” (3,380 – 3,415)
The final airspace above our daily EMAs (10/50) where stops are hunted. Fib ext’s 127%–161.8% and an unfilled Fair‑Value Gap live here. Any spike that ends in a long upper wick or bearish engulf = short‑trap.
(let price fall clear of this zone before the next)
⚔️ Zone 2 “Premium Supply” (3,345 – 3,375)
The two‑week high order block, hugged by EMA50 and Fib 61.8%. Friday’s rejection candle was born here. Watch for bearish PA after a retest—your core sell zone.
(space down to next)
🌊 Zone 3 “First Demand Cove” (3,290 – 3,320)
Where mid‑June’s buyers piled in: June consolidation OB, filled FVG, and Fib 38.2–50% confluence. SMA100 sits below for extra gravity. A clean drop and bullish reaction here = sniper‑long trigger.
(gap to deep zone)
🚀 Zone 4 “Deep Pullback Bay” (3,240 – 3,270)
Hidden Fair‑Value Gap, BOS origin, and weekly EMA21 converge. If Zone 3 breaks, this is your deep‑dip reload—hunt that D1 reversal wick.
(last space)
🛡️ Zone 5 “Macro Reset Block” (3,000 – 3,140)
The root of 2024’s CHoCH, EMA200/SMA200 cluster, and 78.6–88.6% Fib retrace. Only if gold truly panics on a USD blitz—ultimate accumulation.
3️⃣ Sniper‑Perfect Scenarios
🔴 Short Setup
Where: A thrust into Zone 1 or 2 (3,345+).
Cue: Long upper wick → bearish engulf on D1/M30.
Edge: FVG fill + Fib confluence + RSI rollover.
🟢 Long Setup
Where: A dip into Zone 3 or, if swept, Zone 4.
Cue: Bullish pin‑bar or engulf + reclaim of EMA10/50.
Edge: June OB base + RSI bounce from ~50.
4️⃣ Your To‑Do List
Morning Watch: Does gold flirt with 3,375? Prep your shorts.
Mid‑Day Pull: A drop to 3,300? Hunt your longs.
Avoid: The gaps between zones—those are “no‑man’s land.”
News Trades: Let the daily candle close post‑Fed before committing.
💬 What’s your plan today? Comment below—let’s refine our edge!
👍 Enjoyed this map? Smash that Like & Follow for more pulse‑driven, zero‑fluff outlooks.
Disclosure: Chart powered by Trade Nation’s TradingView feed. I participate in their Influencer Program.
GoldFxMinds 💛
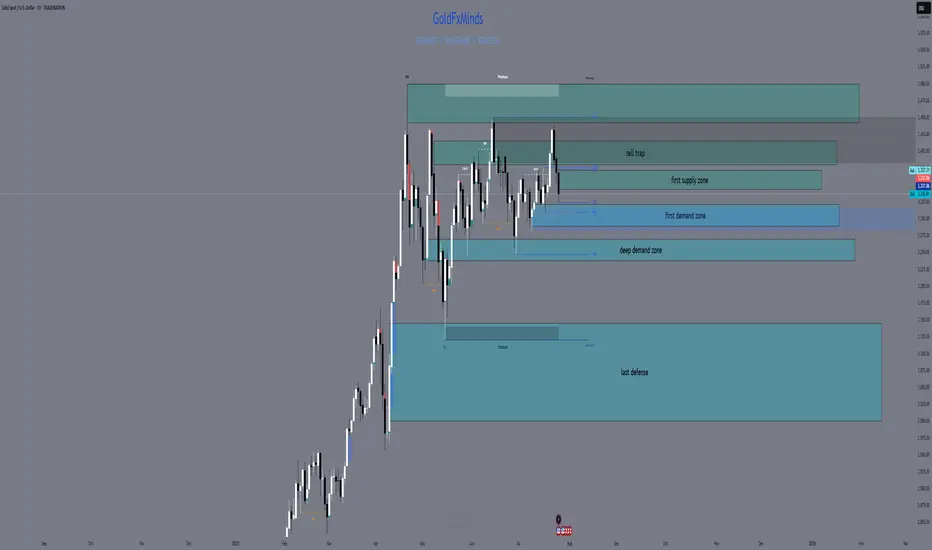
XAUUSD FULL WEEKLY STRUCTURE MAPHello traders! 🌟
We’re stepping into a pivotal week for gold (XAUUSD), and the weekly chart tells a story of tension, liquidity hunts, and potential big moves. Let’s dive into the three truly critical zones, backed by SMC/ICT logic, Fibonacci, EMAs, RSI, and fair‑value gaps — all in one elegant map. 🎨✨
🔹 HTF Overview & Macro Pulse
Current Price: 3336
Weekly Trend: Bullish overall, but momentum is fading as price coils under premium highs.
EMAs (5/21/50/200):
EMA5 & EMA21 are flattening beneath price, hinting at stall.
EMA50 sitting near 3120 as a deep support magnet.
RSI (Weekly): Cooling from ~75 down to ~66, showing bearish divergence vs those upper wicks.
Fair‑Value Gaps:
Unfilled 3365–3405 zone above — institutional imbalance still waiting.
Partially filled 3280–3320 below — common reaction pocket.
Fibonacci Extensions (1984 → 3365 high): 127.2% at 3405, 161.8% at 3439 — the exact top of our supply wick.
Macro Catalysts This Week
Wed (Jul 30): FOMC + Fed Statement
Thu (Jul 31): Core PCE + Unemployment Claims
Fri (Aug 1): NFP + ISM Manufacturing
Prepare for violent spikes into one of our zones — then trade the reaction.
🔸 The Three TRUE Weekly Zones
W1 Supply (Ultimate Wick Zone)
🔥 3350 – 3439
This entire wick from May–July is YOUR one and only supply zone on weekly.
Pure liquidity sweep area
Confluence: unfilled fair‑value gap, 127–161.8% Fib, RSI divergence
Every touch here is a short‑trap until we see a full weekly close above 3439.
W1 Demand (Primary Buy Zone)
🌊 3220 – 3285
The last robust order block & BOS base before gold ran vertical.
Confluence: filled FVG, weekly OB body, EMA21 target, RSI back at 50
Ideal sniper entry after a news‑driven sell‑off into this range.
Deep Discount Block
🛡️ 2960 – 3050
The origin of the full 2024–2025 bull trend — true institutional accumulation.
Confluence: March 2024 CHoCH base, EMA50/200 proximity, 78.6–88.6% Fib retrace
Only for a major quarterly reset; not on the immediate radar unless USD spikes dramatically.
🧭 Strategy & Execution
Short Bias: Wait for a liquidity spike into 3350–3439 (likely around FOMC/NFP), then watch for a clean rejection candle.
Long Bias: After a thrust down into 3220–3285, look for wick‑based rejection plus EMA21 hold and a bullish engulf on weekly.
Avoid the mid‑zone between 3285–3350 — that’s noise, not structure.
Patience is everything. Let price sweep, then let us strike. The real power trades this week will be born from clear structure — not guesswork.
💬 What’s your favorite zone to watch? Drop a comment below!
👍 Smash that like🚀🚀🚀 if you found this map helpful, and hit follow for more GoldFxMinds sniper blueprints.
Disclosure: Analysis based on Trade Nation’s TradingView feed. I’m part of their Influencer Program.
GoldFxMinds 💛
AUDJPY: Bullish Structure Shift Signals Institutional Buy ZoneGreetings Traders,
In today’s analysis of AUDJPY, we observe a recent bullish market structure shift (MSS), signaling potential for continued upward movement. With this in mind, we aim to capitalize on buying opportunities at key institutional points of interest to target higher premium prices.
Higher Timeframe Context:
The weekly timeframe maintains a clear bullish narrative. This long-term bias is now supported by a bullish MSS on the H4 timeframe, offering strong confluence and alignment across both macro and intermediate structures. This increases our confidence in expecting further bullish continuation.
Key Observations on H4:
Weekly Fair Value Gap (FVG) Support: Price recently pulled back into a weekly FVG and has rebalanced that inefficiency. This reaction aligns with the H4 MSS, reinforcing the weekly FVG as a strong institutional support zone.
Reclaimed Bullish Order Block: After the MSS, price retraced into a bullish reclaimed order block—an area where previous institutional positioning occurred. Since price has now reclaimed this level, it becomes a high-probability zone for renewed buying interest in the direction of the dominant trend.
Lower Timeframe Confirmation: This reclaimed order block will serve as our primary zone of interest to seek confirmations on the lower timeframes for precise entries.
Trading Plan:
Entry Strategy: Wait for bullish confirmation within the reclaimed H4 order block zone before entering long positions.
Target: The primary objective is the H4 liquidity pool situated at premium prices, which the market is likely to be drawn toward.
For a detailed market walkthrough and in-depth execution zones, be sure to watch this week’s Forex Market Breakdown:
As always, execute with discipline and align your trade management with your overall plan.
Kind Regards,
The Architect 🏛️📈

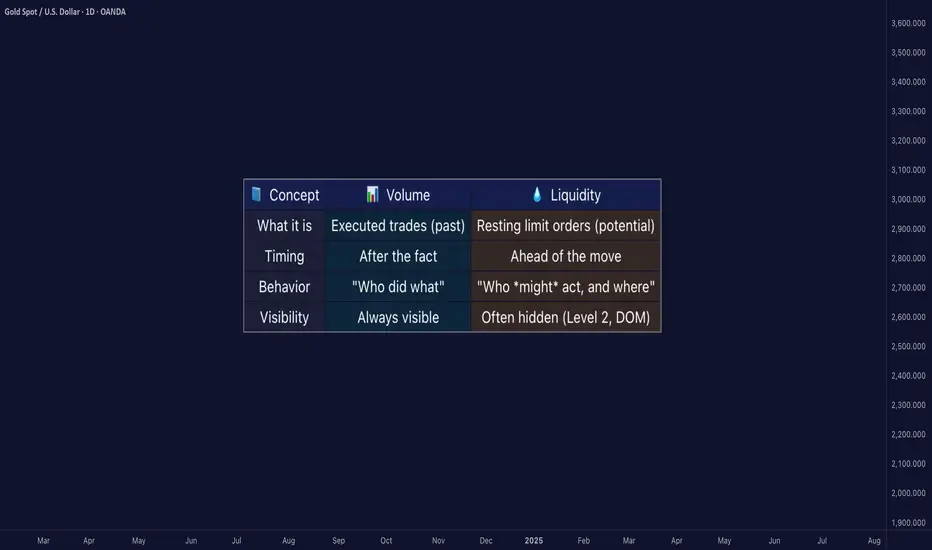
Liquidity ≠ Volume: The Truth Most Traders Never Learn█ Liquidity ≠ Volume: The Truth Most Traders Never Learn
Most traders obsess over volume bars, but volume is the footprint, not the path forward.
If you’ve ever seen price explode with no volume or fail despite strong volume, you’ve witnessed liquidity in action.
█ Here’s what you need to know
⚪ Volume Is Reactive — Liquidity Is Predictive
Volume tells you what happened.
Liquidity tells you what can happen.
█ Scenario 1: Price Jumps on Low Volume
❝ A price can jump on low volume if no liquidity exists above.❞
⚪ What’s happening?
The order book is thin above the current price (i.e., few or no sellers).
Even a small market buy order clears out available asks and pushes price up multiple levels.
Volume is low, but the impact is high because there’s no resistance.
⚪ Implication:
This is called a liquidity vacuum.
It can happen before news, during rebalancing, before session openings, on illiquid instruments, or during off-hours.
Traders often overestimate the strength of the move because they only see the candle, not the absence of offers behind it.
█ Scenario 2: Move Fails on High Volume
❝ A move can fail on high volume if it runs into a wall of offers or bids.❞
⚪ What’s happening?
There’s a strong surge of aggressive buying or selling (high volume).
But the order book has deep liquidity at that level — large resting limit orders.
The aggressive traders can’t chew through the liquidity wall, and price stalls or reverses.
⚪ Implication:
This is called liquidity absorption.
Market makers or institutions may intentionally absorb flow to stop a breakout.
Many retail traders mistake this for “fakeouts,” but it’s really liquidity defending a level.
⚪ What the Research Says
Cont, Stoikov, Talreja (2014): Price responds more to order book imbalance than trade volume.
Bouchaud et al. (2009): Liquidity gaps, not trade size, are what truly move markets.
Hasbrouck (1991): Trades only impact price if they consume liquidity.
Institutions don’t chase candles — they model depth, imbalance, and liquidity resilience.
⚪ Where the Alpha Lives
Liquidity tells you where the market is weak, strong, or vulnerable — before price moves.
Fakeouts happen in thin books.
Reversals occur at hidden walls of liquidity.
Breakouts sustain when liquidity follows the price, not pulls away.
If you understand this, you can:
Enter before volume shows up
Avoid chasing dead breakouts
Fade failed moves into empty space
█ Final Truth
Volume is the echo. Liquidity is the terrain. Alpha is in reading the terrain. You want to study the structure, because price moves toward weakness and away from strength. Learn to see where liquidity is, or where it’s missing, and you’ll see trading with new eyes.
-----------------
Disclaimer
The content provided in my scripts, indicators, ideas, algorithms, and systems is for educational and informational purposes only. It does not constitute financial advice, investment recommendations, or a solicitation to buy or sell any financial instruments. I will not accept liability for any loss or damage, including without limitation any loss of profit, which may arise directly or indirectly from the use of or reliance on such information.
All investments involve risk, and the past performance of a security, industry, sector, market, financial product, trading strategy, backtest, or individual's trading does not guarantee future results or returns. Investors are fully responsible for any investment decisions they make. Such decisions should be based solely on an evaluation of their financial circumstances, investment objectives, risk tolerance, and liquidity needs.
Call me bluff 🧾 TradingView Journal Entry – XAUUSD
Date: July 23, 2025
Pair: XAUUSD
Timeframe: 1H (Entry), HTF Alignment: 4H / 1W
Position: Sell
Execution Style: SMC (Smart Money Concept)
⸻
🧠 Trade Reasoning
• HTF Context (4H/1W):
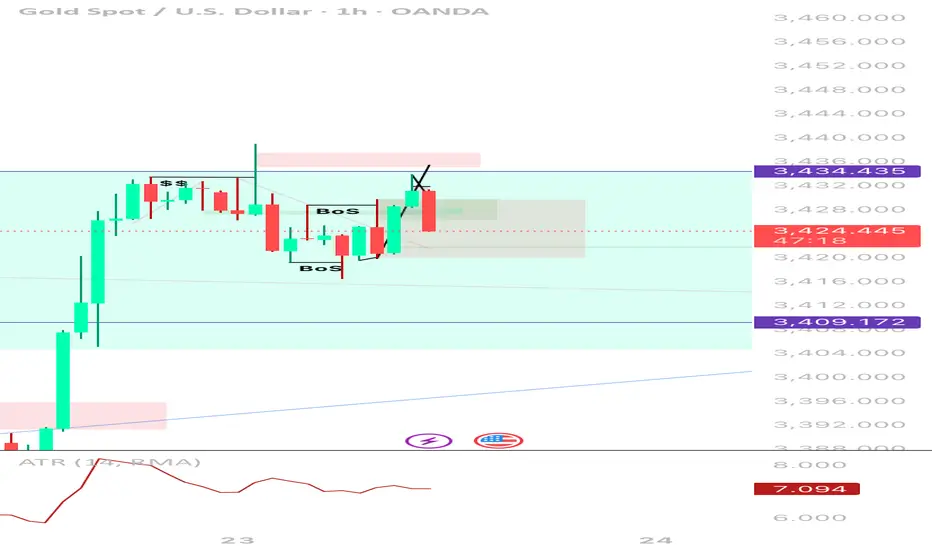
Price recently broke out of a falling wedge on the weekly and created a strong impulsive leg on the 4H. However, price had reached a key supply zone near 3,434, showing signs of exhaustion. No continuation above key structure → likely retracement phase incoming.
• LTF Setup (1H):
• ✅ Equal Highs Liquidity (”$$”) above 3,434 swept
• ✅ Bearish engulfing candle immediately after sweep
• ✅ Two internal BOS (Breaks of Structure) showed clear bearish intent
• ✅ Price returned to mitigate inside a small OB/FVG zone
• ✅ Entry confirmed on rejection wick + strong bearish follow-through
⸻
💼 Trade Management
• Entry: 3,433.5
• Stop Loss: 3,436.5 (above liquidity wick)
• Take Profit Targets:
• TP1: 3,420 (mitigation zone fill) ✅
• TP2: 3,409.172 (clean imbalance + EQ) ⏳
• TP3: 3,388.985 (4H POI / demand) 🔜
• Risk: ~3 points
• Reward: ~15–45 points (1:5–1:15 depending on TP)
⸻
📈 Reflection
This was a high-confidence SMC setup:
• Liquidity sweep ✅
• Structure shift ✅
• Entry confirmation ✅
Only improvement: I could have refined entry on 15m or 5m for even better RR. ATR was dropping, signaling a compression → made sense for a clean move post-sweep.
⸻
📌 Tag Notes
• #SMC #LiquiditySweep #BreakOfStructure #1HEntry #HTFRejection #Gold #XAUUSD #RiskReward
EURNZD: Bullish Confluence Aligns for Buy Setups at Key ArraysGreetings Traders,
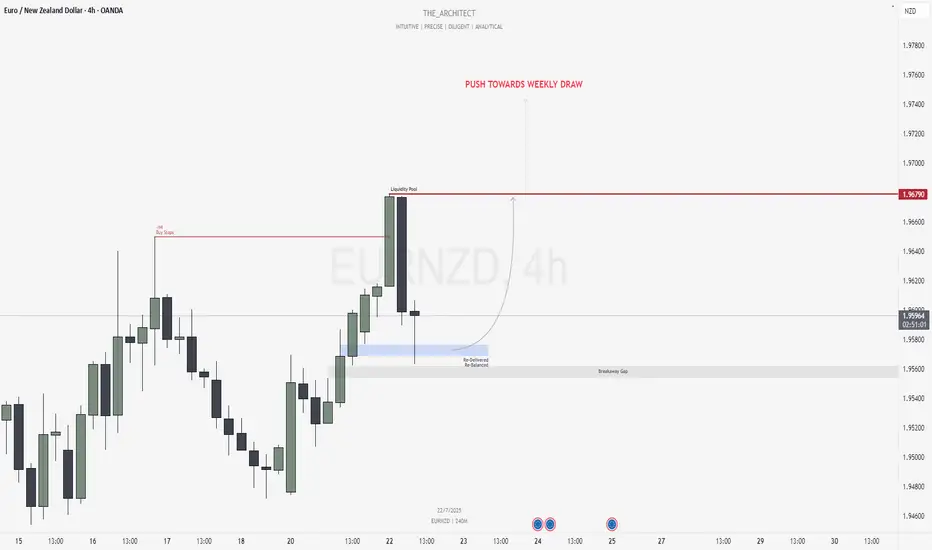
In today’s analysis of EURNZD, we identify that the current institutional order flow is bullish. With this bias in mind, we aim to capitalize on high-probability buying opportunities from key points of interest aligned with institutional behavior.
Higher Timeframe Context:
The weekly timeframe is showing a clear bullish narrative. This bullish order flow is confirmed by the H4 timeframe, which is also delivering higher highs and higher lows—providing confluence between both the macro and intermediate timeframes. This alignment increases our confidence in seeking long setups.
Key Observations on H4:
Buy-Side Liquidity Sweep: Price recently took out H4 buy stops, which triggered a retracement into internal range price action.
Re-Delivered Re-Balanced Zone (RDRB): Price has now pulled back into a re-delivered, re-balanced array—a significant institutional level that typically offers low-risk buy setups. Given the nature of this zone, we do not anticipate a deeper pullback into the fair value gap (FVG), thereby treating it as a potential breakaway gap.
Draw on Liquidity: The next probable target is the external liquidity pool resting in premium prices. The market appears poised to gravitate towards that area.
Trading Plan:
Entry Strategy: Monitor the lower timeframes for bullish confirmations within the RDRB array.
Targets: The primary target is the engineered liquidity pool in premium prices.
For a detailed analysis, please watch this weeks Forex Outlook:https://www.tradingview.com/chart/EURNZD/BZC9xW1L-July-21-Forex-Outlook-Don-t-Miss-These-High-Reward-Setups/
Remain patient, trust the structure, and execute with precision as the bullish narrative unfolds.
Kind Regards,
The Architect 🏛️📈
EURJPY: MSS on H4 Signals Bearish Shift Toward Weekly FVGGreetings Traders,
In today’s analysis of EURJPY, we observe that a Market Structure Shift (MSS) has recently occurred on the H4 timeframe, indicating a potential change in directional bias. This suggests that price may begin to draw toward the Weekly Fair Value Gap (FVG), presenting a favorable opportunity to align with bearish order flow.
Higher Timeframe Context:
The weekly timeframe currently shows an unfilled Fair Value Gap (FVG) to the downside, acting as the primary draw on liquidity. This macro bearish draw adds weight to the idea of shorting the pair from premium levels. On the H4—our intermediate timeframe—we now have structural confirmation via a bearish MSS, aligning the two timeframes toward downside targets.
Key Observations on H4:
Bearish Order Block in Premium: Price has recently retraced into an H4 bearish order block situated within premium pricing. This zone acts as institutional resistance and is currently showing signs of rejection.
Confirmation Zone: This H4 bearish order block is being monitored for M15 confirmation entries, as we look for price to break lower from this key institutional level.
Engineered Support & Resting Liquidity: Just above the weekly FVG lies an engineered support zone—characterized by equal lows—suggesting that liquidity has been pooled there. This area serves as a high-probability draw for institutional price delivery.
Trading Plan:
Entry Strategy: Seek lower timeframe (M15) confirmation around the H4 bearish order block before initiating short positions.
Targets: The first target lies at the H4 internal liquidity pool within discounted pricing. The longer-term objective is the weekly FVG, where liquidity is likely to be delivered next.
For a detailed analysis, please watch this weeks Forex Outlook:https://www.tradingview.com/chart/EURNZD/BZC9xW1L-July-21-Forex-Outlook-Don-t-Miss-These-High-Reward-Setups/
Maintain patience, follow your confirmation rules, and always adhere to sound risk management principles.
Kind Regards,
The_Architect 🏛️📉

USDCHF: Bearish Shift Offers Premium Selling ZonesGreetings Traders,
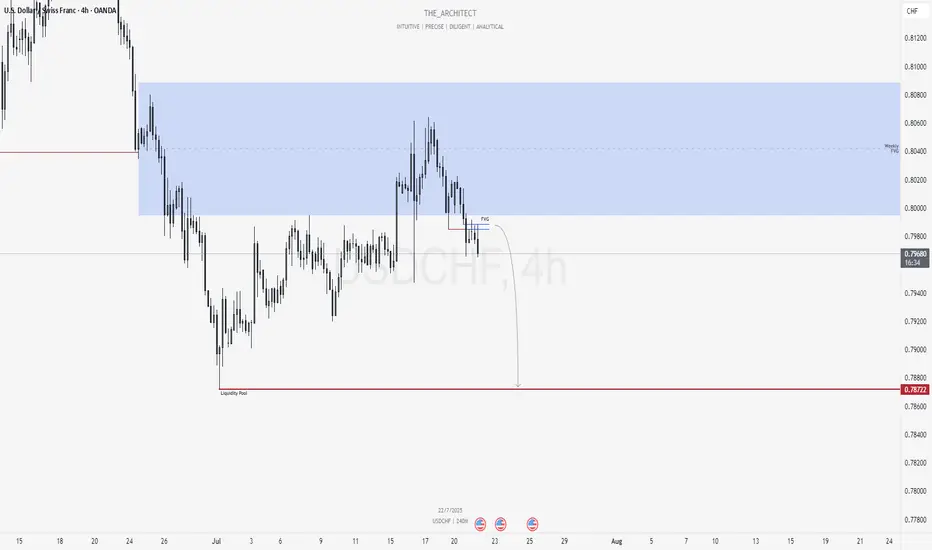
At present, USDCHF is exhibiting a clear shift in institutional order flow toward the bearish side. In response, we aim to align with this directional bias by identifying high-probability selling opportunities within premium price zones.
Higher Timeframe Context:
The weekly timeframe remains bearish, offering a macro-level bias. Price recently pulled back into the weekly Fair Value Gap (FVG), a key internal range area. With this retracement complete, we now expect the market to begin its delivery toward external liquidity pools located in discounted price zones.
Key Observations on H4:
Market Structure Shift (MSS): USDCHF has recently presented a bearish MSS on the H4, confirming a change in the internal structure and further validating the bearish narrative.
H4 Fair Value Gap Rejection: Following the MSS, price retraced into a newly formed H4 FVG. This area now serves as a short-term institutional resistance zone.
Sell Opportunity Zone: This H4 FVG provides a valid zone to seek confirmation-based entries on the lower timeframes (e.g., M15), with the objective of targeting downside liquidity.
Trading Plan:
Entry Strategy: Look for short setups via confirmation on the M15 timeframe within the current H4 FVG zone.
Targets: Focus on internal liquidity pools within discounted price levels, with the broader objective being the external liquidity resting beneath recent swing lows.
For a detailed market walkthrough and in-depth execution zones, be sure to watch this week’s Forex Market Breakdown:
Kind Regards,
The Architect 🏛️📉
July 21, Forex Outlook : Don’t Miss These High-Reward Setups!Welcome back, traders!
In today’s video, we’ll be conducting a Forex Weekly Outlook, analyzing multiple currency pairs from a top-down perspective—starting from the higher timeframes and working our way down to the lower timeframes.
Pairs to focus on this Week:
EURUSD
USDJPY
AUDJPY
CADJPY
EURJPY
GBPCHF
USDCHF
NZDCHF
EURNZD
Our focus will be on identifying high-probability price action scenarios using clear market structure, institutional order flow, and key confirmation levels. This detailed breakdown is designed to give you a strategic edge and help you navigate this week’s trading opportunities with confidence.
📊 What to Expect in This Video:
1. Higher timeframe trend analysis
2. Key zones of interest and potential setups
3. High-precision confirmations on lower timeframes
4. Institutional insight into where price is likely to go next
Stay tuned, take notes, and be sure to like, comment, and subscribe so you don’t miss future trading insights!
Have a great week ahead, God bless you!
The Architect 🏛️📉

Picked Up More OKTATraders,
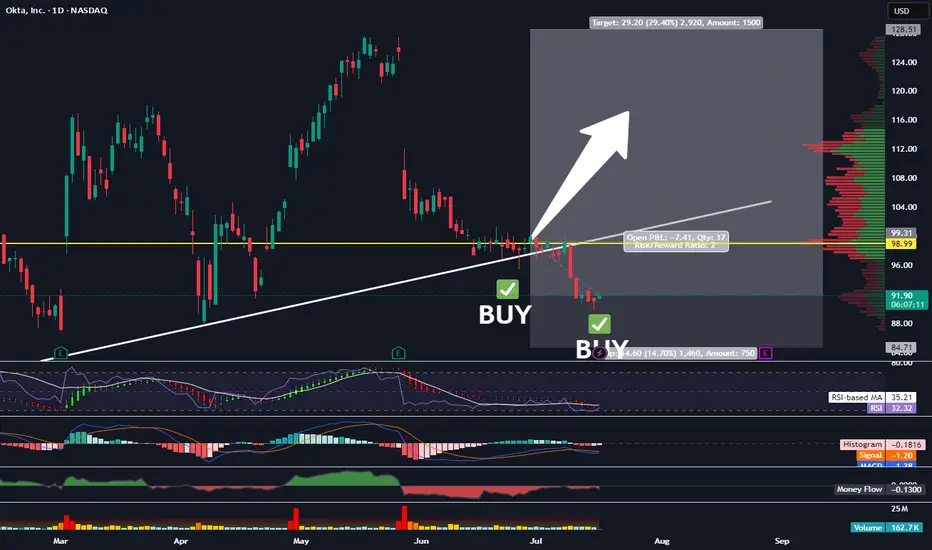
We’re nailing it in the stock division. Our portfolio has gained nearly 30% since the inception of our new indicator in Sept. of last year. And we’ve done that with 50% of our cash on the sidelines nearly the entire time, further reducing risk. It is amazing how I stumbled upon this new trade strategy purely by accident. Not by following anyone else on Youtube or TradingView or X. But simply by doing what I love to do and spotting trends and patterns. The combo of the indicators I have been utilizing is truly working, outbesting SPY hodl’ers by 3-to-1 since implementation.
At times, my indicator gives us more than one signal. This usually indicates that the move up will be stronger and more aggressive than previously indicated. Such is the case with our OKTA entry. We’ve got another BUY signal that has been given, and so, I am DCA’ing in. The target and SL will remain the same as our previous entry. All data can be found on the tracker.
Best,
Stew
July 13, Forex Outlook : This Week’s Blueprint to Profit!Welcome back, traders!
In today’s video, we’ll be conducting a Forex Weekly Outlook, analyzing multiple currency pairs from a top-down perspective—starting from the higher timeframes and working our way down to the lower timeframes.
Currency Pairs:
EURUSD
USDCAD
AUDUSD
EURGBP
EURJPY
GBPCHF
USDCHF
NZDCHF
NZDUSD
EURNZD
Our focus will be on identifying high-probability price action scenarios using clear market structure, institutional order flow, and key confirmation levels. This detailed breakdown is designed to give you a strategic edge and help you navigate this week’s trading opportunities with confidence.
📊 What to Expect in This Video:
1. Higher timeframe trend analysis
2. Key zones of interest and potential setups
3. High-precision confirmations on lower timeframes
4. Institutional insight into where price is likely to go next
Stay tuned, take notes, and be sure to like, comment, and subscribe so you don’t miss future trading insights!
Have a great week ahead, God bless you!
The Architect 🏛️📉

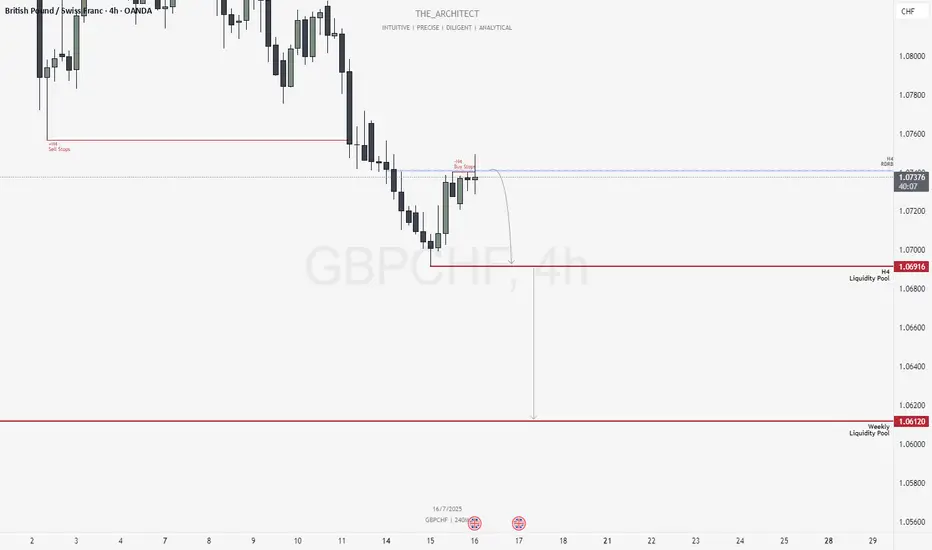
GBPCHF: Bearish Structure Aligns for Potential Sell Setups!Greetings Traders,
In today’s analysis of GBPCHF, we observe that the institutional order flow is currently bearish, and as such, we aim to align with this bias by identifying selling opportunities from key institutional resistance zones.
Higher Timeframe Context:
Weekly TF:
The weekly timeframe, which serves as our macro bias, is firmly bearish. This sentiment is reinforced on the H4 timeframe—our intermediate structure—which is also delivering consistent lower highs and lower lows. The alignment between these two timeframes strengthens our conviction to trade in the direction of institutional bearish order flow.
Key Observations on H4:
Re-delivered & Re-balanced Price Zone: Price has retraced into a previously balanced area that has now been re-delivered into, signaling institutional interest. Rejection from this zone adds to our bearish bias.
Buy Stop Raid: Price action has swept H4 buy stops in this area, providing confirmation that smart money may have used this liquidity for order pairing into short positions.
Entry Zone: The current rejection suggests a high-probability shorting opportunity from this region, provided confirmation on the lower timeframes.
Trading Plan:
Entry Strategy: Await confirmation at the current H4 resistance for short entries.
Targets: First target is the H4 liquidity pool located at discount prices. The longer-term objective is the weekly liquidity pool, which represents the primary draw on liquidity.
Continue to monitor price action closely, maintain patience for confirmation, and manage risk according to your trading plan.
Kind Regards,
The Architect 🏛️📉
ETH / USDC Liquidity Pool RangeTightening up the range a little. Looking good with horizontal lines setting the new range.

GBPUSD sweep of lowGBPUSD sweep of low reclaim of low and respecting liquidity aree take to weekly high cautiously after that short of lifetime

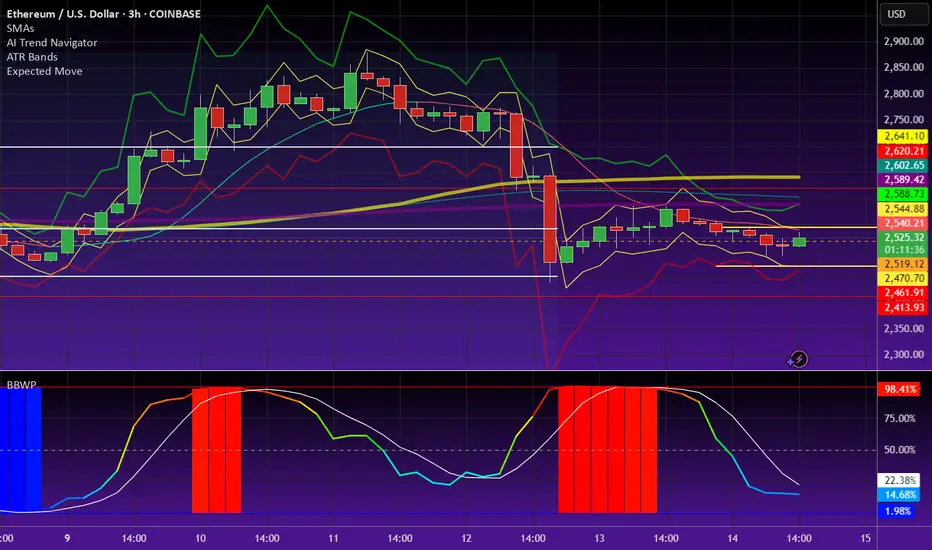
ETH / USDC Pool StakeSharp sell-off following the U.S. strike on Iran—ETH whale has entered. Set your liquidity pool range wide to capture a potential rebound. If the price continues to drop, no problem—full ETH position is anchored at the bottom of the range. Avoid swapping ETH to realize losses. Hold your original ETH and continue adjusting the range downward if needed. Your only real costs are minting and gas fees, so operate on a low-cost network like Arbitrum or Base to keep expenses minimal.

BTC Buy Setup | Sniper Trading System - Reverse Play🚨 BTC Buy Setup | Sniper Trading System™️ Reverse Play Activated
What you’re looking at isn’t luck — it’s Sniper-level execution.
This BTC reversal trade was triggered by my Sniper Trading System™️, which identifies institutional-level liquidity traps, dealer ranges, and timing zones with precision.
🧠 Setup Highlights:
— Liquidity sweep below key support
— RSI confirming reversal from the Fade Zone
— Dealer Range low respected
— Reversal candle + structure shift = high-probability sniper entry
📍 Chart:
This is powered by my Jesus Saves™️ + Fade Reversal Combo, built into the Sniper Trading System Suite™️.

Ethereum Liquidity Pool RangeOn the ETH/USDC liquidity pool on the Base network, Ethereum’s volatility is beginning to stabilize, creating a favorable range for liquidity provision, as indicated by the horizontal red lines. There may be an opportunity to tighten this range further in the coming hours, but additional data is needed to confirm. For now, the concentrated range is being set slightly wider, given that we’re still relatively close to the significant volatility spike from earlier in the week.
Mastering Liquidity Dynamics: Understand the Dynamic True ValueDear Reader,
Thank you for reading—your time is valuable.
Use the chart's zoom-in/out (-/+) function for better visibility. This chart captures a large sample for your evaluation.
Below is the manual detailing the Smart Farmer System —a Dynamic True Value framework derived from real-time data to anticipate market intent and liquidity behavior .
If this resonates with you, drop a comment below— constructive insights are always welcome .
The Dynamic True Value - a Smart Farmer System: Terminology and Mechanics
: For now, I have firmed up POC - Price of Control, VAP - Value Average Pricing, SULB - Sell Upper Limit Bound, BLLB - Buy Lower Limit Bound.
Mechanic:
POC - Where fair value price dynamic is read.
VAP - Trading above indicates bullish sentiment of the cycle, and the opposite for bearish sentiment.
A crossed over of:
Grey POC above Green VAP - Signaling distribution, accumulation, consolidation, build-ups, correction, retracement .
Green VAP above Grey POC - Bullish strength and momentum consistency .
Pink VAP above Black POC - Bearish strength and momentum consistency .
Flip of Pink VAP to Green VAP - Sentiment flips from bear to bull, and the same goes for green flip to pink showing bull to bear.
Validation of entry signals requires:
Signal's candle must close past the opposite side of POC – flip sentiment .
The confirmation candle (is the closed next candle immediately after entry signal candle) must continue closed past the POC – maintain sentiment .
The progress candle (is the next candle closed right after the Confirmation Candle) shows traction, momentum build-up, and volume consistency .
Hint of invalidation:
Signal's candle is considered void if the next candle prints a new entry signal in the opposite direction. This often signals accumulation, sideways movement, build-up, uncertainty, or swings in range .
The immediate next candle closed past POC to the opposite side.
What to understand about Liquidity Trap, SULB, and BLLB:
Liquidity traps
Often occur at the recent/previous flatlines of Dynamic True Value (POC, VAP, SULB, BLLB) .
It is worth paying attention to the market’s intent and institutional positioning.
Signs of exhaustion, absorption, inducement, offloading, and accumulation are visible in the M1 (one-minute) TF, with significant confluence near the previous/recent flatlines of Dynamic True Value in the higher/macro-TFs.
An Anchored VWAP tool can be helpful for filtering noise in the market. This tool can be found in the drawing tab in the TradingView platform.
SULB
Details the dynamic of upper resistance where Bears remain in control below the dynamic level.
Below this limit bound (LB) , bears show strength – bear sentiment .
A converging price toward this LB indicates bulls are present.
Moving past this LB (a candle closed above) and successfully RETESTING newly formed support indicates a confirmed directional shift . Followed by printing a new BLLB in the next following candles with price continuing to rise above this failed SULB.
A rejection below LB (a rejection/exhausted candle closed below LB) and successful RETEST reaffirms the resistance holds , indicating downside continuation .
BLLB
Details the dynamic of lower support where Bulls remain in control above the dynamic level.
Above this LB, bulls show strength – bull sentiment .
A converging price toward this LB signifies bears are present.
Moving past this LB (a candle closed below) and successfully RETESTING newly formed resistance indicates a confirmed directional shift . Followed by printing a new SULB in the next following candles with price continuing to push lower below this failed BLLB.
A rejection above LB (a rejection/exhausted candle closed above LB) and successful RETEST reaffirms the support holds , indicating upward continuation .
Important Notes:
Select preferred Entry’s Signal TF (ex. M3 TF, M5 TF for scalping strategy, M15 for intraday/daily strategy, 4H TF for day-to-weekly strategy, etc.).
Always refer to the selected Entry’s TF for trading progress. Anticipate TP and SL by watching the range in this TF.
Non-entry TFs are not for entry purposes. These multi-TFs are used for measuring strength, momentum, liquidity, positioning, structure – The market intends . The Non-entry TF is used to anticipate institutional executions and liquidity pools.
These criteria MUST BE MET. A failed criterion suggests vague execution. Be patient and wait for clear validations.
Institutions excel in creating illusions.
SFS is designed to stand ready, calm, and execute with Clarity.
SFS cuts through noise, distraction, and stays independent of NEWS, GEOPOLITIC, RUMORS, and herd mentality because all these are designed to mislead retail traders into institutional traps.
When we see such ambiguity against the criteria, we know not to fall into the TRAP and become the liquidity FUEL.
Stay sharp, only respond when signals are firmed. SFS is designed to counter Smart Money capitalism. It is about time to level the playing field.

Gold ShortAmidst dxy consolidation, gold seems to be forming a correction. A new trading range is formed between 3300 and 3340. Earlier in the session, false breakout of 3340 resistance formed, but price got rejected strongly. Our focus is on gold correcting itself, where it has the potential to tap the important support zone at 3275.
Levels to lookout for
Support: 3300, 3275
Resistance: 3340
Happy trading!

Bitcoin analysis based on market liquidity and M2 money supply This trade enters Bitcoin in the $101,500–$102,200 zone, aiming to capture a high-probability bounce from a dense liquidity pocket formed by recent long liquidations. This region has historically acted as a bull market reaccumulation zone, typically holding after 5–8% drawdowns during major trend continuations.
The trade is structured to ride a macro continuation leg toward $125,000, targeting the next major expansion phase driven by both short squeezes (clustered above $106K) and a broader surge in demand following increasing M2 money supply and institutional inflows.
The stop-loss is placed at $97,000, a deliberate distance below local support but above the deeper liquidity sweep zone at $89K–$92K. That level is unlikely to be reached unless the market undergoes a full liquidation cascade, which would likely bypass $97K altogether in a fast move. This stop protects against structural failure while avoiding premature exits in normal volatility.
The setup is designed for maximum reward with acceptable risk, offering a risk-reward ratio of over 4:1, and aligns with the thesis that Bitcoin is entering its final acceleration phase toward a new macro high.

If Trend Reverses, We'll Most likely See 106-109k FirstTrading Fam,
We'll bring our knowledge of liquidity to the chart here today. You guys know that my new indicator utilizes liquidity as a prime factor in helping to alert us when to buy and sell any given asset. In our chart here today, I have also brought over the liquidation map from Glassnode, which will help us gain further insight into what Bitcoin's next move might be.
First, let me explain a few of the drawing here.
For those who may be new, those liquidity blocks are printed by LuxAlgo's "Liquidity Swings" indicator. I have incorporated them into my indicator and have combined it with another to alert me as to exactly when it might become a good time to buy or sell. Typically, I set the blocks to have a 15 day life cycle. When we are overbought and enter into a sell-side liquidity block, my indicator will flash a red dot. When we are oversold and enter into a buy-side liquidity block, my indicator will flash a green dot. These are typically super-accurate signals and are, at least, a good time to start your exits and/or entries but unfortunately, these DOTS DO NOT APPEAR in this chart due to this being a private indicator distributed by invite only.
I use additional indicators for confirmation and to support what my indicator is showing me, such as the VRVP. You can see the VRVP Point of Control (PoC) is at 96,425 in this chart, meaning that most of our recent traded volume is to the underside of us right now. This is positive. However, it is important to recognize that sometimes that PoC can act as sort of a magnet to pull price back to that area before further directional price trend movement. Keep this in mind as we continue to consider price movement here.
Back to the liquidity blocks. I've extended our last big liquidity block from Jan-Feb of this year out past the normal 15 day life cycle that I usually set. I think this is important as it appears to align with the data that I've brought over from Glassnode's Liquidation Map. Notice that on the map you see large liquidity pools both below the current price and also, above it. But the larger liquidity pool remains above us at the time of this post. This aligns with the resistance levels I have drawn on the chart in white which remain above us. And currently, we are also forming a bull flag pattern. So, are greatest probability of price movement right now remains to the upside. I am targeting that 106-108k area. Once hit, trend reversal could occur.
Here's what I expect.
We hit 106-108k. Then, at this point, the market must make a critical decision; do we continue up, beating previous highs, or do we first drop down and liquidate all those late longs from 93-104k?
Now, since we know that big money is in this game and wants as much as they can get at the best price possible, it is easier to determine what might occur. I suggest that once liquidation occurs up to 106-108k, sell-side pressure will be placed on the market in hopes of driving price back down to clean out all of those late long entries. That PoC level at around 96k is a good target here. Once this price has been hit, freeing up hundreds of millions in liquidated Bitcoin, the big buyers (smart money) will step back in to swoop up the loot and Bitcoin will be free to trend back up again.
Now, as always, I could be wrong. Let's talk about what happens if we beat our 106-108k overhead resistance levels. In this case, we could see Bitcoin pump as high as 125k before any local trend reversal begins to occur. I will re-assess at this point.
BLUF: 106-108k is key resistance. Mark your charts and keep your eye on what price does there. It will be key to what happens next.
✌️Stew
