GBPCADI was expecting a bearish sentiment before a very bullish GBP market with Brexit & elections on our door step but it seems the GBP keeps rising which is scary in these uncertain times. This indicates to me a very big market crash coming in 2020 as expected with chart readings, housing market, interest rates, the usual market crash cycle and many other factors tied into this including Euro sentiments.
Many of the other GBP Pairs also have a simialar outlook/set up which I may post analysis on shortly.
PATIENCE - CONFIRMATION - ENTRY - PROFIT
Liquiditypool


GBPNZDMy bias has been for sells until we reach our long awaited retracement zones at 93400.
However with at Shift of momentum to the upside on structure, I'm now wondering if we can clear the liquidty levels at 2.0300 above before mitigating out at a premium price to the drop to the 93400 prices.
We could also see 2.01000 be met to push lower keeping with the down trend.
PATIENCE - CONFIRMATION - ENTRY - PROFIT


GBPUSD all time low?With the Brexit deal being put into doubt and the big bullish movement we've seen in the last week, i'm looking for GBP based pairs to fall big time for atleast a retracement before heading back to the upside. With analysis and liqidity to clear and imbalances to fill however, this move may just play out in the long term creating all time lows for GBP based pairs.
PATIENCE - CONFIRMATION - ENTRY - PROFIT

GBPNZDWith the Brexit deal being put into doubt and the big bullish movement we've seen in the last week, i'm looking for GBP based pairs to fall big time for atleast a retracement before heading back to the upside. With analysis and liqidity to clear and imbalances to fill however, this move may just play out in the long term creating all time lows for GBP based pairs.
PATIENCE - CONFIRMATION - ENTRY - PROFIT


XAUUSD - GOLDUpdate on entry for a potential move up. For now I'm holding my sells until 1447 or 1430

LONG XAUUSD Using MMM, Spiked down, grabbed sell stops, now can rise. This may not be a long term move, but in the short term, a long seems promising.


XAUUSD - GOLDStill following it waiting to reach 1527 we've been waiting for over 3 weeks now.... Looking for a bullish move in the mean time until we clear liqidity above.
PATIENCE - CONFIRMATION - ENTRY - PROFIT


USOILLooking for a mitigation play to take place while sweeping liqudity for the down move as the DXY is also currently looking bearish .
47.61 should swoop manafuctured liqudity prices on the D1 chart if this move plays out.


XAUUSD - GOLDWe've had the accumulation Wyckoff phase happening for the last 2 weeks for a push to the upside. With mitigation currently happening meeting our reversal 71.8 Fibonacci level, my bias is currently to the downside with my sell limit being met. I won't be surprised if this pushes higher to the price points of 1527 however to fill the huge imbalances we have at those levels.

EURGBP highest it's ever been?As EURGBP usually does the opposite to GBP based pairs, I am looking for a bullish move to the upside for the EUR. Currently sitting at a institutional level to play from and I'll be hoping for some consolidation here to give positive signs for the up move.
PATIENCE - CONFIRMATION - ENTRY - PROFIT

EUR/GBP daily buyback to imbalancePrice reached 0.86000 whole institutional level which surprisingly matched the level of imbalance. Expecting a pullback upwards at least to 0.89000 imbalance and the middle of institutional candle. We missed an aggresive limit order entry, but lets find some entries on lower time frames. GOOD LUCK. Potential 250pips

EUR/NZD buy up to the imbalanceBuying the pullack till imbalance and also a 71% fib level. We buy up the pullback, and then sell down from 71% fib downwards to the sellside liquidity pool

EUR/CHF selling the middle of institutional candlePossible idea on euro/swissy, expecting a retracement to the middle point of liquidity capturing candle 1.10300, possible strong reaction downwards towards sellside liquidity pool

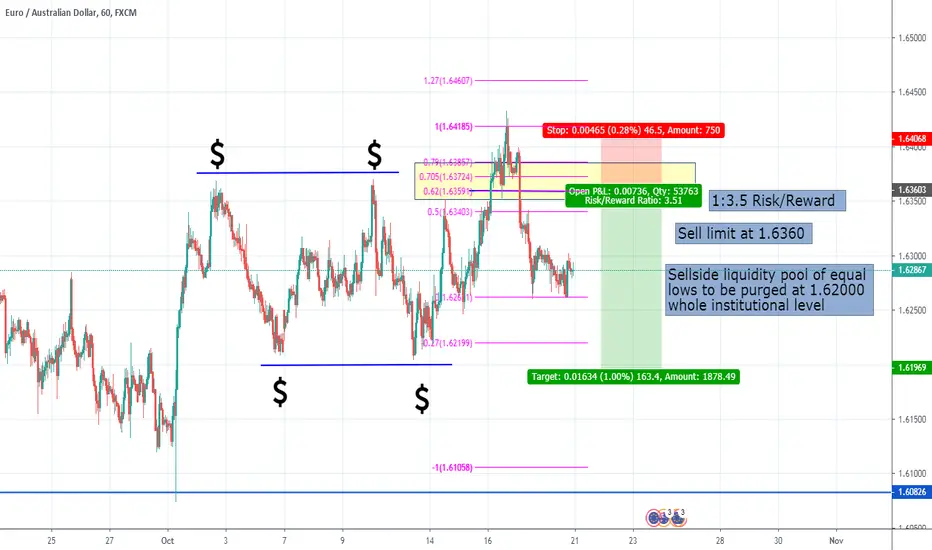
Swing trade on EUR/AUD. Playing with liquidity poolsAn intresting range between 1.62000 to 1.63700 has formed on EUR/AUD 1H chart. Buyside and sellside liquidity pools have been created(equal lows, equal highs). Sellers have already been taken out, now its buyers turn :) I identified a set-up, now we wait for a retracement to 62%-71% fib level, half of the order(sell limit) rests on 62% fib/the middle point of that huge institutional candle on October 17 3 o'cklock (UTC +3), the other half leave for entering on 71% fib or even higher if we get a larger retracement.
XAUUSD - GOLDWe have been in the Wyckoff distribution event phases for the last week.
The current move to the downside is looking like a fake out to me (I hope) to make 1 more move to the upside as I am hoping for the UTAD move to be met which should finally see our big sell off to the downside which also fills ineffecient imbalance and also has the opportunity to close the open order above.
As always..... PATIENCE - CONFIRMATION - ENTRY - PROFIT

