Remains Below 1.3700 Ahead of CPI Data from the US and CADUSD/CAD Remains Below 1.3700 Ahead of CPI Data from the US and Canada
USD/CAD continues to decline ahead of inflation data from both the US and Canada.
The US inflation rate is expected to rise to 2.7% year-over-year in June, up from 2.4% recorded in May.
Meanwhile, Canada’s CPI is forecasted to increase by 1.9% year-over-year in June, up from 1.7% in May.
USD/CAD is trading around 1.3690 during the European session on Tuesday, following two days of gains. The pair is declining as the US dollar (USD) continues to weaken ahead of the June CPI data from the US. The inflation figures will provide new insights into the Federal Reserve's (Fed) monetary outlook.
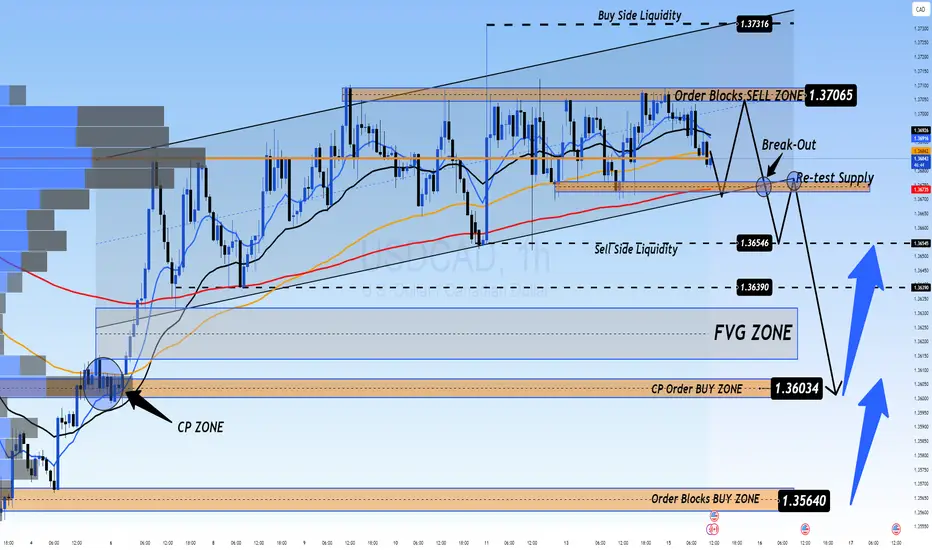
📉 Market Outlook for USD/CAD – Possible Drop on CPI Release
The USDCAD is still in a downtrend, and a sharp drop could occur with today’s CPI data release. Currently, there are two Buy Side Liquidity zones above and Sell Side Liquidity below, with the price balanced around the VPOC zone, which will soon decide the direction after the CPI announcement today.
Market liquidity still holds a FVG below, and with CPI data expected to favor USD, this could trigger a sharp drop towards this liquidity zone, possibly nearing CP OBS at 1.3600, followed by a potential rebound.
If price breaks CP zone, it may head toward a strong OB zone near 1.35xxx. Therefore, caution is advised when monitoring these OB zones.
🎯 Trading Strategy for Today
🟢 BUY ZONE: 1.36000
SL: 1.35500
TP: 1.36500 → 1.37000 → 1.37500 → ????
💬 What are your thoughts on USD/CAD ahead of the CPI data release? Do you expect a strong bounce or a continued decline? Share your views and join the conversation below!
👉 Follow for more updates and insights, and join the community to discuss real-time market moves!
Liquidityzones
EURUSD Approaching Liquidity Shelf — Watch for Reaction at 1.164EURUSD remains firmly bullish on all major timeframes, respecting the internal structure of an ascending channel.
• Daily: Price continues to respect both the red trendline and broader purple bullish channel. Buyers are defending the mid-line and pushing toward the upper boundary.
• 4H: Clear higher highs and higher lows. Price recently revisited and bounced off a 4H demand zone (1.14750–1.15000), and is now testing the liquidity zone at 1.16400.
• 1H: Microstructure shows consolidation and possible absorption of liquidity just beneath the 1.16415 high. A clean break and retest of this level may confirm continuation.
Key Levels:
• Resistance: 1.16415 (previous high and liquidity trap)
• Support: 1.14900 (4H demand zone)
• Daily trendline holding as dynamic support
Trade Plan:
• Longs: Await a break and retest of 1.16415 or a retracement to 1.15600 for a more discounted entry.
• Shorts: Not favored unless a strong bearish engulfing forms below 1.1600 with structure shift on the 1H.

XAU/USD (Gold) – Educational Chart Breakdown [1H Timeframe]We’re currently observing a consolidation phase just below a well-tested resistance zone (~$3,377), while price remains supported by an ascending trendline — a classic setup where structure tightens before a significant move.
Two Potential Outcomes:
Bullish Case
If price closes convincingly above $3,378 with strong volume, we may see a continuation toward the $3,400–$3,410 zone. This would confirm the resistance break and shift market structure bullish on the 1H chart.
Bearish Case
Failure to break above resistance may lead to a reversal and a drop into the $3,345–$3,355 demand zone — especially if price loses the ascending trendline. This would reflect a liquidity sweep and continuation of the larger corrective move.
Patience is key — wait for confirmation before taking action. Consolidation often precedes expansion.

XAUUSD (Gold/USD) – Smart Money Setup with Key Zones & Target 🧠 Market Summary:
This chart shows a classic Smart Money Concept (SMC) play. We're looking at how big players (banks, institutions) trap retail traders, push price through liquidity zones, and move toward their real targets.
📌 Detailed Breakdown:
1️⃣ Ellipse Zone (Left Side – Accumulation Phase)
This shaded ellipse shows where price was moving sideways in a tight range. This is a classic accumulation zone, meaning big players were quietly building their long positions.
✅ Price stayed in this range from May 20–21 before breaking out with strong bullish candles.
👉 What this means: Institutions are loading up. Once they’re filled, they push price upward fast.
2️⃣ Central Zone of Market (Green Diamond)
After the breakout, price made a small pause/retest, which we marked with a green diamond.
This is a re-accumulation area—a temporary consolidation before another push up. It’s also a mid-point, showing the “central engine” of this price move.
👉 What this means: Market still bullish here, collecting more orders.
3️⃣ Major Resistance Zone (Top of Chart)
Price reached this supply zone near 3,360–3,370 and immediately faced strong rejection.
You can see:
Long wicks at the top
Bearish pressure stepping in
Start of a curve formation
👉 What this means: Big players are offloading their long positions and preparing for a reversal.
4️⃣ Rounded Top Curve (Distribution Phase)
Notice the arc shape drawn over the candles.
This is a distribution pattern — a rounding top that shows price is topping out slowly. It’s often a sign that smart money is exiting while trapping late buyers.
🔻Price then dropped aggressively, breaking structure.
5️⃣ BOS (Break of Structure)
A major bearish signal occurred here.
Price broke a recent low and created a BOS (Break of Structure) — a strong confirmation that the market has shifted from bullish to bearish.
👉 What this means: Now we look for retracement entries to go short.
6️⃣ 50% Retracement + Reversal Area
After the BOS, price pulled back to the 50% Fibonacci level and hit a small resistance zone (highlighted in purple). This is a classic area for smart entries.
✅ This level rejected price again — showing bearish confirmation.
7️⃣ Target Zone – 3,330.055
A clean, well-defined target area where:
Liquidity rests
Previous orders may get triggered
Market could react strongly
👉 If price pushes into this zone again, expect a reaction (either continuation or a reversal).
8️⃣ Support Zone – 3,290.345
This is your final support zone if the market continues to drop.
If price breaks this support, it could open room for a larger bearish move.
🎯 Trading Plan (Example):
📈 If price retraces to 3,330.055 and shows rejection → consider short setup
📉 Watch 3,290.345 for bounce or breakdown
❌ Invalidation: Break above 3,370 (major resistance)
💡 Bonus Tip – Trading Psychology:
“Smart money doesn’t chase. It waits for the trap to be set, then strikes with precision.”
Stay patient. Don’t rush entries. Let price come to your zones.
🏁 Summary:
This chart is a full example of smart money manipulation, showing:
Accumulation → Expansion → Distribution → Breakdown
BOS + 50% retrace = high-probability short
Key zones: 3,330 (Target) & 3,290 (Support)
📢 Don’t Forget:
If this analysis helped, drop a like, share, or comment your view below!
#XAUUSD #GoldAnalysis #SmartMoney #PriceAction #TradingView #Minds #ForexStrategy #GoldSetup #SMC #LiquidityZones

BTCUSD – 30m Precision Entry from FVG & Fib Discount Zone🚀 BTCUSD BUY SETUP | May 8, 2025 | Smart Money Precision Execution
This 30-minute chart screams Smart Money accumulation with a golden entry aligned at the 70.5–78.6% Fib levels AND a bullish Fair Value Gap (FVG) just below.
Here’s the confluence breakdown you need to study:
🔍 KEY CONFLUENCES:
🟣 Fair Value Gap (FVG) between $97,800 and $98,550 – prime liquidity zone
📉 Deep Discount Entry at 70.5%–78.6% Fib retracement ($97,797 – $97,200)
🔁 Breaker Block + Internal BOS confirming upside intent
📈 Target: -27% Extension Zone around $100,920
✅ RR: 1:4+ with tight risk below swing low
🧠 Execution Strategy:
Enter near $97,797 – inside the FVG
SL: Below 100% Fib (~$96,800)
TP: -27% Fib (~$100,920) or scale partials at 0% / -10%
Break-even management once price closes above $99,500
📊 Setup Summary:
Timeframe: 30m
Bias: Bullish
Entry: FVG + Deep Discount
TP: -27% extension
SL: Below 100% Fib
RR: 1:4
Structure: Smart Money Reversal
💡 Chart Ninja Insight:
“Smart money enters where retail panic sells. The FVG is the highway—they’re just waiting to get on.”

#TRUMPUSDT expecting further decline📉 SHORT BYBIT:TRUMPUSDT.P from $17.400
🛡 Stop Loss: $17.966
⏱ 1H Timeframe
📍 Overview:
➡️ BYBIT:TRUMPUSDT.P is showing signs of weakness after forming local resistance. The price failed to hold above $17.966 , confirming seller pressure.
➡️ POC (Point of Control) is positioned above the current price, indicating that liquidity has already been distributed in the upper range, while demand zones are shifting lower.
➡️ The price tested $17.400 and started moving downward, reinforcing the bearish scenario. If this level breaks, a move toward $16.412 is likely, where demand was previously observed.
➡️ The $16.412 level may serve as a short-term bounce zone, so monitoring price reaction is crucial.
⚡ Plan:
➡️ Short entry after breaking $17.400 , confirming buyer weakness.
➡️ Risk management through Stop-Loss at $17.966 , placed above the nearest liquidity zone.
➡️ Primary downside target – $16.412 , where buyers may step in.
🎯 TP Targets:
💎 TP 1: $16.412
🚀 BYBIT:TRUMPUSDT.P continues to lose momentum — expecting further decline!
📢 BYBIT:TRUMPUSDT.P remains under pressure, and the current market structure suggests a potential continuation of the downtrend. If the asset breaks below $17.400, the decline may accelerate.
📢 It is crucial to monitor volume—if selling volume increases, the bearish trend will strengthen.
📢 However, the $16.412 level may act as a reversal zone, so partial profit-taking could be a smart strategy.

Learn 7 Types of Liquidity Zones in Trading
In the today's article, we will discuss 7 main types of liquidity zones every trader must know.
Just a quick reminder that a liquidity zone is a specific area on a price chart where a huge amount of trading orders concentrate.
Read carefully, because your ability to recognize and distinguish them is essential for profitable trading.
1. Fibonacci Zones
The zones based on Fibonacci levels can concentrate the market liquidity.
Classic Fibonacci retracement levels: 0,382; 0,5; 0,618; 0.786
and Fibonacci Extension levels: 1,272; 1,414; 1,618 attract market participants and the liquidity.
Above, you can see an example of a liquidity zone based on 0,618 retracement level.
The reaction of the price to that Fib.level clearly indicate the concentration of liquidity around that.
Also, there are specific areas on a price chart where Fibonacci levels of different impulse legs will match.
Such zones will be called Fibonacci confluence zones.
Fibonacci confluence zones will be more significant Fibonacci based liquidity zones.
Above, is the example of a confluence zone that is based on 0,618 and 0,5 retracement levels of 2 impulses.
The underlined area is a perfect example of a significant liquidity zone that serves as the magnet for the price.
2. Psychological Zones
Psychological zones, based on psychological price levels and round numbers , quite often concentrate the market liquidity.
Look at a psychological level on WTI Crude Oil. 80.0 level composes a significant liquidity zones that proved its significance by multiple tests and strong bullish and bearish reactions to that.
3. Volume Based Zones
The analysis of market volumes with different technical indicators can show the liquidity zones where high trading volumes concentrate.
One of such indicators is Volume Profile.
On the right side, Volume Profile indicate the concentration of trading volumes on different price levels.
Volume spikes will show us the liquidity zones.
4. Historic Zones
Historic liquidity zones will be the areas on a price chart based on historically significant price levels.
Market participants pay close attention to the price levels that were respected by the market in the past. For that reason, such levels attract the market liquidity.
Above, you can see a historically significant price level on Silver.
It will compose an important liquidity zone.
5. Trend Lined Based Zones
Quite often, historically significant falling or rising trend lines can compose the liquidity zones.
Above is the example of an important rising trend line on GBPJPY pair.
Because of its historical significance, it will attract the market liquidity.
Trend lined based liquidity zone will be also called a floating liquidity area because it moves with time.
6. Technical Indicators Based Zones
Popular technical indicators may attract the market liquidity.
For example, universally applied Moving Average can concentrate huge trading volumes.
In the example above, a floating area around a commonly applied Simple Moving Average with 50 length, acts as a significant liquidity zone on EURJPY.
7. Confluence Zones
Confluence zones are the liquidity zones based on a confluence of liquidity zones of different types.
For example, a match between historic zones, Fibonacci zones and volume based zones.
Such liquidity zones are considered to be the most significant.
Look at the underlined liquidity zone on US100 index.
It is based on a historical price action, psychological level 17000, significant volume concentration indicated by volume indicator and 618 Fibonacci retracement.
Always remember a simple rule: the more different liquidity zone types match within a single area, the more significant is the confluence zone.
Your ability to recognize the significant liquidity zones is essential for predicting the market movements and recognition of important reversal areas.
Liquidity zones are the integral element of various trading strategies. Its identification and recognition is a core stone of technical analysis.
Study that with care and learn by heart all the liquidity types that we discussed today.
❤️Please, support my work with like, thank you!❤️
