💎 BTC/USDT - Bull or Bear ? (READ THE CAPTION)As you can see, after the last Bitcoin analysis, the price was able to grow from FWB:67K to $71.7K, and today this cryptocurrency fell by more than 7% and is currently trading in the range of $66,500! The first important demand level in front of Bitcoin is $59,000 to $63,000 and the second important demand level is $38,800 to $43,700! As you know, there are only 18 days left until the Bitcoin halving, and the closer we get to this date, the more severe the fluctuations of Bitcoin will be!
Please support me with your likes and comments to motivate me to share more analysis with you and share your opinion about the possible trend of this chart with me !
Best Regards , Arman Shaban
Litecoin (Cryptocurrency)

#LTC/USDT#LTC
The price has been moving in a descending triangle since the beginning of 2022
We are about to break that downward channel
And also the moving average broke 100 upwards
Current price 70.77
First goal 88.14
The second goal is 113.45

LTCN Litecoin Grayscale Trust Parabolic Move Starting Now!As you can see from the chart LTCN has very little resistance from $28.50 to CSE:TO 95 dollars. Once LTCN gets above $28.50 and closes above prefereably on a daily then its game on in my opinion. Next stop would be $95 and then $200 both areas of probably light resistance. The heavier resistance comes in at the prior all time high at $458. The move to $90 could happen very quickly and then from $90 to 200 even faster. I cant predict the timing but it could be as fast as a couple weeks and maybe up to 1.5 months. I think some where in between based on prior moves LTCN has made.
Good luck out there my friends. Check out my Litecoin analysis as well I am updating daily. Also if this adds any value to you please like it and follow me for future updates. Thank you

Ltc 20% ProfitLtc has surges 20% profit after hitting our marked fvg area. A perfect example of bullish FVG.

LTCUSDT 1W LONG📈Hi all. Timeframe 1 week. LTC is fluttering in the accumulation channel near key support. There is a pressure applied to the resistance of the triangle. A decline to the 52.39 zone is unlikely, so I am considering recruiting to the spot from the current ones. Also long/futures during channel breakdown/retest. Marked goals and levels on the chart.

LTC Bull continuation to break above 100$Hello, yeah I know the past week or so was a bloodbath,
So LTC as seen on the chart has just completed the correction from 102 and completed at 78$,
So from there, our entry was at 81.94. so from here im expecting a bullrun to break above 102$.
SO for those that have been hodling LTC, keep on Hodling. the coming weeks are gonna be great and life changing.
NFA as always.

Litecoin Emerges as Second Best-Performing Cryptocurrency Litecoin ( CRYPTOCAP:LTC ) has recently emerged as a standout performer, surging to become the second-best-performing digital asset in the top 100. This remarkable ascent comes on the heels of a pivotal declaration by the United States Commodity Futures Trading Commission (CFTC), cementing Litecoin's status as a commodity.
While meme coins capture headlines with their volatile swings, Litecoin hodlers are experiencing a euphoric rally, celebrating a surge of nearly 11% in the last 24 hours alone. This surge signifies a significant leap for Litecoin ( CRYPTOCAP:LTC ) amidst relatively stable markets, where Bitcoin and Ethereum corrected by less than 2% over the same period.
The CFTC's acknowledgment of Litecoin ( CRYPTOCAP:LTC ) as a commodity holds profound implications for its future trajectory. By delineating Litecoin from securities regulations enforced by the Securities and Exchange Commission (SEC), this recognition paves the way for a plethora of opportunities and integrations. Litecoin stands poised to receive more comfortable endorsements and foster deeper integration into mainstream financial systems, unshackled by the specter of SEC enforcement actions.
The genesis of Litecoin's recent surge lies in the CFTC's lawsuit against crypto exchange KuCoin, where Litecoin was explicitly categorized as a commodity. The complaint detailed KuCoin's involvement in facilitating futures, swaps, and leveraged transactions involving digital assets like Bitcoin and Ethereum, alongside Litecoin.
Litecoin's journey to its current heights has been marked by strategic movements and technical prowess. Trading within a horizontal channel between $63 and $77 for January and February, Litecoin ( CRYPTOCAP:LTC ) broke free from this confinement on February 29, igniting a bullish trend that has seen remarkable gains throughout March.
Technical Outlook
From a technical standpoint, Litecoin exhibits signs of strength and resilience. The Relative Strength Index (RSI) indicates a slight overbought condition, yet bullish sentiment prevails with a dominance of 61% bulls over bears. Litecoin's ability to bounce off key moving averages reaffirms its bullish trajectory and underscores its robust market fundamentals.
Moreover, if Litecoin's ( CRYPTOCAP:LTC ) price sustains its bullish momentum and overcomes the confluence resistance level at $100, it could signal sidelined buyers to step in and potentially kickstart a breakout rally. The Pivot point at $119.84 will be the target for some of these buyers to potentially book profits. This move in Litecoin ( CRYPTOCAP:LTC ) price would constitute a 32% ascent from the current position.
On the other hand, Litecoin’s bullish outlook could face invalidation if the pioneer crypto – Bitcoin triggers a steep correction. In such a case. Litecoin ( CRYPTOCAP:LTC ) price could revisit the $79.78 support floor.

LTC BIG TARGETLTC is at a verge to breakout , if it breaks i have marked the target clearly and we may see up 50% Pump soon in this #DYOR

💎 GTAI/USDT - First Target hit , What's Next ? (READ CAPTION)By examining the GTAI/USDT chart, we can see that after entering the demand range of $3.35, the price went up with the price and was able to hit the target of $4 and even grew up to $4.3, which means more than 35% price growth in less than a week (Cheers) and I hope you have used this analysis! Based on the main analysis, the next targets will be $4.50, $5 and $5.5 respectively! (This analysis will be updated)
Please support me with your likes and comments to motivate me to share more analysis with you and share your opinion about the possible trend of this chart with me !
Best Regards , Arman Shaban

Litecoin Short Term Buy IdeaH1 - Bullish trend pattern.
Currently it looks like a pullback is happening.
Until the strong support zone holds I expect the price to move higher further after pullbacks.

Is there potential for Litecoin?🧐Hello, dear friends!🫶
The potential of Litecoin, like other cryptocurrencies, depends on various factors including market conditions, technological developments, global adoption, investor interest, and several other factors.
Litecoin, like other cryptocurrencies, may experience significant price fluctuations and volatility in the market.
Some investors and analysts see growth potential in Litecoin due to its fast transaction speed and low fees, making it an attractive means for quick and inexpensive fund transfers. However, like any investment asset, there are risks, and the success of Litecoin will depend on a wide range of factors, including market competition, technical innovations, and external economic factors.🤷🏼
After the last halving, the price surged from $40 to over $300. Note that Litecoin's price against Bitcoin has not risen since 2019, but its potential is no worse than many others that are experiencing significant pumps!🚀
I believe that by the end of this year or early next year, Litecoin will continue to grow. And if the price of Litecoin against Bitcoin also increases, the growth potential could be significant.⚡️
We will continue to monitor Litecoin's price movement, especially the wedge that has formed against Bitcoin! It's very interesting!
How do you feel about Litecoin? Do you prefer "quiet" coins or do you like to chase hype? I'd like to hear from You in the comments!
Thanks for Your attention, subscribe to stay connected!💙💛
Sincerely yours, Kateryna💋

Ltc ideaLtc chart is very bullish from couple of days and it did breakout of previous high and formed bullish structre now. Thats ehy i will look for long oppertunity. I got my long long oppertunity in fvb+ob area which is marked onto the chart. Whats your opinion?

Litecoin (LTC): Target 1 hit! ...what's next?Hi Traders!
The Trend returned to bullish on the daily chart and our setup worked correctly reaching Target 1 around 102.00 area (see chart below). That said, if Litecoin manages to hold the supports shown on the chart, we still expect an interesting bullish continuation with our new Target 1 around the 130 area. With this in mind, we do not rule out some corrective structure in the near term, but if it happens it should be considered as a Buy Opportunity. As we can see on the daily chart, we are approaching the first major resistance around 108 area, if it wants to break it, it should do so within a couple of sessions.
Litecoin Setup (Part. I)
======================
Trade with care
Like | Share | Comment

short LTCLitecoin bounced down off the resistance level and broke through the ascending trendline. A decline to support level at $78.1 is expected to happen

Cryptolean Litecoin LTC UpdateIn the daily LTCUSD chart, in the beginning of the week, Litecoin had a fake-out to below $80.43 into the daily range zone.
However, it recovered strongly, re-confirming $80.43 as a support.
The current price action in Litecoin is very interesting as it is testing the key daily resistance of $88.82-$92.07.
A bullish break-out of $92.07 is needed to have a rally towards $100.
A bearsih rejection of the key daily resistance of $88.82-$92.07 will lead to a re-test of $80.43.

LTC is forming a Head and Shoulders patternLTC is rising to the $95-$100 price range to form a Head and Shoulders pattern in the D1 time frame.
If the scenario is correct, LTC will then fall to the $55-$68 area or lower

💎 MPC/USDT - Bull move Ahead ? (READ THE CAPTION)After checking the chart of a new cryptocurrency named MPC/USDT (Partisia Blockchain) , after this cryptocurrency was listed on the Kucoin exchange, it was accompanied by a strong growth and was pumped by about 360%! After this growth, the price fell again and filled this liquidity gap! Now a new LV has been created and I expect that if the price stabilizes above the $0.43 level, this cryptocurrency will grow again, and its possible targets are 0.507, 0.54, 0.5920 and 0.65, respectively! Its long-term target is also above 1$!
Please support me with your likes and comments to motivate me to share more analysis with you and share your opinion about the possible trend of this chart with me !
Best Regards , Arman Shaban

Dinosaur Coins - LTC, IOST, ENJ and ICX - BIG Move ComingMartyBoots here. I have been trading for 17 years and I am here to share my ideas with you to help the Crypto space. The Bull market is here
Dinosaur Coins - LTC, IOST, ENJ and ICX - BIG Move Coming
If you understand market structure then you would see that these coins have great potential for a move higher . The all look to be setting up for a move in the near future . The bull market is here so do not sleep on these coins .
Please watch the video for more information

Litecoin (LTCUSD): Another big long-term opportunity incomingLitecoin (LTCUSD): BINANCE:LTCUSD
For Litecoin, the analysis starts from December 2018, focusing primarily on the activity from 2021 to the present. It indicates that the major Wave II concluded at $41.60, and currently, Litecoin is in a major Wave III that is expected to exceed $413, representing a potential increase of 450%. This projection is based on a detailed examination of the coin's performance after the first two bull markets, suggesting significant growth potential within this cycle.
The strategy involves waiting for an opportune moment to enter the market, aiming for long-term holding rather than immediate action, based on the completion of sub-Wave 1 and 2 in red, with Wave 2 ending at $57.71. The current phase is believed to be within Wave 3, anticipated to reach between 161.8% and 361% extension, equating to a price range of $162 to $290. The upper limit of $290 is considered the maximum for this Wave 3, as going beyond would be unusual and not align with typical Wave 3 behavior.
By zooming into the 4-hour chart, short-term entry points are being identified, noting that Wave ((iii)) in black has already developed a smaller sub-wave and is currently in a minor Wave (iii) in blue, expected to significantly increase shortly. Our plan now is to wait for a correctional Wave (iv), which may take days or weeks to materialize, at which point a limit order will be placed for our long-term investment, as we missed the end of Wave 2 due to the timing of our analysis.

[LTCUSDT] - very similiar scenario🔥LTC raised 600% in previous bull run after breakout .
we can notice in weekly chart that the same scenario repeat it's self.
successfull retest must be considerd to get 400% up.
so must keep it in ur watchlist.
don't forget to support us with ur like, comment and follow for more updates🎯

LTCUSD 1WLTC ~ 1W 📈
#LTC Make purchases in stages from here, minimum target 25%. 🔼 Bulls will continue to Dominate as long as price is above this Resistance Line.

LTC: buy-low .. sell-high📊Analysis by AhmadArz:
🔗"Uncover new opportunities in the world of cryptocurrencies with AhmadArz.
💡Join us on TradingView and expand your investment knowledge with our five years of experience in financial markets."
🚀Please boost and💬 comment to share your thoughts with us!

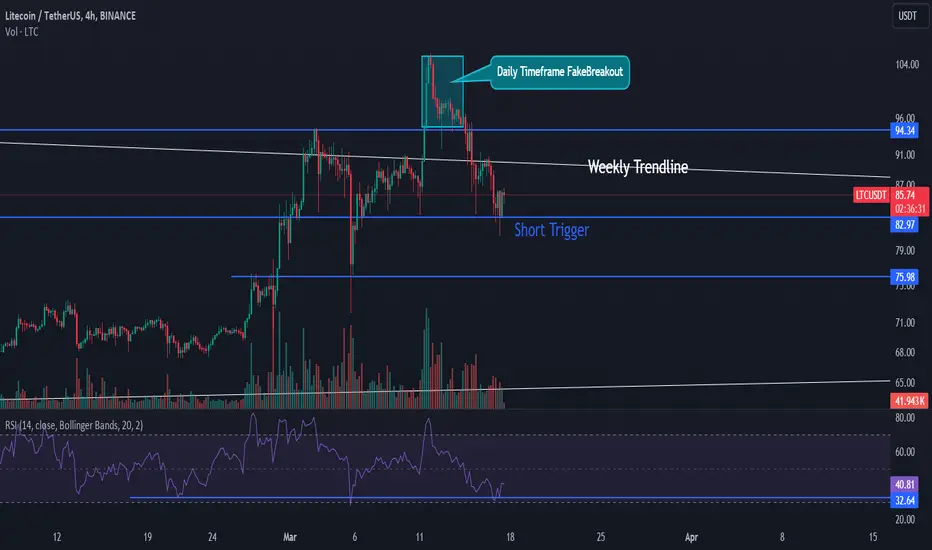
📈LTC Analysis: Short Position Opportunity in Volatile Market🔥🔍Today, we are focusing on analyzing LTC for future prospects. It's worth noting that it's Monday, typically associated with lower market volume and increased market volatility.
🔒On the 4-hour timeframe, we find ourselves within a trading range, with the resistance ceiling at $94.34 and the support floor at $82.97. A recent rejection from the upper boundary suggests that sellers have more strength compared to buyers. Thus, initiating a short position could be a more secure move.
📉In case the $82.97 support level is breached, entering a short position with a target price of $75.98, accompanied by a well-defined stop-loss, could offer a minimum risk-reward ratio of 2.
💎The SMA7 indicator has converged with the price, potentially signaling further downward momentum. If the SMA7 fails to maintain the trend, we'll wait for confirmation from the SMA25. Failure on both indicators may lead to a sideways movement, possibly retesting the upper boundary of the trading range. 📊In the recent downtrend, the volume of red candles has diminished compared to the initial wave. While this could be attributed to the typically lower trading activity on Sundays, a resurgence in volume from tomorrow onwards is essential. Failure to observe increased volume could indicate weakness in the trend.
💥 Additionally, the RSI oscillator provides a critical support level at 32.64. Simultaneous breach of the $82.97 support level and the RSI support could serve as another confirmation for a short position.
❌In conclusion, vigilance is paramount today. If the short position trigger is breached or if setting a large stop-loss to avoid unnecessary risk or setting too small a stop-loss to quickly hit the target, it's crucial to maintain a balanced approach.
🧠💼It's important to acknowledge the inherent risks in futures trading, with the potential for margin calls if risk management is neglected. Always adhere to strict capital management principles and utilize stop-loss orders, ensuring that the initial target offers a risk-to-reward ratio of 2.