Litecoin Macro outlook vs USDI've been seeing lots of LTC, hopium bullish into the halving, tweets.
Well, the reality is that when the 12 and 21 EMAs cross to the downside on the weekly chart, it tends to be very bearish for Litecoin.
Arrows are presenting those crosses, and you can see the downside that happens after the crosses happen.
On average, the downside is 58%.
That would mean that Litecoin could bottom somewhere around $25-35, if the cross happens.
Usually, Litecoin's pre-halving pump tends to be over 3–4 months before the halving(the halving is happening in August), which is another indicator that LTC topped.
But there will be sunshine after the rain.
Those lows would mean that LTC hit the generational bottom, and at the same time, the BTC pre halving hype will start.
That is when Litecoin and Bitcoin tend to proceed into a multiyear bull market, which will be led by Litecoin.
Follow, like the idea and feel free to leave a comment.
Check out other ideas if you like this one.
Litecoin (Cryptocurrency)

Litentry (LIT) forming a bullish Shark for upto 28.50% pumpHi dear friends, hope you are well and welcome to the new trade setup of Litentry (LIT) with US Dollar pair.
Previously we caught a nice of LIT as below:
Now on a 4-hr time frame, LIT is about to complete a bullish Shark move for the next price reversal.
Note: Above idea is for educational purpose only. It is advised to diversify and strictly follow the stop loss, and don't get stuck with trade.

LTC : Likely Repeating 2020 Fractal 📈Hi Traders, Investors and Speculators of Charts📈📉
LTCSDT / Litecoin is looking ready for another bullish cycle after a clear completion of the Elliot ABC correction Waves.
We see a very similar pattern playing out during 2020 and it gives us a good idea of what to expect from LTC before another parabolic rally.
While you're here 👋 Check out this idea on CRV :
_______________________
📢Follow us here on TradingView for daily updates and trade ideas on crypto , stocks and commodities 💎Hit like & Follow 👍
We thank you for your support !
CryptoCheck
CRYPTOCAP:LTC BINANCE:LTCUSD.P BYBIT:LTCUSDT COINBASE:LTCUSD BINANCE:LTCUSDT

LTCUSD ❕ reached the supportLTC has reached a strong support level.
The price instantly reacted to reaching the level.
I believe that the asset will rebound if the level is held.

LTCUSD: Are you guys ready for 124?Dear traders,
Hope you are doing great, we have an excellent opportunity to be involved with this great cryptocurrency LTCUSD currently in consolidation phase and soon we will be seeing an excellent BULLISH IMPULSE taking price to the maximum level 124.00

#LTCUSD- LONG BIG MOVE TARGETING 106!-After a months of bearish and seller control price recently have shown the bullish reversal, potential a long bull trend has began. Price bounced at the daily external liqudity zone.
-Our first target that we are aiming is 106 however if we break that trend then it will be an indication of the long run.
-Trade will be activated once it shows some retracement so we will have a spot on entry.
-If you like the idea, do let down your views in comment.


LTCUSDT we are ready to take these profitsLTCUSDT comfortably sits at the downtrend trendline and the 61.8% Fibonacci retracement support. This is highly likely to be the point of a trend continuation. We expect the price to reach the 161.8% Fibs target relatively soon.

LTCUSD Will Go Higher! Buy!
Take a look at our analysis for LTCUSD.
Time Frame: 12h
Current Trend: Bullish
Sentiment: Oversold (based on 7-period RSI)
Forecast: Bullish
The market is trading around a solid horizontal structure 84.13.
The above observations make me that the market will inevitably achieve 90.56 level.
P.S
The term oversold refers to a condition where an asset has traded lower in price and has the potential for a price bounce.
Overbought refers to market scenarios where the instrument is traded considerably higher than its fair value. Overvaluation is caused by market sentiments when there is positive news.
Like and subscribe and comment my ideas if you enjoy them!

"Litecoin halving" took place. Where will the LTC price go?Yesterday, on 02.08.23, "LTC halving" took place on the 840000 block. Now the reward for a mined block has been halved, from 12.5 to 6.25 LTC.
Given that yesterday the cryptocurrency market made several attempts at correction, the LTCUSDT price did not show any "independence" and also adjusted downward.
Now, the LTCUSD price has approached the potential buy zone of $79-86. The medium-term outlook is for growth to $130-136 in the blue scenario.
However, it is worth remembering that after the two previous "LTC halving", the LTCUSDT price moved against the logic: decreasing supply = increasing price.
We described more about the LTCUSD price movement after the halving here:
Therefore, we have a critical level of $79.
If the LTC price consolidates below it, the red scenario will be activated. And this scenario implies a long descent of the Litecoin price down to the strong liquidity zone of $47-56.
_____________________
Did you like our analysis? Leave a comment, like, and follow to get more

LTCUSDTHello guys...
as you can see the ltcusdt formed an ascending trendline so we assume it would be bullish in the few next weeks.
on the other hand, this coin formed a Quasimodo pattern as well so the blue area is great for getting a long position!
the target is $95.5!
Probability of success=67%
______________________________
always do your research.
If you have any questions, you can write them in the comments below, and I will answer them.
And please don't forget to support this idea with your likes and comment

45m: $LTC - Beautiful; Trendline BustedHey y'all. Lets just appreciate how beautiful LTC looks this fine Saturday.... ;)
Jokes aside, LTC can busted through the local trendline on the 45min time-frame and is now breaking above the local demand line and is getting some nice follow through from the bullish divergence i.e the RSI.
LTC is looking pretty good compared to some of the other coins and its price movement/structure is a lot more appealing when trying to size up the asset and make a better judgment on where she might go.
However, we must get confirmation via a backtest of the local demand line in order to feel a lot more confident IF one was going to put in a position.
These are just my opinions and me just charting pretty things on a saturday night.... ;)
Later traders
/r
-B

LTC/USDT possible Scenarios? 👀 Litecoin Today Analysis💎 LTC is making some intriguing moves. We've observed that it has effectively mitigated the previous Order Block (OB) and, in response, embarked on a downward journey.
💎 Currently, the price seems likely to continue its downward trend, as we have an OB at $81.59. LTC might initiate a bullish move from this point.
💎 Another factor to consider is that if the price fails to take a bullish turn from the $81.59 level, it could re-enter the supply area again at $70.82.
💎 The $70.82 level is of utmost importance because there's no more liquidity beyond that point. A bounce back from this area could set the stage for a bullish move.
💎 In the dynamic world of crypto, staying informed and adaptable is key. Stay tuned for more updates and enjoy your trading journey

LTC/USD OUTLOOK FOR THE NEXT BULL RUN 👀🇬🇧 For the moment the halving is manifesting itself as a "Buy the rumor, Sell the news"
In my view I believe we will see a -40% decline over the next 6 months and complete the symmetrical triangle. Waiting for interesting buying areas, ideally 55/65
Long-term target (2024) 330, any price spikes would also bring it to around 500. It is always an altcoin of dubious utility to be taken with a grain of salt.
🇮🇹 Per il momento l'halving si sta manifestando come un"Buy the rumor, Sell the news"
A mio avviso credo che assisteremo a un calo del -40% nei prossimi 6 mesi e completeremo il triangolo simmetrico. Aspettando aree interessanti di acquisto, idealmente 55/65
Target di lungo periodo (2024) 330, eventuali spike di prezzo lo porterebbero anche intorno ai 500. Rimane sempre un altcoin dalla dubbia utilità' da prendere con le pinze.

Litecoin may lose more valueLitecoin may see further downward pressure in the coming days if it breaks the yellow resistance line which has been hit many times before, also currently the US stock market is selling off so big players might sell cryptos to have more liquidity, cover the margin call, or ......
This chart is COINBASE:LTCEUR but also you can draw the same line for $LTCUSD.
What is the adage? Don't try to catch a falling banana or cat or something whatever.
I am not short but I'll wait to buy back at a lower price.

#LTC/USDT 1D (ByBit) Symmetrical triangle breakout and retestLitecoin is pulling back to 100MA support when it seems likely to bounce and resume bullish.
⚡️⚡️ #LTC/USDT ⚡️⚡️
Exchanges: Binance Futures, ByBit USDT
Signal Type: Regular (Long)
Leverage: Isolated (3.4X)
Amount: 5.0%
Current Price:
93.07
Entry Zone:
92.71 - 88.49
Take-Profit Targets:
1) 103.31
2) 112.87
3) 122.44
Stop Targets:
1) 79.97
Published By: @Zblaba
CRYPTOCAP:LTC #LTCUSDT #Litecoin #PoW #Halving
Risk/Reward= 1:1.2 | 1:2.1 | 1:3.0
litecoin.org

LTC: Support BreakoutLitecoin (LTC) technical analysis:
Trade setup: Following a breakout from a Symmetrical Triangle, price reached $115 resistance where it got rejected. Now it’s broken back below 200-day Moving Average (~$90), which puts the uptrend at risk. We need to see the price regain that level to signal uptrend resumption, with upside to $115.
Trend: Downtrend on Short-Term basis, Neutral on Medium-Term basis and Uptrend on Long-Term basis.
Momentum is Bearish ( MACD Line is below MACD Signal Line, and RSI is below 45).
Support and Resistance: Nearest Support Zone is $90, which it broke, then $80. The nearest Resistance Zone is $105, then $115.

After Halving, LTC makes a new roundDaily Chart
Litecoin BINANCE:LTCUSDT has support in range 75 - 70 that is reasonable price to buy Litecoin
Wait and see next move

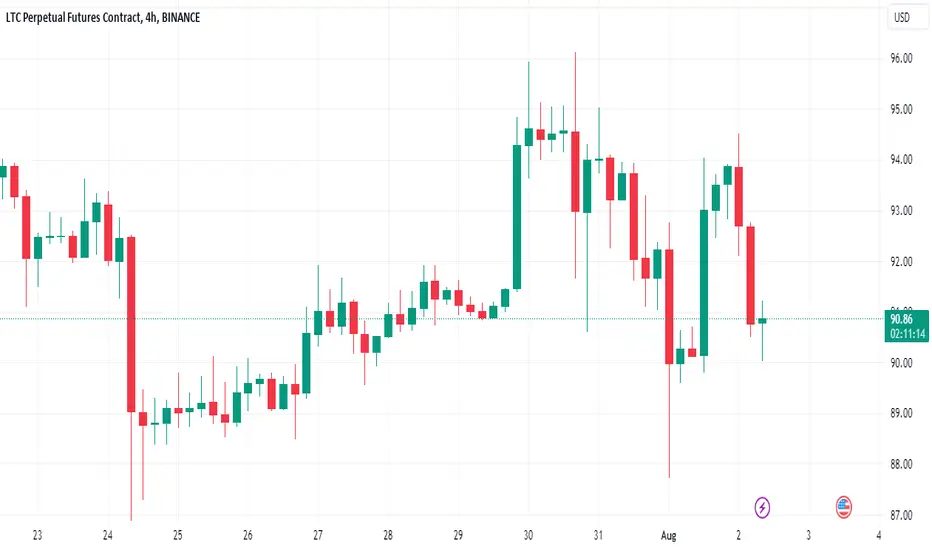
Litecoin LTCUSDT Price Analysis (4h)📊🚀 Litecoin (LTC) Price Analysis 📈💹
Litecoin is currently consolidating near a critical support zone at $86-85, presenting a crucial juncture for traders. 🔄 The price has the potential to break out towards the target at $95, offering an opportunity for bullish momentum.
However, it's important to remain cautious, as there is also a possibility of a bearish breakout that could lead prices towards the $77 level. 📉🐻
Stay vigilant and closely monitor the price action for potential trading opportunities. Happy trading! 🚀💰

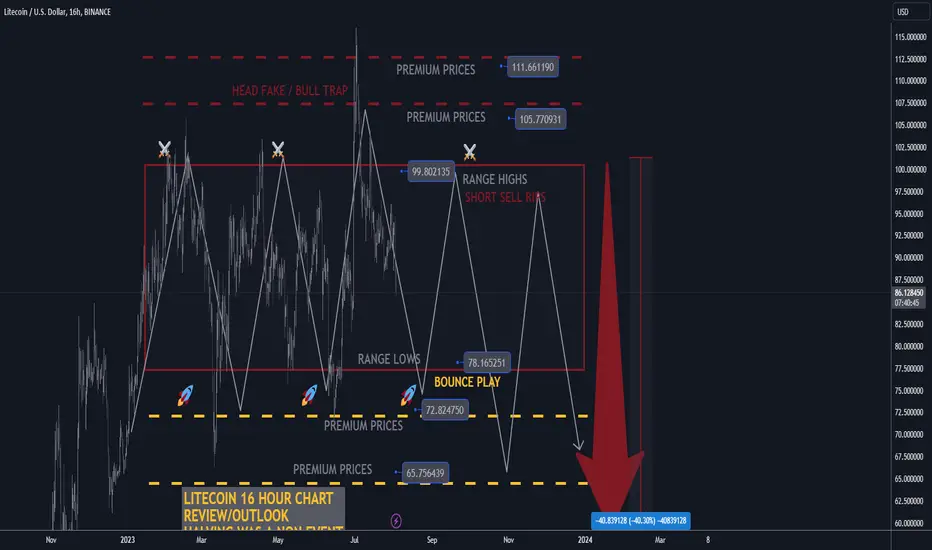
ltcusd h16 halving was a non-event now we dump🔸Hello traders, let's review the 16hour price chart for LTC today. Halving was a non-event
and degen dreamers and gamblers got rekkt once again, sorry about that.
🔸Past history of LTC halvings show that we dump into red after the halving. there is no
bullish impact on prices of litecoin. currently distribution in range trading near 85 USD.
my final PT bears is 60 USD.
🔸Recommended strategy LTCUSD bears: wait for a bounce later to initiate from 80 USD
and rejection after the bounce near 95-100 USD and re-short from resistance. Conservative
TP bears is 60 USD. good luck traders!
🎁Please hit the like button and
🎁Leave a comment to support our team!
RISK DISCLAIMER:
Trading Futures , Forex, CFDs and Stocks involves a risk of loss.
Please consider carefully if such trading is appropriate for you.
Past performance is not indicative of future results.
Always limit your leverage and use tight stop loss.
WHY LTC COIN PRICE DROP ? LTC COIN POSSIBLE MOVES !!LTC coin breake now its 4h support.
MACD & RSI ARE BRAISH ON 4H & 1D TF.
Now possible its price bounce back from 82$ [ 1d support }
follow me for more analysis

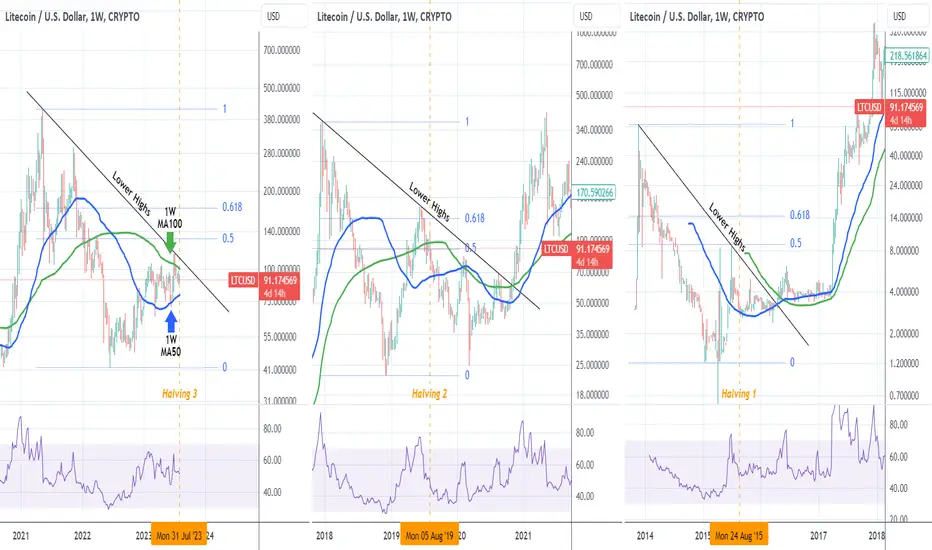
LITECOIN Halving only a few hours away! Is it bullish or not?Litecoin (LTCUSD) is having its 3rd Halving event in less than 5 hours from the time this analysis was constructed. The question on everyone's mind is how will this affect the price action? Will it be bullish or bearish? A reliable way to answer this is by looking into the past events and how those affected LTC.
The previous two Halvings were on August 05 2019 (Halving 2) and August 25 2015 (Halving 1) respectively. All halving events have caught the price on a pull-back after a break above the 1W MA100 (green trend-line) with the 1W MA50 (blue trend-line) supporting. During the previous two, the price managed to reach the 0.5 Fibonacci retracement level, while on the current Cycle it came $25 shy of it.
It appears that the current Bull Cycle has started on a slower pace than the previous two, as also illustrated on the 1W RSI, which hasn't yet crossed the 70.00 overbought barrier. They key is the Lower Highs trend-line, which on all Halvings made contact with the pre-Halving Lower High and once broken the price never made a Lower Low again. If you want to take the safest buy entry possible, wait for that break-out to happen.
-------------------------------------------------------------------------------
** Please LIKE 👍, FOLLOW ✅, SHARE 🙌 and COMMENT ✍ if you enjoy this idea! Also share your ideas and charts in the comments section below! **
-------------------------------------------------------------------------------
💸💸💸💸💸💸
👇 👇 👇 👇 👇 👇
Crypto Market in 24 Hours: Bright Outlook ⛅, LTC Halving LoomSunny trading conditions with a few scattered clouds ⛅ prevail on the global crypto market in the next hours and days, signaling a slightly bullish market with upside potential. Cryptos rebound following Tuesday’s sell-off.
Bitcoin rises 2.3%, and Ethereum puts on 1.1% in the past 24 hours. The price of Bitcoin fell below the psychological $29,000 threshold due to the SEC lawsuit against a crypto entrepreneur and the dollar's strength ahead of US macro data release. Litecoin halving looms later today, diminishing the coin's mining reward. 🚀💰
Follow us for more crypto weather reports!