Bitcoin Finds Support, Relation 2 Altcoins Market & Bullish TalkBitcoin is trading right now between the 0.5 and 0.382 Fib. retracement levels relative to the last bullish wave. Let's dissect what this means.
The main levels are always 0.382 and 0.618 when it comes to Fibonacci retracements. The 0.5 level is also relevant and pairs tend to find support around this line.
Bitcoin broke the 0.382 Fib. level decisively but on very low volume.
Bitcoin failed to test 0.5 Fib. retracement level as support.
The fact that volume is low and 0.5 wasn't pierced works in favors of the bulls.
Notice that 0.618, the golden ratio, is not even in question. This is because the market is ultra-bullish. When the market is bullish, a reversal tends to happen at 0.382 or above 0.618. The fact that Bitcoin stopped its fall above this major support is good news for the bulls. This is good for those that are trading Bitcoin LONG. Just hold patiently because prices will recover and Bitcoin will grow. Not only grow but massive growth.
Signals continue to develop from the Altcoins market, today is not the same as yesterday, today we have a continuation on many, many big and small pairs.
At first, it would be doubtful to trust the signals that I am showing because the action was young in some cases, in other cases it was weak and small. But this isn't the case anymore.
Very big projects such as Aptos, Bitcoin Cash, Litecoin, Polkadot, Zcash and Maker are only a few of the many examples I've been showing you. This is enough to know, confirm and trust that the bottom is already in, the Altcoins market is going up. The only way the Altcoins can grow is if Bitcoin is also going to grow. The Altcoins never move up while Bitcoin is bearish. Seeing an Altcoin growing 100%+ in a single day means that the bears are weak while the bulls are strong. We are experiencing the final-final flush before a major, massive, incredibly, hyper, uber-rich Cryptocurrency market bull-run.
So support is good and support is really strong. The 0.5 Fib. retracement level sits at $79,000 but this level wasn't hit. Bitcoin bottomed before hitting $82,000 but some people are saying lower and this is where confusion comes.
I understand that we have many great traders and market analysts. TradingView is truly the best place in the world (Internet) for trading, learning, growing and sharing about financial markets and charts. But these same markets and charts can't lie. We can interpret some signals in a way that is detached from reality but the market is never wrong. Whatever is about to happen, it is clearly revealed when we look at the charts.
FIOUSDT is another pair that is breaking up just too strong after a higher low. The low being 3-February and the higher low a few days ago (25-Feb). This is just another confirmation that the correction is over; we (Bitcoin) are going up next.
It is great to be part of this market and this community.
It is such a blessing to have access this kind of knowledge and information. Because I can read this now I can rest easy and be calm. I know that regardless of what happens, Bitcoin is going up.
Bitcoin isn't going up in years to come, nor in the future far away. Bitcoin is set to grow, together with the Altcoins market, in a matter of days.
Are you ready for the 2025 bull-market?
Thank you.
Your continued support is appreciated.
We are winners and will continue to win regardless of what is takes.
We will pour our hearts, our sweat and our blood into what we do and trust. If today I make the right decision, tomorrow I am taking a big bag of money home.
The Cryptocurrency market is changing (saving) the world.
The money monopoly is over.
Money used to mean bondage, now, money is freedom.
Namaste.
Litecoin (Cryptocurrency)

LITECOIN ($LTC)—$130 SPIKE FLAGS BIG TRADELITECOIN ( CRYPTOCAP:LTC )—$130 SPIKE FLAGS BIG TRADE
(1/9)
Good afternoon, TradingView! Litecoin ( CRYPTOCAP:LTC ) is buzzing, up 25% to $ 130 in 2 days 💰 ETF hype swirls, let’s unpack this crypto sleeper! 🌍
(2/9) – PRICE POP
• Surge: $ 106 to $ 130, 25% jolt 📈
• Avg: $ 114.98 since Dec ‘24 💡
• Rank: Top weekly gainer 🌟
CRYPTOCAP:LTC ’s flexing, dino coin roars!
(3/9) – TRADE SETUP
• Range: Bouncing at $ 114.98 🚗
• Gain: 25% in 48 hrs—swift climb 🌞
• Past: Steady over a decade 💪
CRYPTOCAP:LTC ’s brewing, short-term juice flows!
(4/9) – ETF BUZZ
• Odds: 80% for LTC ETF nod 📊
• Impact: Institutional cash looms 🌍
• Vs BTC: Digital silver shines 💎
CRYPTOCAP:LTC ’s gearing up, big bets ahead!
(5/9) – RISKS IN PLAY
• BTC Shade: King’s glare dims ⚠️
• Volatility: Swings sting quick 🐻
• ETF Wait: Regs lag, hope wobbles 🔒
CRYPTOCAP:LTC ’s hot, can it dodge the fade?
(6/9) – SWOT: STRENGTHS
• Stay: Decade strong, legit cred 💪
• Pop: $ 130 spike, 25% zip 🏋️
• Base: Steady $ 114.98—tough nut 🌱
CRYPTOCAP:LTC ’s gritty, silver’s got guts!
(7/9) – SWOT: WEAKNESSES & OPPORTUNITIES
• Weaknesses: BTC’s shadow looms 🙈
• Opportunities: ETF buzz, trader zing 🌏
Can CRYPTOCAP:LTC vault past the pack?
(8/9) – CRYPTOCAP:LTC ’s $ 130 pop, what’s your vibe?
1️⃣ Bullish, $ 150+ stacks up 😎
2️⃣ Neutral, Holds, risks linger 🤷
3️⃣ Bearish, $ 100 dip looms 😕
Vote below! 🗳️👇
(9/9) – FINAL TAKEAWAY
CRYPTOCAP:LTC ’s $ 130 spike and ETF buzz spark zing, silver sleeper 🪙 Steady grit, risks lurk, gem or bust?

LTC/USD Secondary trend (part). 09 12 2023Logarithm. Time frame 1 day. Part of the secondary trend. Channel to work, price consolidation in its lower part. A high probability of an upward exit from it. Key levels are shown by arrows. Percentages for clarity and target orientation similarly.
This is how it looks like on a line chart without "market noise". .
Double bottom with a flat top in an accumulation channel. Post-halving time.
A local uptrending channel that has a double bottom with a flat top. This is a strong bullish pattern that says price is (this accumulation zone) at the lows of the trend initiation. The last cycle after the capitulation (end of the participation phase) of all liquid instruments (this is important) began with this structure, which is a display of the actions, first of all, of large market participants that have an impact on pricing (holding). For example, look at the bitcoin 2020 chart and this structure. Similar to what happened on LTC a few months after the halving.
Major trend. Cycles. Super profits.
LTC is a cryptocurrency that has survived many cycles and has not depreciated completely, although it can be seen that the capitalization and leadership positions are not able to compete with the new 2 cycle HYIP giants.
From the position of the cycle before last (distributions, i.e. highs) 2017, this cryptocurrency is on a big super profit. There are very few cryptocurrencies in the crypto market that are in their main trend in an uptrend and are on super profits relative to previous cycles. LTC is one of them. As a rule, the opposite is true. It is clear that the main major holders in most cases for such a long period of existence in the crypto market, LTC has already been repeatedly changed. But with this logic of the price chart, which is displayed on a long history and on a large time frame, should be considered and taken into account in its risk management.
Major trend. Time frame 1 month.

LTC/USD Main trend. Halving. Cycles The psychology of repetitionMain trend. The graph is logarithmic. The timeframe is 1 month. This idea is relevant both for understanding the secondary trend work and as a training in simple cyclic, logical manipulation processes. Note also the halving of the LTC and the designated time zones between cycles.
The primary trend is an uptrend in which a huge butterfly is forming (forming part 2)
Secondary trend is a downward channel.
Local trend in the secondary trend is a wedge.
Coin in the coin market : Litecoin
The chart is taken from the Bitfiniex exchange, I used it because of the long price history (the coin has been traded on this exchange for a long time). Of course, the chart is relevant for all exchanges with liquidity. The coin and the pair are liquid, it is acceptable to set large positions. The price behavior is predictable. Ups/Downs are similar. Let's consider them below.
Everything is unpredictable only for absolutely predictable people, it always was, is and will be.
Same time frame on a line chart (no market noise, pure trend direction)
A close-up of this area on the line chart.
And this area on the candlestick chart.
What matters is the average buy/sell. Approach the market regardless of the size of your deposit as a major market participant. Stop thinking like a "hamster". You don't need to guess, you need to know and be prepared for any outcome, even unlikely scenarios.
Psychology of behavior in the market.
Expectation. Reality. "Stop-loss resets. Cyclicality of predictable behavior. .
Predictable price behavior. "Knockouts" of obedient (acting by the rules) and naughty (acting on emotion) fools are as logical and predictable as anything else everywhere else. Increase your knowledge and experience, and it won't affect you.
Remember, theory without practice is nothing. Real trading is very different from theory, you should understand that. That's why all "programmed traders" lose money or their earnings are quite modest.
You should not ask anyone where to buy/sell this or that crypto-asset. You should initially know yourself under what conditions you will buy and under what conditions you will sell.
Past "stop-losses" before secondary trend reversals .
Secondary trend reversal zones and "takeout" before pullbacks in 2019 (+450 average) and 2021 (+900% average).
Candlestick chart. 3-day timeframe. Fear peak zones.
Line chart. Three-day timeframe. Fear peak zones. (without market noise).
As we can see, this "fear peak" on the line chart evaporates, all these local "super resets" have no effect on the trend. It's just the "death of hamsters." The capitulation of human stupidity and greed. You can add predictability and submissiveness to this. The train always leaves without such marketable characters.
Such always sell (fear) at the lowest prices, shortly before the trend reverses. It is worth adding that they buy at the highest prices "at the behest" of the pump to get fabulously "rich. This makes the cryptocurrency market super profitable. Such fuel is the basis of profit. "Market fuel flows" lend themselves to cycles.
Price management is the psychology and manipulation of people's minds through basic instincts through price values. All of this is real and as old as the world. A foolish person keeps stepping on the same rake, each time telling himself that this is the last time, or this is a special case.
This "last case" must be repeated systematically, but in different conditions that you create. Your effectiveness depends on how masterful you are at forming such obsessive thoughts in the mind of such market characters.
Fundamentals of Trading. Trading strategy. Capital management. Price forecasting.
It is your trading strategy and money management, based on your experience, that is the basis of trading, not guessing the price. But guessing is what most people want. Such people should have no money. As a rule, such people in real life are very poor, do not have their own business, go "to work" (do not want to take responsibility).
They think real life doesn't give them many resources, but market speculation will quickly make them fabulously rich. Rather the opposite is true. Total impoverishment regardless of the direction of the trend due to the reinforcement of destructive qualities of a person with financial instruments. The behavior of such people in the market is a projection of what they are like in real life.
The behavior of people in financial markets is a projection of what they are in real life. That is, their positive and negative psychological qualities. You can't run away from yourself. A stupid person will be overtaken by his own stupidity, a greedy person by greed, an intolerant person by intolerance, an indecisive person by indecision, an irresponsible person by irresponsibility.
Such will be punished by their own destructive qualities. The main thing is that the victim draws conclusions from this and it is an incentive to correct the root cause and basis of the failures, rather than looking for the culprit of his own stupidity in "random events" and other people.
You guessed once, second time, third time zeroed in and hit your own self-confidence with your own stupidity and predictability. Consequently, all your previous guesses at the distance equals zero.
Trading is a probability game. It is impossible to guess everything because of the many components of pricing. It is possible not to guess, but to know the more and less potentially realizable probabilities because of certain market conditions.
No one knows the exact future, there is only an assumed more likely future and the work that leads to it.
The basis of profit/loss is what you are in the here and now. Your knowledge and experience are projected onto the chart. The symbiosis of these two parameters makes or loses money in practice.
Read these 6 points carefully:
1) The first problem most marketers have is that everyone wants to get a lot of money in the moment and, most importantly, without effort. That's what most people want, so it's not rational or dangerous to satisfy their desires.
2) The second problem is that they can't be "out of the market" until they find a good entry point. "Fear of missing out" does its destructive work.
3) The third problem is, of course, the disease from "childhood," which manifests itself in adulthood. People begin to collect various crypto coins, endowing them with different values according to their beliefs and, above all, their desires.
4) The fourth problem is greed, insatiability combined with inexperience. People don't want to protect their profits, they want more and more and more and more and more, eventually from greed and inexperience they completely (more greedy) or partially (less greedy) nullify themselves.
5) Lack of knowledge and experience. Lack of desire to develop and learn. The less experienced a market participant is, the more confident he is in his competence and "screams text".
6) The sixth most serious problem - laziness. It manifests itself in the fact that few people want to work, everyone wants to have.
Under ideas are captured my trading ideas for this trading pair over the past 3 years. Most of them are previously closed trade ideas. There are 3 learning ideas that I have shown on this trading pair (based on publicly published simple trading ideas) .

The fate of Litecoinhello friends
Here we have two scenarios:
1_ Channel failure and reaching specified goals.
2_ Falling from the roof of the channel and buying in steps.
Considering the high probability of approval of Litecoin ETF, the first scenario is more tolerant.
*Trade safely with us*

LTC Litecoin Fireworks Are About To Start ETFs Loading UpHello my friends, Im sorry for not being here for a while, my life was very busy over the past year. Im hoping now that things are settled down I can do these charts again regularly.
That aside lets get into Litecoin. Litecoin has been outperforming almost the entire market lately moving from 25th position on Coinmarketcap to now 12th position over the course of just a couple months or so. Litecoin is showing big time strength over all the others. Every day its holding onto more and more of its gains while others are making new lows or lower highs. We are at the apex now. Litecoin must break over $147 and close that candle on at least the 2 day to be confirmed. Once that happens I don't think there will be many pullbacks from there and if there are they will short lived.
The ETFs for Litecoin are really gaining steam. Charlie Lee did an interview back in I believe it was December with The Litecoin Forecast YouTube channel and Charlie was saying that if anyone had large amounts of Litecoin and wanted to help seed the Canary ETF to contact him directly. The ETF is coming 100% there is no question about that. Once these ETFs get approved Litecoin has such an illiquid supply the price of Litecoin will skyrocket so fast and so high it'll leave everyone in disbelief and with their mouths dropped. Miner reserves are at an all time low, so no serious dumping or resistance levels along the way like previous runs. People and institutional buyers are realizing that Litecoin is the second Bitcoin. they realize that Litecoin is THE Altcoin and the rest are just clones, copies and junk. The fact that Litecoin is te most used crypto worldwide and has been for a long time shows that the PEOPLE chose Litecoin over all those other chains to transact in, even over Bitcoin. People are realizing that Litecoin is the better Bitcoin and was made to be that way. There is no denying that Litecoin is the chosen crypto, its provable with on-chain metrics! No hype, no advertising, nothing just pure organic adoption. Thats what make a winner in this space. We dont need a tweet from Elon or constant promises and upgrades to keep Litecoin relevant. Litecoin will move to the #2 spot under Bitcoin.
Once this move starts and Litecoin starts going parabolic you will see the pump chasers and fomo rotating out of the already extremely overvalued trash they bought the top in to get into Litecoin. All the non believers, all the haters, all the wounded who sold angrily, everyone will pile into Litecoin. You will hear a lot of language especially from the haters saying that its just a pump and dump along the way. Eventually they will all change their tune when Litecoin continues to rise and rise and rise and wont stop. Dont be fooled and dont sell early, Litecoin is going to shock the entire world and thats not being dramatic. It will be on every news channel. Big institutions will be talking about it. Blackrock will get in along with all his buddies. Its coming I promise that. I had made my previous predictions not really knowing what the catalyst would be other than the charts and some on-chain data. Now I know why Litecoin will make that move I was predicting. The ETFs are going to bring in a flood of money like no one has see before and the world will realize that Litecoin is Bitcoin #2. The ones who missed Bitcoin at $1000 are going to flood into Litecoin for their chance to get the second faster Bitcoin.
I know I was wrong on the timing of the last predictions I made thinking that maybe it could have happened in 2024. I didnt expect the market to be this drawn out, I dont think anyone did. It is different this time despite what everyone else says. The cycles are getting longer and longer as more and more people enter the space. There isnt a huge rotation from Bitcoin into Alts anymore because now the ETFs are locking it up. No more Alt seasons like we were used to . I believe that my chart showing 13K for Litecoin is just the beginning. Litecoin will be worth 1/4 of Bitcoin in the future. I dont want to say that Litecoin could overtake Bitcoin but it might you never know this market is wild. Litecoin in these next few years and over the course of a couple cycles within this larger cycle we could see Litecoin at $50k each. Once all the money drains out of the overhyped and overacalued trash thats currently out there, they will eventually move into Bitcoin, and Litecoin. Maybe a couple others that are competing for the smart contract side of things but as far as Cryptocurrencies go Litecoin and Bitcoin are the only two that will remain relevant. The rest are just projects and platforms and wanna be Cryptocurrencies all the way down the line. Litecoin is about to create so many millionaires in such a short period of time its going blow everyone's mind.
Eventually Litecoin network will be so busy because of real world use, it'll have to stop mining Doge which is just a leech off the network. Miners wont waste energy on that. Doge will eventually move back down to where it came from. XRP holders will eventually realize that they have been duped into keeping the rich lifestyles of the Ripple team going for so many years on just hype. The meme coins are losing interest. All those holders are going to lose everything, literally. I cant believe how many have their entire investment in these silly Fartcoin, Titcoin and all the other ridiculous coins with zero value. They were fun to make quick money on but they are no longer as profitable and the risk is way higher than the reward now. Frogs, Dogs, Cats, Squirrels all are going to die and go to zero. The crypto market will be wrangled and only the strong will survive. All that capital will flood out of the trash and there will be a mad dash for actually utility. In the Dot com boom there were so many internet companies it was crazy but at the end of it only a few strong ones survived and thrived and became the powerhouses that we see today. Thats exactly what I see for the cryptospace.
Litecoin holders will soon be vindicated!
None of this is financial advice, this is just my opinion.

Litecoin Wyckoff Accumulation 2024One may dream that LTC truly follows suit and stay on course.
I do find Litecoin to act pretty technically accepting in the past but you never know...
Just wanted to throw this Idea out there and have a place to look back to when Litecoin takes off...

$LTC waking up - targetting $200!It’s been a while since we had a clear signal to long in crypto.
CRYPTOCAP:LTC looks healthy here—trade stays active as long as it holds above 114.
Buying into the 120s down to 116.
Targeting 200.
Both weekly and monthly trends are looking solid, so I’m jumping in just in case it pulls an XRP-like move. The hype might not be there, but I’d be happy with a 2x.
BINANCE:LTCUSDT

LTC sideways consolidation continuesThe LTCUSD price action sentiment appears neutral, supported by the longer-term sideways trading range.
The key trading level is at 1,286. An oversold rally from the current levels and a bearish rejection from the 1,286 level could target the downside support at 1,174 followed by the 1,086 and 973.6 levels over the longer timeframe.
Alternatively, a confirmed breakout above 1,375 resistance and a daily close above that level would negate the bearish outlook, opening the way for further rallies higher and a retest of 1,488 resistance followed by 1,576 levels.
This communication is for informational purposes only and should not be viewed as any form of recommendation as to a particular course of action or as investment advice. It is not intended as an offer or solicitation for the purchase or sale of any financial instrument or as an official confirmation of any transaction. Opinions, estimates and assumptions expressed herein are made as of the date of this communication and are subject to change without notice. This communication has been prepared based upon information, including market prices, data and other information, believed to be reliable; however, Trade Nation does not warrant its completeness or accuracy. All market prices and market data contained in or attached to this communication are indicative and subject to change without notice.

LTC analysis (12H)From the point where we placed the red arrow on the chart, it seems that LTC's correction has begun. Due to ETFs, there is a lot of FOMO around this asset, but it's better to analyze it technically.
It appears that LTC is in an ABC correction or a more complex pattern. Currently, it is in wave B, which is forming as a diametric. We can look for buy/long positions in the green zone.
A daily candle closing below the invalidation level will invalidate this analysis.
For risk management, please don't forget stop loss and capital management
Comment if you have any questions
Thank You

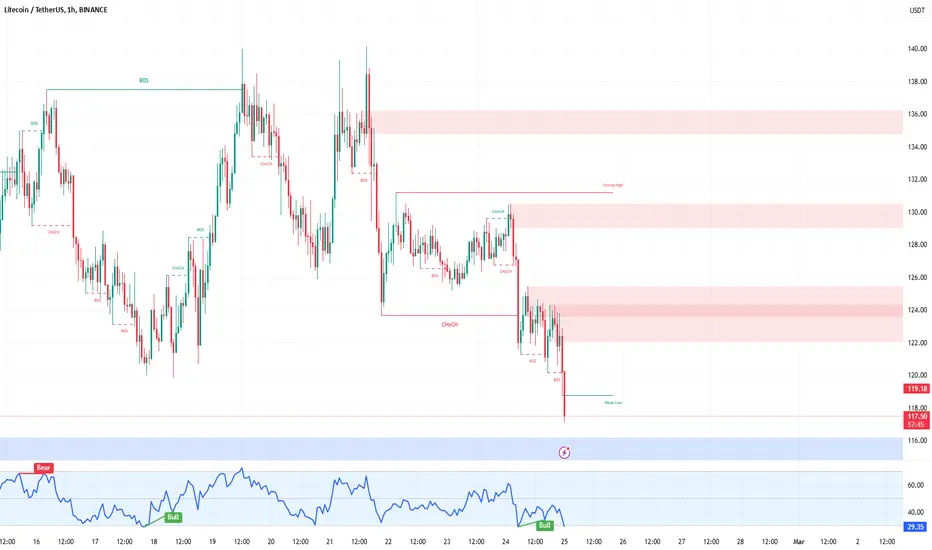
LTC/USDT 1H: Bearish Breakdown – Short Setup Targeting $115.50?LTC/USDT 1H: Bearish Breakdown – Short Setup Targeting $115.50?
🚀 Follow me on TradingView if you respect our charts! 📈 Daily updates!
Current Market Analysis:
Price at $119.85 showing strong bearish momentum.
Market makers appear to be in a distribution phase with clear lower highs.
Hidden bearish divergence on RSI confirms the downtrend.
Risk Score: 8/10 – High risk environment.
Market Maker Activity:
Distribution pattern is evident with lower highs.
Declining volume on bounces suggests persistent selling pressure.
Expect continued downside until testing support around $115.50.
Trade Setup (Confidence 8/10):
Recommendation: Short position with high confidence.
Entry: At current price ($119.85).
Targets:
T1: $118.00
T2: $115.50
Stop Loss: Set at $122.40 (above recent swing high).
Key Resistance Zones: $124.00, $128.50, $136.00
Recommendation:
Wait for confirmation of entry with a rejection around $122. This setup aligns perfectly with SMC principles, indicating strong institutional selling pressure.
🚀 Follow me on TradingView if you respect our charts! 📈 Daily updates!
Litecoin likely heading to $260.. Its one of the few cryptos with a monthly cross happening.. It is because this is one of the original 3 cryptos and it takes this long for some to have a monthly cross which is the most powerful cross possible next to a weekly or daily. So it should be extremely bullish if it breaks out.

Litecoin LTC Still Out Of Wedge Potential Drop Still In The CardAs you can see Litecoin is still out of the wedge. It looks like also on the BBWP a large move is coming. It doesn't tell us which way. You can see the two potential scenarios. The blue line shows that Litecoin could make a move back up to the trend line it may get rejected there but it also may break into the the wedge and then break down in a fake out. The other scenario would be it breaks into the wedge then breaks above that white trend line and stays above that, which would indicate to me that a downside break probably wouldn't happen. Just keep an on those levels. I would think this move happens tomorrow and Tuesday. I have buy orders down around 101-104. I also have a few down at 95-101 in case of a stray wick. In my opinion its a good opportunity to stack more. None of this is financial advice just my opinion.
Follow me for more continued updates and charts of your favorite coins. If you have any requests let me know and Ill try and do a chart and analysis for you. Thank you and have a wonderful day.

LTCUSD Resistance retest, The Week Ahead 24 Feb ‘25The LTCUSD price action sentiment appears neutral, supported by the longer-term sideways trading range.
The key trading level is at 1,209, 17th Feb swing low level. An overbought pullback from the current levels and a bearish rejection from the 1,209 level could target the downside support at 1,082 followed by the 1,000 level over the longer timeframe.
Alternatively, a confirmed breakout above 1,395 resistance and a daily close above that level would negate the bearish outlook, opening the way for further rallies higher and a retest of 1,523 resistance followed by 1,709 levels.
This communication is for informational purposes only and should not be viewed as any form of recommendation as to a particular course of action or as investment advice. It is not intended as an offer or solicitation for the purchase or sale of any financial instrument or as an official confirmation of any transaction. Opinions, estimates and assumptions expressed herein are made as of the date of this communication and are subject to change without notice. This communication has been prepared based upon information, including market prices, data and other information, believed to be reliable; however, Trade Nation does not warrant its completeness or accuracy. All market prices and market data contained in or attached to this communication are indicative and subject to change without notice.

Litecoin LTC Will Repeat The Same Pattern?Hello, Skyrexians!
Today it's time to update our BINANCE:LTCUSDT idea. It has formed the same pattern like we have seen before 2021 altseason. We know that patterns usually play out in the opposite direction than we saw in the past because of the trader's expectations, but this time we have some proofs that this pattern can play out the same.
Let's take a look at the weekly time frame. First of all we wanna you to notice the green dot on Bullish/Bearish Reversal Bar Indicator at the very bottom. This signal increases probability of a strong bull run until the red dot flashes. We also can count the Elliott waves. Wave 1 was in 2022-2023, and after that wave 2 was tricky flat correction and now price is in wave 3. Wave 3 has the target between 1.61 and 2.61 Fibonacci extension levels. The conservative target is $174, the optimistic is almost $250.
Best regards,
Skyrexio Team
___________________________________________________________
Please, boost this article and subscribe our page if you like analysis!

Inverted Head and Shoulders?Possible inverted head and shoulders forming on the 4h for LTC/USDT. If it breaks up, target short term price is 157. Lots of resistance around 135. We need to see more buy volume to confirm break out. Could head back down to test level, confirm then head back up to target price over the weekend.

Litecoin ETF Approval Odds Soar to 85%—What’s Driving the Surge?The race for altcoin ETFs in the U.S. just took a significant leap forward. Litecoin ETF approval odds on Polymarket skyrocketed to 85%, following the listing of Canary Capital’s proposed Litecoin ETF on the Depository Trust and Clearing Corporation (DTCC) system.
This move mirrors the Ethereum ETF approval process, which saw its green light from the SEC in May 2024. While DTCC listing doesn’t guarantee SEC approval, it’s a crucial preparatory step that shows the application is progressing.
Why Does This Matter?
📌 Polymarket Odds Up 35% – Investor confidence in a Litecoin ETF is surging.
📌 DTCC Listing Signals Progress – Canary Capital’s application is moving through key procedural steps.
📌 Institutional Interest Growing – Asset managers like Grayscale and CoinShares are positioning Litecoin-based financial products.
The SEC’s Next Move
Canary Capital first filed for a spot Litecoin ETF in October 2024. While its status as a Bitcoin fork and commodity classification may work in its favor, the SEC’s cautious approach could still delay approval.
📌 Optimistic Case: SEC approval could boost institutional adoption and significantly impact LTC’s price.
📌 Bearish Case: If the SEC delays or denies the application, Polymarket odds could tumble, and LTC may stagnate.
Despite this news, Litecoin’s price reaction has been muted, up only 3.37% to $134.25 since Friday. The next major price move will likely depend on further SEC developments.
The question remains—will the SEC push Litecoin into the ETF era, or is this another case of premature optimism?

LTC BUYhello guys
Considering the good growth of the price and after its correction, now is a good opportunity to enter into a transaction with capital management.
We have specified a target for you.
*Trade safely with us*

LTC BUYhello friends
According to the good trend we have, now we can buy in steps with risk and capital management in the price correction in the lower time frame.
*Trade safely with us*

Litecoin - Looking To Buy Pullbacks In The Short TermH4 - Bullish trend pattern
Currently it looks like a pullback is happening
Until the strong support zone holds I expect the price to move higher further after pullbacks.

LTC has completed the accumulation phase! LTC completes its accumulation phase of more than 896 days and is preparing for a breakout! I would expect a hike to the 0.786 Fibonacci level, as this is a project with huge capitalization, but with poor usability. With spillovers from Bitcoin, Ethereum and Solana it could show huge growth!
Horban Brothers.

LTCUSD - First Target This first target has been the peak several times for bulls before during bull markets and I think price will hit some resistance here
If I am correct and the alt bullrun ensues then LTC will target this area first
Price is currently within a bullflag type structure, looking to breakout.
4Hr chart

BTC > ETH > LTC 2021 Cycle Price ActionHere is an idea with the price action of BTC > ETH > LTC during the last cycle as it relates to out recent cases on BTC.
