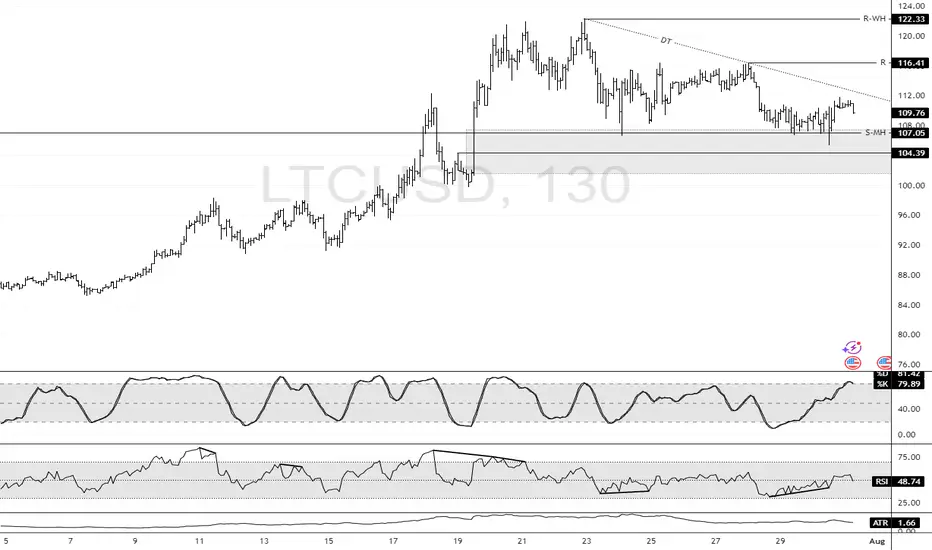
LTC: Bullish Structure Intact Above $104.3 SupportFenzoFx—Litecoin swept liquidity below $107.0 during today’s session and is currently trading near $110.0, supported by a descending trendline.
Technically, key support stands at $104.3. As long as this level holds, the bullish outlook is preserved. A break above the descending trendline could propel LTC toward the previous highs at $116.4 and potentially $122.3.
Litecoinanalysis
Litecoin: VWAP and Oversold Signal Potential BounceFenzoFx—Litecoin formed a double top at $116.4, causing a price dip. Currently, LTC trades near $110.1 after forming a double bottom. The Stochastic Oscillator is in oversold territory, suggesting a potential bounce, supported by VWAP from July 15.
Technically, if LTC holds above $110.1 and key support at $104.0, the uptrend could resume. In this scenario, the bullish targets would be $116.4 and $122.3.

Litecoin Rebounds Off Trendline in Bullish Continuation SetupFenzoFx—Litecoin rebounded from the ascending trendline, a demand zone supported by the VWAP from July 25th.
Immediate resistance stands at $114.3. A close above this level may resume the bullish trend, potentially targeting previous highs near $114.3.

Litecoin - Expecting Bullish Continuation In The Short TermH4 - We have a clean bullish trend with the price creating a series of higher highs, higher lows structure.
This strong bullish momentum is followed by a pullback.
No opposite signs.
Until the two Fibonacci support zones hold I expect the price to move higher further.
If you enjoy this idea, don’t forget to LIKE 👍, FOLLOW ✅, SHARE 🙌, and COMMENT ✍! Drop your thoughts and charts below to keep the discussion going. Your support helps keep this content free and reach more people! 🚀
--------------------------------------------------------------------------------------------------------------------

Litecoin Retests $112.3 Support Amid Bullish MomentumLitecoin remains bullish above the 50-day SMA, supported by an ascending trendline. As of now, LTC trades near $113.0, retesting this area as support. A sustained hold above the trendline could initiate another bullish leg, targeting resistance at $130.3.
However, a close and stabilization below the trendline would invalidate this outlook and suggest increased selling pressure.

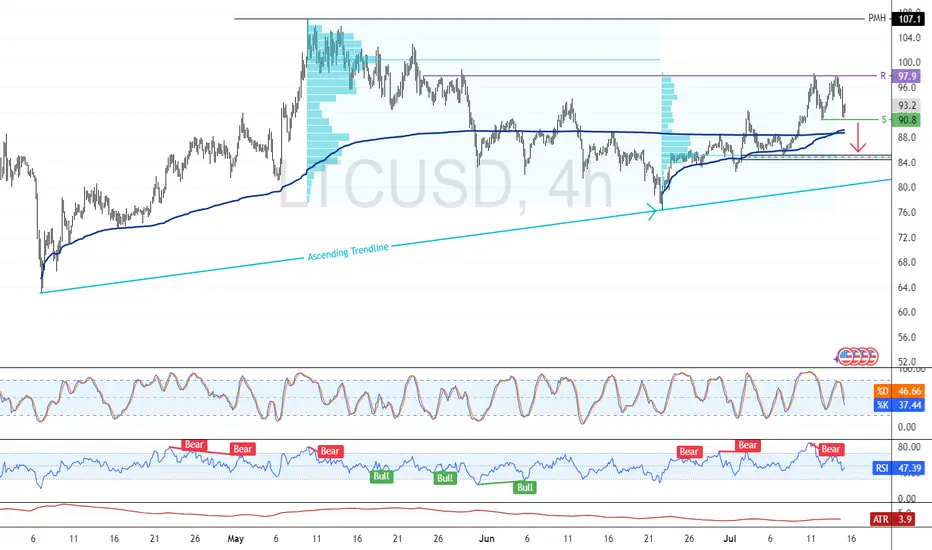
Litecoin: Volume-Heavy Resistance Caps RecoveryFenzoFx—Litecoin fell 2.50% today, forming a double bottom at $90.80. If bears stabilize the price below this level, the decline could extend toward $85.20 support.
Resistance at $97.90 aligns with a high volume zone, reinforcing bearish pressure and making a breakout challenging.
Litecoin Faces Resistance at $92.32 Amid Overbought SignalsFenzoFx—Litecoin is overbought as price nears resistance at $92.32. Stochastic reads 91.0, suggesting an overbought market. If LTC stays below $92.32, a bearish wave may emerge, targeting $88.47 support.
However, a close above $92.32 could trigger a bullish move toward the $100.0 mark, reinforcing the upward trend.

Litecoin Eyes Breakout Above $88.5 ResistanceFenzoFx—Litecoin climbed from $85.7 and is currently testing resistance at $88.5. The market remains bullish above $84.5, a support backed by the Fair Value Gap.
If bulls manage a close above $88.5, momentum may build toward last week's high at $92.3. However, a drop and stabilization below $84.5 would shift focus to the weekly low at $82.4.

Litecoin Rebounds from FVG with $902.3 in SightFenzoFx—Litecoin is trading just below the $88.6 resistance after bouncing from the bullish fair value gap near $85.5.
If the $88.60 resistance is breached, LTC could aim for the previous week's high at $902.3. Please note that the bullish view remains valid above $82.4.

LTC Buy / Long SetupAs price wants to move in a range, SO that's another setup for LTC, invalidation is same as for short setup, candle closing below the mention zone immediately close the trade otherwise wick doesn't matter, wick do the damage body tells the story.

Bullish Momentum Possible While LTC Holds Above $86.93Litecoin pulled back from $92.32, dipping to a key support at $88.52, backed by Anchored VWAP. Stochastic shows oversold conditions, signaling a potential rebound.
If $88.52 holds, a bullish wave toward $92.32 could follow. The outlook stays positive above $86.93;

Litecoin Encounters Resistance After Sharp RallyLitecoin climbed from $82.4 and is testing the bearish fair value gap at $90.4. With Stochastic showing short-term overbought conditions at 87.0, consolidation is expected.
LTC may retest $89.0 and then dip toward support at $86.9, which aligns with a volume point of interest. The bullish view holds above $82.4; below it, the outlook weakens.

LTC Approaches Support Zone with Breakout PotentialFenzoFx—Litecoin dropped 1.92% after approaching the $89.0 resistance. It now trades near $86.4, a zone aligned with a high-volume node and previous daily low.
Support ranges from $85.9 to $83.2. If LTC stays above $83.2, a bullish breakout above $89.0 may follow. A close below $83.2 invalidates this outlook.

Overbought LTC Faces Pressure at $85.0 BarrierLitecoin is building liquidity near $85.0, a strong resistance backed by volume, with Stochastic at 92.0 indicating short-term overbought conditions.
If LTC dips below $83.86, a bearish wave may follow toward $82.33 and $79.51. Conversely, a close above $87.99 could resume the uptrend toward $88.98.

Litecoin Confronts $86.0 Resistance as Overbought Signals EmergeFenzoFx—Litecoin is testing $58.99, which aligns with a 4-hour bearish Fair Value Gap. Stochastic reads 84.0, suggesting overbought conditions.
If $85.99 resistance holds, a bearish move toward $84.19 and possibly $81.01 could follow.

LTC/USD Consolidates—Key Levels to Watch FenzoFx—Litecoin consolidates near $85.0, with key support at $81.0, aligning with last week's low. If support holds, LTC/USD could target $90.4. A drop below $81.0 invalidates the bullish outlook.

Litecoin is Oversold—Is a Rebound Coming? FenzoFx—Litecoin swept liquidity below the previous week's low, aligning with the monthly low at $81.01, a strong support zone.
LTC trades near $83.70 with weak bullish sentiment. Stochastic at 11.00 signals an oversold market, suggesting potential consolidation or a rebound.
A bullish wave may emerge if LTC holds above $81.01, targeting $91.92. Closing below this level invalidates the bullish outlook.

Litecoin Hits Key ResistanceFenzoFx—Litecoin took buy-side liquidity at the $91.02 resistance, aligning with monthly highs. A bearish FVG emerged, signaling selling pressure in Tokyo's session. The Stochastic Oscillator at 81.0 suggests a potential bearish wave.
A bearish trend may form if LTC stabilizes below $91.02, targeting $86.77. However, if Litecoin breaks above this level with a bullish engulfing candlestick, the bearish outlook is invalidated.

ICT Strategy Signals Bearish Outlook for LTCFenzoFx—Litecoin consolidates near 87.1 after Saturday’s price action, down 0.09% today. ICT analysis places LTC in the premium pricing area, favoring short positions.
Immediate resistance at 89.36 remains untested, while support lies at 86.61. Traders should wait for LTC to test resistance and watch for bearish signals like candlestick patterns and an inverted Fair Value Gap (FVG). If resistance holds, LTC could break below support, aiming for 85.17.
The bearish outlook remains valid as long as 91.02 holds as resistance.
>>> Trade LTC swap free at FenzoFx.

Litecoin - Expecting Bearish Continuation In The Short TermM15 - Clean bearish trend with the price creating series of lower highs, lower lows.
No opposite signs.
Expecting further continuation lower until the two Fibonacci resistance zones hold.
If you enjoy this idea, don’t forget to LIKE 👍, FOLLOW ✅, SHARE 🙌, and COMMENT ✍! Drop your thoughts and charts below to keep the discussion going. Your support helps keep this content free and reach more people! 🚀
--------------------------------------------------------------------------------------------------------------------
Disclosure: I am part of Trade Nation's Influencer program and receive a monthly fee for using their TradingView charts in my analysis.

Litecoin’s FVG at $85.8: A Key Pivot the Next LegFenzoFx—Litecoin’s momentum weakened from $91.00 to $87.40, now trading around $87.44 as the London session begins.
Early in the session, LTC took out the Asian session’s low, signaling a liquidity grab. The $87.44 support zone aligns with a bullish Fair Value Gap (FVG) and Monday’s low.
If the FVG holds, LTC/USD could push toward $89.11, the Asian session high, with $90.99 as the next bullish target. However, $90.99 forms a double top, with sell limits and buy stops above—potential liquidity. If $86.00 holds, this could be the next target.

Litecoin Consolidation Nears End—New Downtrend Ahead?FenzoFx—Litecoin's consolidation near $91.0, marking 50% of its previous bearish leg, may be nearing its end as a long-wick bearish candlestick forms on the 4-hour chart.
Key support lies at $88.7, and a close below this level could trigger a downtrend targeting $87.00 and $86.00. The bearish outlook remains intact below $92.39 resistance.

Bearish Pressure Eases—Can Litecoin Recover?FenzoFx—Litecoin remains bearish after breaking below $93.55, though selling pressure eased near $83.0. Currently, LTC/USD is testing the bearish Fair Value Gap at $87.5.
A recovery toward $93.55 is possible if price closes above the $88.0–$90.0 zone, allowing bullish momentum to extend toward $92.00.
However, a dip below $85.0 would invalidate this outlook, with the next bearish target at $81.0.
