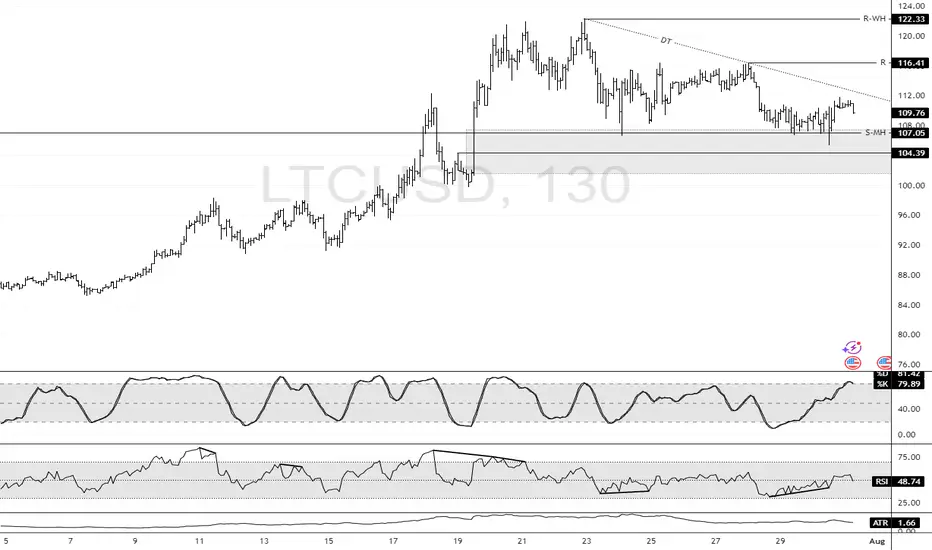
LTC: Bullish Structure Intact Above $104.3 SupportFenzoFx—Litecoin swept liquidity below $107.0 during today’s session and is currently trading near $110.0, supported by a descending trendline.
Technically, key support stands at $104.3. As long as this level holds, the bullish outlook is preserved. A break above the descending trendline could propel LTC toward the previous highs at $116.4 and potentially $122.3.
Litecoinforecast
Litecoin: VWAP and Oversold Signal Potential BounceFenzoFx—Litecoin formed a double top at $116.4, causing a price dip. Currently, LTC trades near $110.1 after forming a double bottom. The Stochastic Oscillator is in oversold territory, suggesting a potential bounce, supported by VWAP from July 15.
Technically, if LTC holds above $110.1 and key support at $104.0, the uptrend could resume. In this scenario, the bullish targets would be $116.4 and $122.3.

Litecoin Rebounds Off Trendline in Bullish Continuation SetupFenzoFx—Litecoin rebounded from the ascending trendline, a demand zone supported by the VWAP from July 25th.
Immediate resistance stands at $114.3. A close above this level may resume the bullish trend, potentially targeting previous highs near $114.3.

Litecoin - Expecting Bullish Continuation In The Short TermH4 - We have a clean bullish trend with the price creating a series of higher highs, higher lows structure.
This strong bullish momentum is followed by a pullback.
No opposite signs.
Until the two Fibonacci support zones hold I expect the price to move higher further.
If you enjoy this idea, don’t forget to LIKE 👍, FOLLOW ✅, SHARE 🙌, and COMMENT ✍! Drop your thoughts and charts below to keep the discussion going. Your support helps keep this content free and reach more people! 🚀
--------------------------------------------------------------------------------------------------------------------

Litecoin Retests $112.3 Support Amid Bullish MomentumLitecoin remains bullish above the 50-day SMA, supported by an ascending trendline. As of now, LTC trades near $113.0, retesting this area as support. A sustained hold above the trendline could initiate another bullish leg, targeting resistance at $130.3.
However, a close and stabilization below the trendline would invalidate this outlook and suggest increased selling pressure.

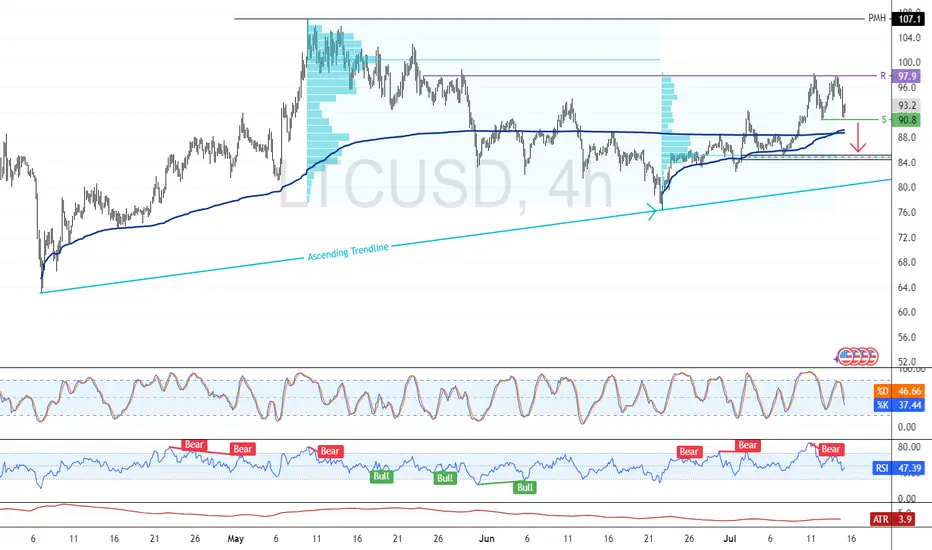
Litecoin: Volume-Heavy Resistance Caps RecoveryFenzoFx—Litecoin fell 2.50% today, forming a double bottom at $90.80. If bears stabilize the price below this level, the decline could extend toward $85.20 support.
Resistance at $97.90 aligns with a high volume zone, reinforcing bearish pressure and making a breakout challenging.
Litecoin Faces Resistance at $92.32 Amid Overbought SignalsFenzoFx—Litecoin is overbought as price nears resistance at $92.32. Stochastic reads 91.0, suggesting an overbought market. If LTC stays below $92.32, a bearish wave may emerge, targeting $88.47 support.
However, a close above $92.32 could trigger a bullish move toward the $100.0 mark, reinforcing the upward trend.

Litecoin Eyes Breakout Above $88.5 ResistanceFenzoFx—Litecoin climbed from $85.7 and is currently testing resistance at $88.5. The market remains bullish above $84.5, a support backed by the Fair Value Gap.
If bulls manage a close above $88.5, momentum may build toward last week's high at $92.3. However, a drop and stabilization below $84.5 would shift focus to the weekly low at $82.4.

Litecoin:Is the main climb coming?hello friends👋
As you can see, the price, after falling in the support area specified by the buyers, has been supported and returned, forming an upward pattern.
Now we don't enter into a transaction with just one pattern, we also check the entry of buyers and the amount of currency and other factors and draw conclusions.
According to the points we have said, we have identified very important support points for you to buy step by step with capital and risk management and move to the specified goals.
🔥Follow us for more signals 🔥
*Trade with us safely*

Litecoin Rebounds from FVG with $902.3 in SightFenzoFx—Litecoin is trading just below the $88.6 resistance after bouncing from the bullish fair value gap near $85.5.
If the $88.60 resistance is breached, LTC could aim for the previous week's high at $902.3. Please note that the bullish view remains valid above $82.4.

LTC Short SetupWait for the entry and execute, SL is smaller and if candle closes strongly above the zone then must close the trade. Hopefully it won't break easily this zone as bearish fvg + bearish order block lies here.

LTC Buy / Long SetupAs price wants to move in a range, SO that's another setup for LTC, invalidation is same as for short setup, candle closing below the mention zone immediately close the trade otherwise wick doesn't matter, wick do the damage body tells the story.

Bullish Momentum Possible While LTC Holds Above $86.93Litecoin pulled back from $92.32, dipping to a key support at $88.52, backed by Anchored VWAP. Stochastic shows oversold conditions, signaling a potential rebound.
If $88.52 holds, a bullish wave toward $92.32 could follow. The outlook stays positive above $86.93;

Litecoin Encounters Resistance After Sharp RallyLitecoin climbed from $82.4 and is testing the bearish fair value gap at $90.4. With Stochastic showing short-term overbought conditions at 87.0, consolidation is expected.
LTC may retest $89.0 and then dip toward support at $86.9, which aligns with a volume point of interest. The bullish view holds above $82.4; below it, the outlook weakens.

LTC Approaches Support Zone with Breakout PotentialFenzoFx—Litecoin dropped 1.92% after approaching the $89.0 resistance. It now trades near $86.4, a zone aligned with a high-volume node and previous daily low.
Support ranges from $85.9 to $83.2. If LTC stays above $83.2, a bullish breakout above $89.0 may follow. A close below $83.2 invalidates this outlook.

Overbought LTC Faces Pressure at $85.0 BarrierLitecoin is building liquidity near $85.0, a strong resistance backed by volume, with Stochastic at 92.0 indicating short-term overbought conditions.
If LTC dips below $83.86, a bearish wave may follow toward $82.33 and $79.51. Conversely, a close above $87.99 could resume the uptrend toward $88.98.

Litecoin LTC price analysisToday we will analyze the third candidate for ETF in the near future is CRYPTOCAP:LTC
An old coin, good fundamentals, 1:1 tokenomics like CRYPTOCAP:BTC but 4 times more coins, untapped potential, and the list goes on...
♎️ The main difference from the previous two candidates is the current market cap of the coins: CRYPTOCAP:XRP - $118 billion, CRYPTOCAP:SOL - $72 billion, #Litecoin only $6 billion
Accordingly, the prospects for growth in the price of OKX:LTCUSDT are many times greater
🔥 Currently, #LTCUSD price is near the potential purchase zone of $71.25-76.25
📈 Growth potential of at least $170-180
🐻Critical level of $67
_____________________
Did you like our analysis? Leave a comment, like, and follow to get more

Litecoin Confronts $86.0 Resistance as Overbought Signals EmergeFenzoFx—Litecoin is testing $58.99, which aligns with a 4-hour bearish Fair Value Gap. Stochastic reads 84.0, suggesting overbought conditions.
If $85.99 resistance holds, a bearish move toward $84.19 and possibly $81.01 could follow.

Litecoin - Expecting Bearish Continuation In The Short TermM15 - Clean bearish trend with the price creating series of lower highs, lower lows.
No opposite signs.
Expecting further continuation lower until the two Fibonacci resistance zones hold.
If you enjoy this idea, don’t forget to LIKE 👍, FOLLOW ✅, SHARE 🙌, and COMMENT ✍! Drop your thoughts and charts below to keep the discussion going. Your support helps keep this content free and reach more people! 🚀
--------------------------------------------------------------------------------------------------------------------
Disclosure: I am part of Trade Nation's Influencer program and receive a monthly fee for using their TradingView charts in my analysis.

LTC/USDT 1-Hour Chart – Symmetrical Triangle Alert! Litecoin is gearing up for a big move on the 1-hour chart!
We’ve got a textbook Symmetrical Triangle forming, with LTCUSDT squeezing tighter and tighter between converging trendlines. The price is now approaching the upper resistance of the triangle around $104. This setup is screaming breakout potential!
If LTC clears the triangle’s resistance, we could see a strong push toward the $111.01 target — a key resistance level to watch. On the flip side, if it fails to break out, the $92.16 level (now potential support) will be critical to hold. Volatility is coming, and I’m ready for it — are you? Let’s see if Litecoin can spark a rally!
Key Levels to Watch:
Support: $92.16 (previous resistance, now support)
Resistance: $104 (triangle upper boundary)
Target: $111.01 and $125 (next major resistances)
What’s your take, traders? Are we breaking out or pulling back? Drop your thoughts below!

Litecoin is ready for a massive pump!A lot of people have no idea just how big the Litecoin pump could be. We’ve had a huge multi-year accumulation, very similar to the early days of Nvidia. I believe we will see the fruition of this accumulation very soon. This could send Litecoin soaring to a new all-time high and kick off a massive bull market.
As always, stay profitable.
– Dalin Anderson

Bearish Trend Persists: Litecoin Targets $71.0FenzoFx—Litecoin is trading at $75.9 after closing below $76.4 and testing it as resistance. The Stochastic Oscillator signals oversold conditions, suggesting a possible price bounce, although the bearish trend persists below $80.0.
If the bearish momentum continues, the next target could be $71.0.
Alternatively, stabilization above $80.0 may extend gains toward $88.5.
>>> No Deposit Bonus
>>> %100 Deposit Bonus
>>> Forex Analysis Contest
All at F enzo F x Decentralized Forex Broker

LTC's Bullish Momentum Eased at $80.0FenzoFx—Litecoin's uptrend eased at the $80.0 resistance level. A close above this resistance could trigger the uptrend, targeting $88.5.
The support is at $76.4.
>>> $1,600 prize pool > Join FenzoFx Forex Analysis Contest
