Litecoin pushing Higher to $175 potentiallyLitecoin has made 11% gains in the past 24hours. Next wave up Litecoin can definitely reach $175 within the week.
Litecoinusd

Litecoin 💥🚀🌚⚡ #Litecoin $LitecoinIt has been a few days since LightQueen Trend broke its 67-day bearish trend and started moving towards its price targets. The price targets and their resistances are plotted on the chart. The resistance between the price of 255 and 260 is very strong and it is important to break and stabilize it.
Currently, due to the increase in the bitcoin range and its movements, all altcoins will be affected by it. The analysis is just a series of probabilities.
I hope you find this analysis useful🌹
Follow for more...
#DYOR

INVERTED HEAD AND SHOULDERS @ LITECOINFolks,
Morning we see a Inverted head and shoulders on the 4 hour lite coin chart. Getting excited now..
The overall trend is bullish but for a good buying opportunity you have to be a little patient.
I want to see price rebound at retest $147.- or maybe even lower to have a good buying opportunity!
While writing the recent candle is becoming a form of a shooting star at a ' high price area' / known as resistance.
But still 1.5 hour before new candle starts so everything can change, still.. but just to be aware..
It can be the start of a three river evening star pattern... Maybe ;)
To be continued!!

LtcUsd- And up we brokeIn yesterday's comment, I said that Litecoin is waiting for a trigger for breaking up.
With the new wave of optimism in the crypto market, LtcUsd has broken above 150 important resistance and I expect continuation.
As I said, my target is 200usd zone
150 is now support and, in my opinion, should be bought

Litecoin- waiting for a triggerLike all the crypto market, Litecoin also corrected hard, dropping around 75% from top to bottom.
100 is strong support for this crypto and we can have a double bottom in place.
At this point, LtcUsd is trading just under 150 neck-line resistance and a new wave of optimism could lead to a break.
The measured target is 200

Staggered Rise Leading to Massive IncreaseOn both charts Bitcoin Diamond and Litecoin we can see the similarities, both with a large rise then following a pullback
Linked below is a great fractal showing the potential of this formation
I am seeing this formation more commonly across the board

LITECOIN PARABOLIC 0.025 LTC/BTCEnglish:
Litecoin is the sleeping giant. Starting in December Litecoin will start to rise quite a bit In the previous halving it has touched 0.025 LTC / BTC and a parabolic pattern has been created.
Litecoin may take longer to rise than other cryptocurrencies but it is inevitable that it will end up rising and when it does, you wish you were inside.
Español:
Litecoin es el gigante dormido. A partir de diciembre, Litecoin comenzará a subir bastante En halving anterior ya tocó 0.025 LTC / BTC y se ha creado un patrón parabólico.
Litecoin puede tardar más en subir que otras criptomonedas, pero es inevitable que termine subiendo y, cuando lo haga, desearía estar dentro.

Litecoin UPDATE HEAD AND SHOULDERSHi Folks,
These consolidation times are often very boring.. we want action.. But do you know that for 2/3 of the times the markt is going sideways/consolidates.
And 1/3 of the time it goes either in an uptrend or downtrend..
What is your strategy?
One of mine is to look for pullbacks/retracement (A real retracement in an uptrend is a decline between 33%-66%) did you know?
So think about the money that can possibly be made in pullback strategies..
The setback in this LTC/USDT chart depends likely on what the price of bitcoin will do..
For now the market is searching for direction..

Update LITECOIN HEAD AND SHOULDERSFolks,
Excuse me for drawing the neckline wrong..
Here is the update with the right drawings..

HEAD AND SHOULDER IS THAT YOU??Folks,
Be aware of a possible head and shoulders pattern in the Litecoin/USDT pair on the 4 hour chart.
The first breakdown of the neckline has got rejected by the bulls.. But simply if it breaks be aware of prices fall back at the horizontal line drawn..
How do you target this?
You take the highest price at the head formation and calculate the % it falls back to the neckline.
Than
You take the same % percentage from the neckline down.. and that is your target price when the neckline breaks and it is a confirmed head and shoulders pattern.
There is a lot of symmetrical in trading...

LTCUSD is in a ascending channelLITECOIN change its trend after a long short trend and now it is in a strong ascending channel. its look that LITECOIN wants to rest and become range after a spike. then it continue the trend and goes up till higher target (148.00) .

LTC Dominance - Very Bullish ScenarioMirroring 0.618's climb within the circle
1.618's climb within the circle may result like this
A result of this would be temporarily extremely bullish for LTCUSD

Litecoin- 80 zone is my targetLike a lot of coins, also Litecoin is pressing in an important support
This support is too obvoius for me to believe in it and I expect a breakdown
80usd zone can be the target for bears and only from there I expect a genuine rally

LTC/ETH trend change? An idea for LTC/ETH
it has been in a pretty strong downtrend
is the touch on the 1.618 fib circle an indicator for a reversal? Yes

Litecoin has massive pump potential LTCUSDon the LTCBTC chart the 1.618 fib level is a point of interest, where price will likely be rejected bullishly with aggression
As has been observed in the past
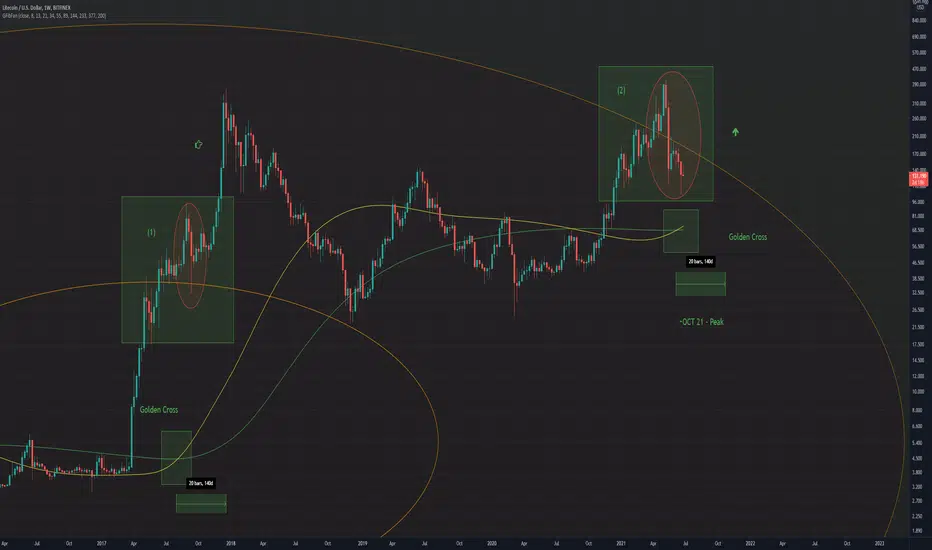
On the USD pair a Golden cross has been recently observed, the previous golden cross on LTCUSD led to the ATH
Will we see ATH this year? likely.
Deathcrosses in red, golden crosses in green
(1) is a comparison point of very similar price action


LTC is not ready yet. Hello everyone, looks like LTC is not able to move any further for the time being.
Even if I am bearish on Litecoin and on many others Altcoins, there is always the possibility that Litecoin turns bullish if it breaks through the resistance line.

Red Alert 🔴 Descending Triangle broken fall upto 31162, 30029Hello Everyone,
Already said in previous post 32700 low is very crucial for Bulls if broken this whole recent structure will be invalidated.
Now if we break 🔴 with the force 32230 fall up to 31162, 30029 not ruled out.
Stay tuned as always for any fresh updates. Give a Thumbs Up 👍
Success is always rented not owned and the rent is due every day.
Patience and Right-Timing are our Life-Partners.
Why follow 10xBulls Community?
1. A Global Community of Smart and Sniper Investors, Traders, and Venture Capitalists over 11 Years in the Markets
2. Successfully Anticipated Bulls and Bears Cycle for Cryptos, US, European and Asian Markets since 2010.
3. Update of the latest important news and our point of view on it.
4. Analysis of popular crypto tweets posts effect.
Happy Investing and Trading, we would love to hear your point of view/feedback in the comments below.
Team 10x Bulls. ⚡️

Common Bullish Advancement StructureAIONUSD and LTCUSD are both sharing a similar bullish advancement structure.
This is a common one for Litecoin with a similar pattern appearing before the massive move to ~300 in 2017
I will link the chart below
I have seen this structure across many coins, a good sign?

Litecoin Golden CrossSimilarities in price and indicators can be seen between now and late 2017
Late 2017 price dipped and touched briefly the .618 fib level
Now the price has dipped touching the 1.618 fib level
In both situations a golden cross was present
This leads me to believe a nice run is coming for Litecoin within the year
Buy while its cheap!
LTC BTC - from bottom to top within 4-8 weeks on AVERAGEAccording to historical performance, LTC only takes 4-8 weeks to go from the macro bottom to the macro top.
If BTC recovers properly within the next few days, I assume for history to repeat. For all those who are blind, if BTC has not been manipulated (according to on-chain data this has clearly been the case) to -55%
then LTC could have already seen 0.015 BTC by now, just like ETC which followed right after the ETH euphoria.

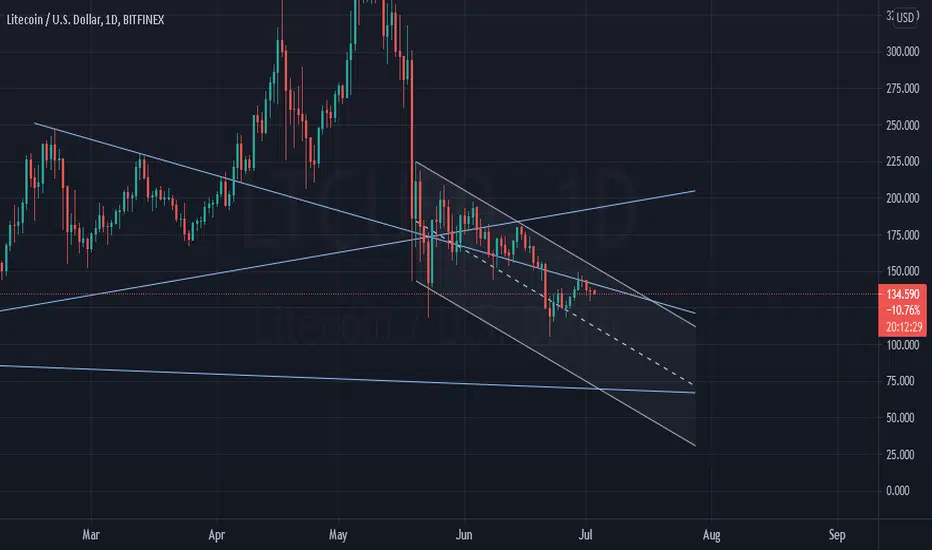
Litecoin - Time To Start Scaling In?Litecoin has been my main focus throughout this bull market in cryptos.
Let's zoom out on the COINBASE:LTCUSD chart. You can see the rising wedge pattern that I've been covering for the past 6 months or so had a decisive break down around mid-May. This was our flashing "sell signal." But as you can see from the arc structure, this bull isn't done running just yet.
Where are we today? Yet another Elon tweet about Bitcoin sends all cryptos lower - for now. But as you can see on the chart, price is very close to a brick wall of support. Not only is the edge of the arc currently sitting right around $140, but we also have the 50, 100, and 200 day moving averages coming in as backup. Don't be surprised if within the next few weeks, Litecoin decides to take off like a rocket ship and bring price back towards the top of the arc around $325-$425. However, one thing I will also be watching for is a break below the arc, which would signal the bull is taking a rest for now. Although that scenario is highly doubtful, should that happen, I'll be on the sidelines for a while waiting for my signal to get back in.
The featured content is intended to be used for informational purposes only. Everything shared here is my own opinion. It is very important to do your own analysis before making any investment based on your own personal circumstances. Please subscribe to our channel if you like what you are seeing!
